Summary
At the beginning of last year the prospects for capital markets were grim yet the results surprisingly good: positive returns and modest economic growth. The cause was central banks in developed countries acting as a backstop for sovereign and other large debts, through direct purchasing funded by accelerated money printing. This also ensured low interest rates. Subsequently, mountainous debt problems are slowly being tackled, even as they appear to increase. There are always risks. One is that governments develop fiscal prudence; another is a loss of trust in money itself. However, low interest rates and money printing will be maintained for far longer than expected. Last year benefited bonds the most. Now there is an accelerating flow into real assets and businesses – equities. It is undeniable that several sectors are at the upper end of historic valuations but corrections are expected to be brief because of these banking policies, more money flowing into equities and of reasonable growth in profitability.
The portfolio lagged over the full year, largely because of its gold and energy holdings, although the companies owned mostly outperformed the changes in their respective sectors. The current profile shows EPS growth nearly three times greater than the index, yet at the same multiple and considerably cheaper on price-to-book and price-to–sales, with lower debt to equity.
Unusual polices are creating multiple market opportunities but there are always areas of concern. Currency manipulation has always been a part of every national treasury’s toolbox. An unusual number of countries are using it at the same time. This will cause rapid valuation changes so must be monitored closely. In many developing countries their debt markets are lethally over-valued as foreign investors plunge in at an unprecedented rate and size, with little regard to normal cyclical risks. There will be pain.
Section 1: Reasons to be cheerful in 2013
The outlook for capital markets last year started badly then deteriorated. Decision making within the eurozone had become paralysed, threatening a collapse in the banking system as deposits in the weaker members fled overseas and foreign investors dumped their government bonds. The break-up of the EU itself and the collapse of the eurozone were threatening, along with multiple sovereign defaults. Japan was suffering policy paralysis as it entered its second decade of deflation and third of moribund economic growth. In America, politicians and the Federal Reserve Bank came to realise that the silver bullet of quantitative easing was having little effect on employment, consumption or house prices; worse, for every dollar borrowed there was less than 40 cents of growth, and that not necessarily QE-related.
The outcome was the reverse - positive returns, in line with the long term averages. Economic activity plodded along but at least there was growth. In the second half, house prices stabilised and often rose marginally. Unemployment stabilised overall in most industrial nations. These better than expected results were because of identical policy changes in the advanced countries. Debates which had raged over where and by whom losses should be taken ceased. Governments through their central banks decided to backstop all significant debts if they could not be repaid, from over-extended banks to home owners and most important, national bond markets. The exemplar was ECB Chairman Mario Draghi who vowed dramatically “to do whatever it takes”. This was delivered by printing enough money to buy all the eurozone sovereign bonds that the market refused to take.
As widely covered by many commentators, these policies are unique, carry many risks and are designed to be inflationary; they are stretching trust in the great paper money experiment to molecule thinness. (This commenced in 1971, as America was forced off the gold standard.) Yet they have worked, and are likely to continue so doing.
Chart 1. Rising debt and budget deficits
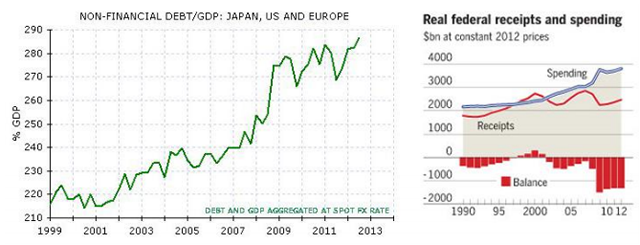
Sources: Morgan Stanley, Financial Times
Bad news makes better copy than good news. The record level of government and nongovernment debt across the developed countries and its parabolic increase make a strong case for financial millenarianism, advocates of which seemingly crave a collapse. Much evidence is on their side. The first (US) debt ceiling was legislated in 1917 and has been increased 107 times since. The annual compound growth rate in the debt ceiling has been 8.4%, that of nominal GDP 6.3%. Over time this has created an awesome debt gap.
In other countries such as the UK, the data is also alarming. If the current coalition government survives until its target date of 2015 and that debt increases at the same rate as the last three years, not only will it have borrowed more than the previous, and largely despised, administration of the preceding 10 years, the total level will be more than all the debt accumulated over the previous two centuries.
Harbingers of doom frequently highlight that budget deficits in industrialised nations are showing signs of becoming structural, i.e. permanent. International lenders such as the IMF, World Bank and the ECB constantly have to recalculate their growth and deficit assumptions because economic activity has not improved sufficiently to increase revenue from taxation, whilst expenditure, although sometimes declining, has been curbed too slowly. Other well documented statistics are not encouraging. Many countries have worsening demographics, a problem even in China. The results are soaring medical and welfare costs. Real incomes are being squeezed; productivity is usually flat at best, and often falling.
These many problems are serious but it would be blinkered to deny any possible solution without puritanical self-flagellation and financial austerity. High ratios of national debt to GDP are only a problem if the interest cannot be paid to investors, or there are no buyers when expiring bonds are rolled over into new ones. Now that Japan has adopted similar tactics to the west, central bank policies in the developed world are clear and uniform. They are simple and easy to execute: to hold interest rates at an artificially low level for as long as necessary. This is inflationary, which is the long term target. It will involve some „financial repression‟ or to put it less emotionally, a tax and credit squeeze. It is necessary because GDP growth is most unlikely to be robust enough to resolve budget deficit/debt problems and the alternative of default is too dangerous.
At some stage these policies of ever rising debt but low interest rates plus some inflation will fail. Yet Japan has managed two of the three for half a generation. This was achieved by drawing down on domestic savings, the Bank of Japan forcing banks and other institutions to buy bonds, or in practice issuing them to itself via government owned institutions and encouraging foreigners to borrow „cheap‟ yen. Yet Japan also discovered that, as in the song Hotel California, with low interest rates, “it is easy to enter, impossible to leave”.
The solutions are already in place
Japan has now joined the west, which in turn has adopted some of its policies – such as higher capital requirements for banks and insurance companies, to create a large pool of forced buyers of government debt irrespective of repayment risks or the coupon. Moreover, pension funds have been remarkably supportive bond buyers because trustees have convinced themselves that despite terrible value, they must accept actuarial assumptions without question, so continue a policy of liability driven investment. Any supply overhang is being mopped by three other groups. Private investors, made fearful by endless nightmare headlines, or for the fractionally better yields than on bank deposits; by central banks themselves which in developed countries simply print more money to buy their own bonds; whilst developing nations have come to the rescue as well, recycling their surpluses by bond purchases overseas. We do not pretend that this highly artificial structure is stable over the very long term, yet despite economic purists arguing it is a three card trick, the debt parabola can keep the show on the road for a very long time.
Budget deficits may prove far less structural than assumed. Consider the bungled solution for America‟s self-imposed crisis, the so-called fiscal cliff at the end of 2012. The result was a budget deficit „win‟, with an annual revenue increase equal to approximately 2% of GDP. The next imminent drama, raising the debt ceiling for the 108th time since 1917, will again be fudged. It too should result in further revenue increases and slowing government expenditure. Moreover, for all the visceral party politics, the reality is considerable bipartisan agreement over the data from the Congressional Budget Office; it is bad politics and economics that the top 1% of the population saw its share of total market income increase from 10% to more than 20% from 1979 to 2007, or that the top 10% own over two thirds of America‟s wealth. They will be taxed.
The melt-down of the banking system was sure to cause massive budget deficits because of higher expenditure (such as bank bail-outs) and lower tax receipts (such as from bankrupt banks). Since then, zero interest rates and heavy handed printing of money have already recapitalised the global banking system so this revenue hole is closing. Similarly, the ECB‟s trillion dollar bailout plan has been remarkably successful; hastily cobbled together in December 2011, it offered three-year money on demand, for free, to any financial institution. Most was drawn down immediately by the broke and the solvent alike (the latter grabbed the opportunity to pocket the interest differential). Last quarter over €150 billion was repaid 18 months early by banks wanting to show their new-found solidity, or to remove the stigma of weakness.
Structural deficits are also being resolved incrementally. Retirement ages are being pushed back. Benefit increases are being curbed and because of even current mild inflation, are of 8 falling in real terms. Hence graphic media pictures of frequent demonstrations against hardship. Rising government headcounts, even in departments once considered sacred such as health, welfare and defence are being slowed or even reduced. The main risk at this stage in the cycle is not central bank profligacy, but that governments impose too much austerity.
Section 2: Portfolio performance, structure and outlook
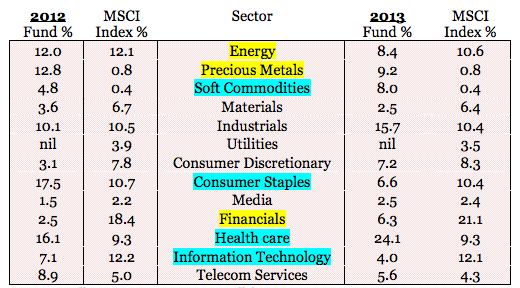
Source: Bedlam Asset Management. All figures as at 31 January 2013
What went wrong, given the portfolio lagged the index gain last year? The weightings hold the answer. Precious metal investments had a poor year because of the 19% peak to trough fall in the gold price. They could not buck the trend. Energy – mostly gas – ended lower. The underweight position in financials played both ways but overall, the low exposure acted as a performance drag.
What went right? The high exposure to soft commodities – various agriculture-related companies – played well because of very poor global harvests. Yet farm incomes were good as a result of insurance and high grain prices so farmers bought more fertiliser, seed dressings and equipment. Consumer staples also played well; the largest sector in the portfolio at the start of 2012, the positions were gradually reduced into rising prices and the weighting is now sub-index. The sector became increasingly popular and a „crowded trade‟ because of the visibility of earnings and cash flow. The universal re-rating has made fund managers believe they are spectacularly clever but the reality (hence the reduction) is that many of these businesses are pedestrian, fully priced low growth companies dependent on rising consumer expenditure.
The largest single sector is now health care. It also enjoyed a re-rating in 2012 but has better foundations. Stocks were cheap because of justifiable concerns over profitability, due to the unusual number of high margin products coming off patent in a concentrated period, yet results were better than expected. Moreover, these companies are often „bloated fat‟ but are finally dieting by selling off non-core divisions, outsourcing manufacturing, focusing on fewer therapies and so allocating capital better, thus improving shareholder returns. These factors, coupled with corporate takeover activity, low debt and steady to rising dividends, pushed their share prices higher. They remain good value.
The low weighting in the ever-popular IT sector was initially a drag but worked out well. Apart from the spectacular and well documented implosion of Apple‟s share price over the last two quarters (not held), the sector is looking as mature as steam trains. Innovation has given way to repackaging existing products, from cheaper lookalikes of (archaic) laptops through to mobile telephones, iPads and media communication. This is destroying margins at breakneck speed. Other signs of incipient maturity are supporting share prices through buybacks, looking to pay out cash surpluses (i.e. a lack of new investment opportunities) and an exponential growth in litigation to stifle competition.
Chart 3. Global portfolio; profit by area vs. the MSCI index by listing
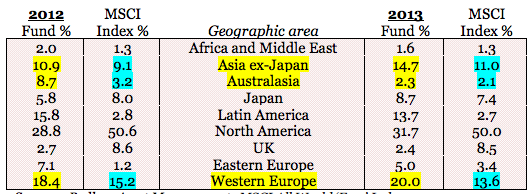
Sources: Bedlam Asset Management: MSCI All World ‘Free’ Index
The changes between 2012 and 2013 in the geographic sources of profits were significant. Any table showing exposure by listing tells the investor little about real portfolio risks and even less about the earnings‟ dynamics. By profit, the exposure to Asia ex-Japan rose by 35%, reflecting changes in holdings and the higher growth in profits from the region. The dramatic fall in the exposure to Australasia was timely, a function both of sales and a deliberate move away from the mature commodity cycle driven by exports to a slower growth Chinese economy. One surprising number, successful in terms of returns, was the high exposure to profits in Western Europe (and by listing higher still, at 31% of the portfolio). It became increasingly apparent that the garrotting of profits turned as the ECB ensured ample liquidity and zero interest rates. North America accounts for half the index but is 37% of the portfolio, a simple case of better valuations in several sectors available in other countries.
Chart 4. Global portfolio characteristics
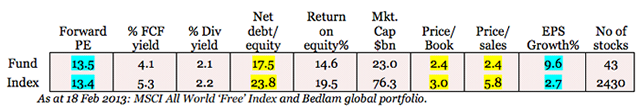
The most important feature is that for the same „value‟ as defined by the PE multiple, growth in earnings per share is three times greater than the index.
The free cash flow and dividend yields are similar to the index, but net debt substantially less, so logically the return on equity will also be less. The lower than average market capitalisation is a variable outcome and simply reflects where the best value lies. The current market cap. range is from $0.7bn to over $100 billion.
Apart from strong growth characteristics, on the data the portfolio is lower risk (debt), absolutely cheap on the value criteria of price-to-book and over twice better on price-tosales. Forecasts of future gains are at best an educated guess, yet it should perform especially well during inevitable sharp corrections and subsequent rebounds. In manic phases, it will notably lag.
Section 3: Dodging the bullets
i) Currency wars?
The headlines screamed so politicians reacted. Hence, in early February the G7 group of leading countries rushed out an announcement that every member wanted currency stability, fair trade and transparency. This is hokum. All G7 (& G20) countries practice realpolitik, one aspect of which is to achieve a competitive edge through devaluation or currency strength. This has been a permanent tool, ready for use when appropriate by all treasuries since time immemorial.
Chart 5. The Great Manipulator? America acts, others must react
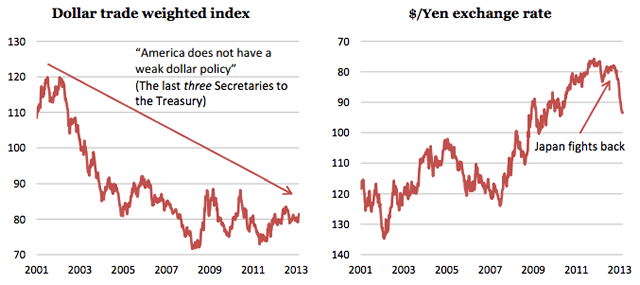
Currency manipulation does carry risks, although the many doom-laden comparisons with the 1930s are unhelpful; even if it contributed as a cause of the Great Depression the analogy still fails. (Our prize for this goes to the incredible damage inflicted on world trade by the protectionist Smoot-Hawley Act of 1930.) At that time, governments were operating within a chaotic triple currency system: fiat money, gold backed exchange rates and bi-lateral fixed rates. It is undeniable - the more so given Japan‟s recent conversion in attempting to collapse the yen exchange rate - that the pace of widespread attempts at manipulation via devaluation have accelerated. Yet this is not a reason to be alarmed, except in high growth countries with rising debt to GDP ratios, where current accounts are deteriorating having previously accumulated surpluses.
The victims of currency manipulation are almost exclusively confined to developing countries, where large capital inflows are undoubtedly having a perverse effect on their domestic economies - be it inflation in Brazil and Turkey, or property prices in Hong Kong and Singapore. Each government has reacted differently at the micro level but identically at the macro, by attempting to control prices. The outcome is a gradual but near universal loss of competitiveness. Thus it has not been surprising that the widespread consensus that the advanced countries would become hopelessly uncompetitive, or that the profitability of their leading domestic industries would disappear, have proven quite the reverse. Both of the last two years saw far superior index returns in these slow growth nations compared to those in the emerging ones, largely driven by better earnings.
ii) Emerging market debt - bubble trouble
Chart 6. Emerging market bond yields
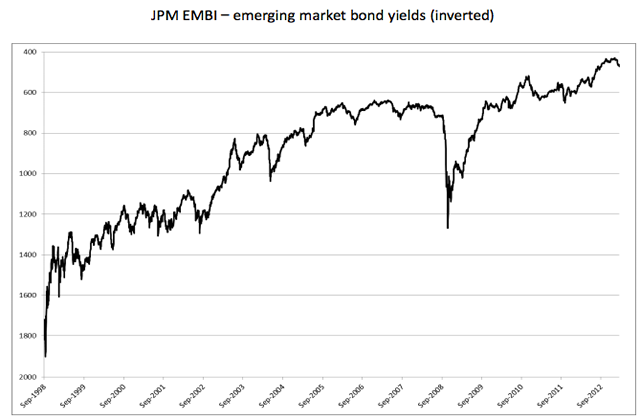
Source: JP Morgan
There is a hunt globally for better yields. This is unlikely to disappear given so many governments will maintain ultra low yields on their bonds (thus on bank deposits too), with low nominal rates, negative in real terms. The consequence is a rolling series of bubbles as investors move with increasing speed between asset classes to capture often fractionally better returns. Yield has temporarily lost its relationship to risk. This is most apparent in emerging market debt. With their high GDP growth, large foreign exchange reserves and balance of payments surpluses, there has been a boom in debt prices and issuance, with a huge surge of foreign buying of their slightly higher yielding bonds.
Yet as a group, GDP growth has been slowing because of the many problems and slow demand amongst developed countries. Growth in foreign exchange reserves in 2010/11 was running at +20% p.a. Not only has this ceased, the last six months saw a minor contraction. Their once low external debt–to-GDP ratios have started to deteriorate, so too have their balance of payments; in many cases current accounts have turned negative.
Historically an external debt-to-GDP ratio over 35% has led to significant increases in the risk of credit shocks in emerging markets; many now have ratios well above this danger level. Worryingly, the surge of debt issuance is often mismatched – borrowing in foreign currencies - and has mostly been bought by foreigners in open ended vehicles. When, inevitably, these of 8 inflows reverse, investors will find themselves in a redemption trap (unable to sell), and in a weakening currency. These various risks are already acute in South Africa, Poland, the Ukraine and Turkey. A far longer list is catching up rapidly.
Standing back from the minutiae, investors have failed to remember three permanent risks in these developing countries. Many have a history of repeated default; this is unlikely to change. Others have no intention of repaying foreigners when called to do so. The third risk is that as their balance of payments‟ surpluses deteriorate, so their present strong currencies will tumble; any marginal uplift in yield is entirely lost through exchange rates.
The clock is close to midnight in the emerging market debt craze. For equity investors this is creating a problem. Record low local interest rates and a surge in bond issuance (thus capital inflows) has created daft bond valuations which has done the same to some indices. Hence the Cyclically Adjusted PEs (CAPE) in many of these markets have raced to record levels, in the high 20s or low 30s. The result has always been index losses in equity markets over the next three to five years. This time it is no different. Moreover, despite the gargantuan appetite for debt in countries which most investors cannot place on a world map, the lack of growth in foreign exchange reserves is masking the fact that in many cases they have stalled. In others -such as China, Indonesia and Thailand - they have already reversed. The result is binary. Local investors are selling local assets and sending the proceeds offshore; foreign investors from the advanced nations believe the opportunities in emerging market debt have never been greater and are piling in. Both cannot be right.
Bedlam Asset Management plc
February 2013
Bedlam Asset Management plc is authorised and regulated by the Financial Services Authority (212757). The commentary and analysis in this document do not constitute investment advice, nor any other advice. The information contained in this research has been compiled with care. However Bedlam Asset Management plc makes no representation, express or implied, as to its completeness or accuracy. This research document is only sent to people who have an interest in receiving it, and is not for onward distribution. The contents of this document do not constitute investment advice nor is it intended that a recipient of this document will act on the information contained herein. Past performance is not a reliable indicator of future results.