This week we take a look at which States may be hit hardest by the imposition of the sequester. We then turn our attention to pensions and focus in on funded status, annual required contributions and just who may be left holding the bag (hint, it is who you think).
While we had hoped the folks in DC would have used their time since … how long has it been… to pass a budget and take a less dramatic approach than sequestration to addressing the deficit, March 1 is quickly approaching. The President did mention the need to take steps in his State of the Union and Marco Rubio (after his drink of water) delivered a reply that said all the right things. The muni audience heard promising rhetoric at Jack Lew’s confirmation hearing when he acknowledged the 28% muni cap was not a great idea. It would be nice to hear the Executive and Legislative branches similarly opine v. a cabinet nominee.
Perhaps, the President and Congress, knew exactly what they were doing 18 months ago. Knowing full well compromise was not palatable, they adopted the idea of sequester. Now, they can blame each other for things that go wrong and take credit with party hardliners for holding the line. Who knows, maybe once things kick in, they can adopt a budget, tweak some of the more aggressive aspects of the sequester and engage in real dialogue about tax and spending reform. Hope springs eternal.
Until then, you need to take a good, hard look at the impact of the coming “spending cuts” (remember, not exactly cuts but a slowing of the rate of growth). Given cuts in defense spending are a primary aspect of sequestration, and will arguably have the most immediate impact, we take a look at States most reliant on Defense Expenditures as a % of their GDP.
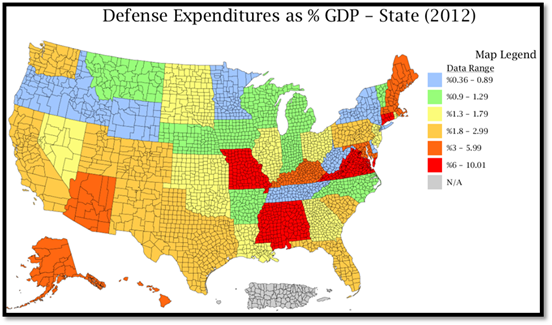
Source: DIVER Analytics; Map Module; Bureau of Economic Analysis
Put another way:
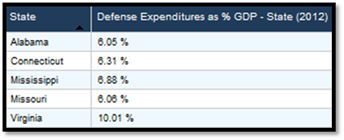
Source: DIVER Analytics; Filter Module; Bureau of Economic Analysis
While Connecticut and Virginia are the only two of the above five in the bottom half of our DIVER Muni Index, it may be worth following these five States closely over the next twelve months. The DIVER Muni Index is available across the DIVER solutions platform.
Now, to Pensions. Over the past year or so, these pages have featured commentaries on issues such as Funded Ratios, Pension Obligation Bonds and other related topics. It has led to our creation of a database of 15 data points for more than 900 State and city pension plans. Last week, Carl DeMaio penned a column for the February 7 Opinion page of the WSJ. Mr. DeMaio added some depth to points we’ve previously commented on:
- Outstanding State and local pension liabilities are “more than all the bonded debt officially listed on state and local balance sheets combined.”
- “[A]ll the federal tax hikes approved by Congress on January 1 would pay less than 20% of America’s state and local pension debt over the next ten years.”
DeMaio goes on to suggest ways in which the Feds can help solve the pension issue (never mind these are the same folks that can’t seem to pass a budget or take steps to solve our Nation’s fiscal issues). He starts by suggesting “Erisa-like” standards to avoid cooking the books (there are standards coming in to play in 2014) and suggests eliminating the tax-exemption for pension obligation bonds.
While I am not sure I agree with Mr. DeMaio’s approach, we have, in the past discussed the idea of productive v non-productive debt and the tax-exemption for the same. We have also been ardent supporters of standards for reporting financial information (for pensions and for all municipalities for their CAFRs and budget). The point, as Mr. DeMaio makes somewhat clear, there is this looming liability and real concern that the Nation’s taxpayers will be left holding the bag despite having no say in how these liabilities are reported and accounted for. If you thought banks were too big to fail…
In support of the idea of a level of standardization, a few weeks back, I happen upon an article that talked about companies with pension plans that were being forced to pump in cash due to low interest rates (Ford spent $5 billion, Verizon contributed $1.7 billion). Why? They are required to calculate their liability using a discount rate tied to corporate bond yields. Imagine if all municipalities were required to calculate liabilities on the same basis? If you are interested in doing your own field leveling, we track and make available Discount Rate information for more than 730 State and City pension plans.
Our data gathering helps provide some perspective on the points raised above. The below map shows the Funded Ratio of plans for 2011 (2012 data collection is underway but is hampered by the fact that much of it is yet to be reported).

Source: DIVER Analytics; Map Module; CAFRs.
DeMaio concluded his Opinion column discussing the importance of getting the pension issue under control so that State and local funds can be spent productively - think infrastructure, schools and other vital services. To his point, the amount of the Annual Required Contribution as a Percent of General Fund Expenses is as high as 67% (New Mexico) while the majority of the red States (below) are in the teens.

Source: DIVER Analytics; Map Module; CAFRs.
Just because the ARC is a certain percent, doesn’t mean it is paid (borrowing from the Fed, some States have been allowing the can to be kicked down the road). The below map highlights the Percent of the Annual Required Contribution Paid for 2011 – essentially, anything other than blue is less than 100% of the ARC being paid (in other words, getting worse, not better). Lets hope the can kicking syndrome perfected by the folks in DC doesn’t become a staple of the States budget solving tools.

Source: DIVER Analytics; Map Module; CAFRs.
This last table sums it up for you:
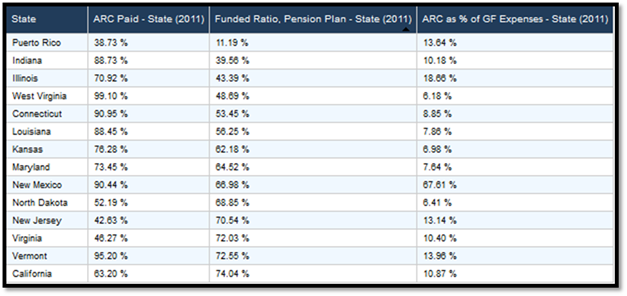
Source: DIVER Analytics; Filter Module; Bureau of Economic Analysis
In the past, we have applauded those State and local governments that have taken steps to get their pension and OPEB houses in order. However, like Mr. DeMaio, we worry about those pension liabilities that are too big to fail and will require a bailout like the banks did – perhaps the only difference will be that the banks paid back the bailouts!
As they say, more to come on both issues.
This Week’s Data (and two new ones) :
- NEW : Defense Expenditures as % of GDP, State, 2010, 2011, 2012
- NEW : General Fund Balance, State, 2012, 2011, 2010, 2009
- Foreclosures, County and State, January 2013
- Weekly Initial and Continued Jobless Claims, State, 2/2/2012
- Muni Index, Pt. in Time/Trend, County, February 2013
- Drought Intensity, County, 2/12/201
- Food Stamp Change and Rank, State, November 2012
On the Road : Gregg will be in New York City and St. Louis this week. Please look for our booth (and us) at the upcoming BDA, Bond Buyer, Florida Conference. Check our website for the list of conferences we will be attending.
Gregg L. Bienstock
CEO& Co-Founder, Lumesis, Inc.
© Lumesis
Contact Us:[email protected], or 203.276.6500 Vist our website: www.lumesis.com