We had a week of big numbers last week of which GDP, Personal Income, Durable Goods, the Conference Board's Consumer Confidence, payrolls and the FOMC were the ones that had our attention. We went to print a little earlier this week, so missed the NFPs. But this is what came at us. First GDP. There's a spin to be told but here are the raw numbers with the center column the one that caught markets wrong-footed.
GDP: Not much change when you look through a longer lens
| Component | Q3 2012 | Q4 2012 | 2012 |
| Consumption | 1.12% | 1.52% | 1.34% |
| Government | 0.75% | (1.33%) | (0.34%) |
| Investment | 0.12% | 1.19% | 1.02% |
| Inventories | 0.73% | (1.27%) | 0.16% |
| Exports | 0.27% | (0.81%) | 0.44% |
| Imports | 0.11% | 0.56% | (0.44%) |
| GDP | 3.1% | (0.1%) | 2.2% |
Source: Bureau of Economic Analysis
Most of the comments centered on five things: 1) it was a negative print and for the economy to slip into recession territory on the back of a flimsy recovery was, well, uneasy 2) but don't worry too much because consumption grew 2.2% from 1.6% 3) residential investment grew over 13% for the second quarter in a row 4) the volatile non-farm inventory series dropped $44bn to knock 1.3% off growth and, finally and especially, 5) defense spending dropped 22%. Here's what defense spending looks like as a proportion of GDP, dropping to below 5% for the first time since 2008 and the biggest plunge since 1972.
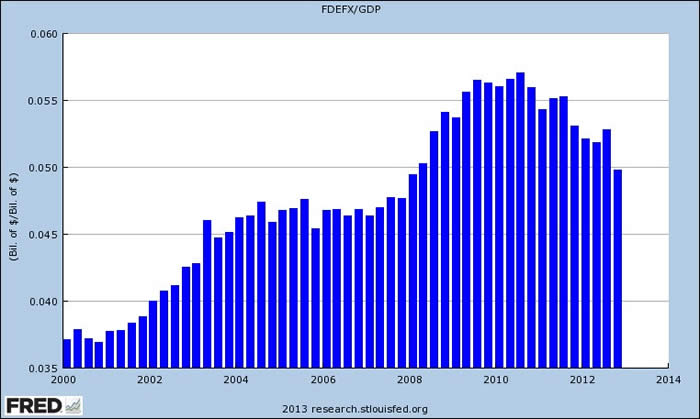
Source: Federal Reserve Bank of St. Louis, Economic Research
Some of the defense numbers were due to a simple reversal from the prior quarter. It's easy enough to bring forward expenditures and payments a month or two, especially with a looming cliff debate. The trend has been down for over two years and will stay that way. Another component that fits the "not as bad as it looks" scenario is that the trade numbers are an educated guess. Trade reports with a six week lag, so we won't see December's numbers for another week. It's also subject to big revisions.
And, of course the first report GDP numbers are subject to substantial revisions. In Q3 of 2012 we started with 2.0% and ended with 3.1%. In Q1 2011 we started with 1.8% and ended with 0.1% and, probably worst of all, in Q4 2008 we started with (3.8%) and ended with a startling (8.9%) which is the difference between a recession and depression.
A last point on these numbers is just how slow nominal GDP has been. Less than 0.5% in the fourth quarter compared to 5.9% in Q3 and 4.0% for the year, which was unchanged over 2011. As we've mentioned before, yes, real growth measures and adjusts for all the right things but companies and businesses need nominal growth for their top line. This is where the NGDP targeting argument comes in and opens a new can of worms of where you start and how to adjust for the lags in the transmission mechanism. But it's a real problem in the US right now that we have such moribund, nominal and real growth.
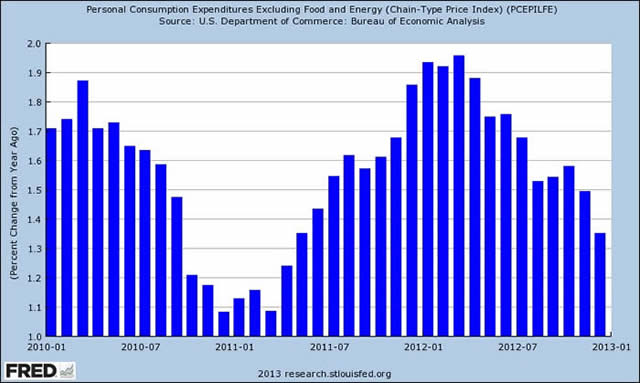
So with this report we must put some faith in the private sector and investment spending and that if we strip out the one-offs and volatility, then growth was around 2.5% which was in line with consensus. The bigger question is why GDP can't seem to shake off more than around 2% growth. We have pushed inflation down. Here's the latestPCEnumber from the Personal Income report.
Source: Federal Reserve Bank of St. Louis, Economic Research
It can't seem to break above 2% and is driving monetarist and fiscal hawks crazy as to why it's not twice as high (the quick answers are because of multipliers and private deleveraging but that's for another day). Looking into 2013, we're nervous about the effect of the payroll tax increase which will eat into disposable income growth.
On a related report, Personal Income, which comes out the day after GDP, showed robust 2.6% growth. Is this the "Hallelujah…here she comes" moment? Because this hasn't been much above 0.3% to 0.5% for years. Well, no. It was some crafty forward payment of dividends ahead of the January 1st tax rise. Of the $353bn increase in personal income, $268bn was the dividend increase. Here it is:
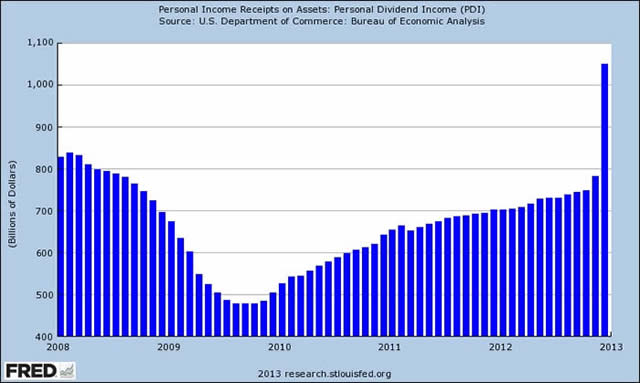
Source: Federal Reserve Bank of St. Louis, Economic Research
We thought that most of corporate America tried to look through the fiscal cliff debates, and indeed corporate fixed investment and durable goods orders did pretty well in the quarter. But bringing forward dividend payments was an obvious way to preempt tax rises and companies took full advantage. However, this isn't the type of income that gets spent quickly. Real spending rose only 0.2% and the savings rate nearly doubled from October levels. Looking forward, much of this increase will reverse as will this, the real disposable per capita income, which has hovered around $32,800 for years.
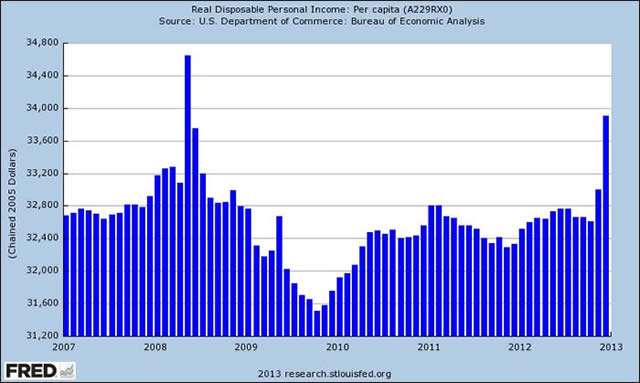
Source: Federal Reserve Bank of St. Louis, Economic Research
A final reason why we're tepid on the beginning of 2013 was the painful drop in consumer confidence from 66.7 to 58.6. This was taken around January 17th so late enough for the first of the payroll tax increases to take effect. Components of the index include business confidence, employment and family income and one area hit particularly hard was the gap between those who said jobs were hard to find less those who said they were plentiful, rose to 29 against 25. This is all consistent with a weak quarter and any uptick on consumer confidence may have to wait some months.
FOMC
The first meeting of 2013 and the language was tepid. Here's how the Fed described the economy in January, December and a year ago:
| One Year Ago | December 2012 | January 2013 | |
| Economy | Moderate | Moderate | Paused |
| Employment | Improved | Declined | Moderate |
| Households | Advanced | Advanced | Advanced |
| Investment | Less rapid | Slowed | Advanced |
| Housing | Depressed | Improved | Improved |
| Inflation | Moderate | Below target | Below target |
| Inflation Outlook | Stable | Stable | Stable |
| Inflation Estimate | <2% | <2% | <2% |
Score high for consistency and low for any real, substantive improvement. The good news is that the Fed kept in place theMBSand Treasury buying program and made no allusion to changing this unless there's a substantial improvement in the labor market. This Fed has a new roster of regional Fed presidents, generally taking a more dovish line. Still, there was one hawk from Kansas, Esther George, who seems set to play the perennial dissenter role vacated by Jeffrey Lacker of the Richmond Fed. Her reasoning was that monetary policy increases the risk of financial imbalances. This is in line with a speech she made recently where she talked about high yield bonds and land prices being at record levels and that those could cause a shift away from a "full employment level" and then stated for good measure that monetary policy could "aggravate" unemployment. Well, yes if we were anywhere near full employment. It seems to duck the Fed's dual mandate (luckily others take it more seriously) and to fear something vague happening way, way down the road. A bit like cancelling your 500 mile car trip because you're worried about wear on the tires.
Bonds
GTs peaked briefly at 2.03% but then rallied half a point. The market seems to be setting up for the NFP report which comes out after we print. But the weak data last week should keep QE alive and well for quite a bit longer. The bear market in bonds is not about to commence any time soon. The New Issue Market is light given earnings. An interesting crack in high yield occurred last week when two high profile names both saw keenly priced new issues widen out by around 25bp in two days of trading. So there's some latent nervousness and the broad high yield index fell around 1.5% in the week.
Equities
We're more than comfortable with the earnings season and valuations on the market. About half the S&P[1] companies have reported with the average earnings surprise being around +3.7%. But the price reaction is far more muted with Financials, for example, showing a 13% earnings rise but no price reaction. It's still an unloved sector with investors placing a big discount on earnings. Meanwhile, retail inflows are some of the highest since early 2000 and the big question is whether these are an indicator of anything. Our feeling is that they are more of a coincident indicator this time especially given it's only January. A lot of the flows may be 401(k) and other platform rebalance programs.
Bottom Line: Remain long on equities. We're at a five-year high and approaching an all time high seen in 2007. But back then, the market was priced at 17x earnings. This time it's closer to 14x. There will be some correction but we remain fine for now.
Sources: Bloomberg, Bureau of Economic Analysis, Bureau of Labor Statistics, Capital Economics, CRT Ader, Goldman Sachs, J.P. Morgan Market Intelligence, Federal Reserve Bank of Kansas, Federal Reserve Board, Federal Reserve Bank of St. Louis, US Census Bureau, US Dept of Commerce, High Frequency Economics, Pantheon MacroEconomic Advisors, TrendMacro, U2, Sentinel Asset Management, Inc.
[1] Standard & Poor's 500 Index is an unmanaged index of 500 widely held US equity securities chosen for market size, liquidity, and industry group representation. An investment cannot be made directly in an index.
© Sentinel Investments