Antecedent Analysis and Strategy Counsel
Fiscal Cliff : Making Decisions in Crisis Part II: How sharp is the “ax” in “tax” to U.S. Equity Valuations?
Antecedent counsel is provided as internal guidance to our portfolio managers and analysts. This counsel is not a forecast and has a longer time horizon than our commentaries. We use this guidance to inform our fundamental analysis, having measurable impact on our model inputs. Antecedent counsel should assist our clients in understanding our analysis and strategies.
Having set a framework using strategic decision theory to interpret the choices of US politicians in response to their incentives around the “fiscal cliff,” we now similarly turn our attention to the incentives (or disincentives) around the choices facing investors. While the general rise of uncertainty around changes to the rules of a game slow down the decision making process of investors, we consider the implications of a shifting tax burden on longer run equity valuations. Despite the steady policy debate regarding investment asset taxes, there is relatively little quantification of the magnitude of knock on effects to asset prices and a guiding assessment provides a handy tool to be applied more broadly across markets and situations beyond December 31, 2012 in the United States.
When we say that investors require commensurate compensation for taking risk our attention often quickly turns to what we consider to be the varying risks. In this analysis we keep risk constant, and instead consider the compensation. The compensation is the expected return or required discount rate of future cash flows after all real world frictions. These frictions include management fees, transaction costs and taxes. As these frictions increase, compensation or cash flows are decreased and in order to keep after-friction compensation unchanged there is a requisite adjustment to valuation. An increase in investment taxes will reduce the valuation of equities and lead to higher future expected returns before taxes so that after-tax compensation is unaltered. In addition, equities with higher dividend yields should also deliver higher before-tax risk-adjusted returns than the rest of the market when taxes on dividends are higher than those on capital gains. In order to estimate the relative size of the tax burden on equities and cross sections of the market, we must gauge the portion of holdings that are held outside of tax-exempt accounts and subject to tax as well as the portion of total return that is earned through dividends versus price appreciation. Then, we must account for thea verage marginal dividend and capital gains tax rates.
Portion of Dividends and Capital Gains Subject to Tax
The portion of equity holdings that are held within tax-exempt accounts has grown dramatically from levels below 10% prior to the 1950’s to current estimates above50%. Using the most recent IRS tax data from 2009, there were $163 billion in dividends reported on tax returns. This compares to the Bureau of Economic Analysis’s NationalIncome and Product Accounts where personal dividend income was around $500 billion. This ratio (163/500) has been fairly stable most recently and so we use an estimate of 30% for the portion of dividends paid that are subject to tax. We would expect this series to be relatively stable given the nature of dividend payouts which are fairly regular, consistent and positive. On the other hand, capital gains (losses) are much more varied and subject to timing so using a single year as an estimate is more difficult. We know that capital gains are likely held in a similar portion of taxable accounts as the dividends we just estimated. In addition, capital gains reset to zero when the cost basis adjusts under gifting arrangements or when held upon an investors’ death. We will use an assumption of 10% for theportion of capital gains realized that are subject to tax.
Portion of Total Return Earned Through Dividends and Price Appreciation
The portion of total return that is earned through dividends has varied meaningfully over time as well with the current environment showing a relatively lower portion of total return from the dividend contribution. This is a function of a declining payout ratio which has led many to conclude that the scope for increased dividends is high.
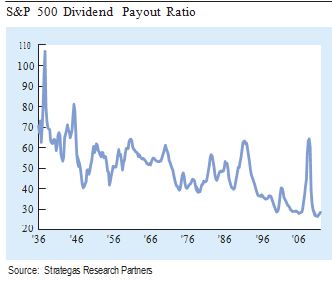
Using the current dividend yield for the S&P 500 of 2.0%and assuming a required return or discount rate of 7.0%,we estimate the portion of the total return that is sourced from dividends is 29%, much lower than the average of 50%since the 1930’s when payout ratios were much higher. This leaves the portion of the total return earned through price appreciation as 71%.
Tax Rates
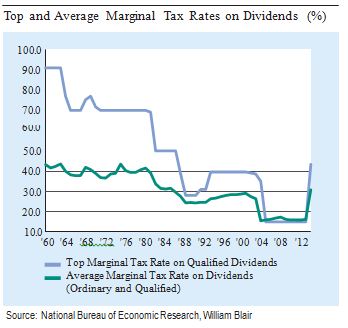
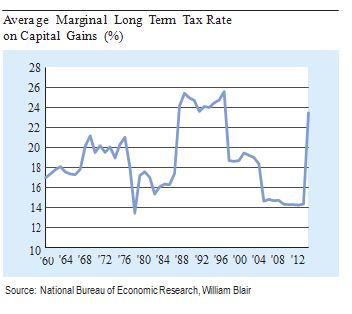
Finally, we estimate the average marginal dividend and capital gains tax rates across taxable holders using the most recent 2009 IRS data which show reported dividends across various levels of adjusted gross income as well as the breakdown between ordinary and qualified dividends. In2009, approximately 75% of dividends were qualified and this looks fairly consistent for the last few years. Qualified dividends are defined by the IRS as dividends that meet specific criteria to be taxed at the lower long-term capital gains tax rates rather than at higher tax rates for individual’s ordinary income and where there is the potential for the greatest increase from 15% to 43.4% at the top marginal income tax rates. We use the series from the National Bureau of Economic Research to show this history along with an estimate from the 2009 IRS data to estimate an increase in the average marginal dividend tax rates from11% to 35% in 2013. We also show the top marginal tax rate on dividends to estimate differences in impact for market participants affected at these levels relative to the average. Capital gains are also subject to different rates for different income levels as well as short term and long term gains based on holding periods. However, the differences here are fairly muted as the majority of gains are realized by top income earners and subject to the long term rate so we estimate an increase in the average marginal tax rate oncapital gains from 14.0% to 23.8% in 2013.
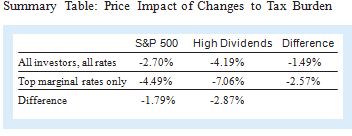
S&P 500 Impact (All investors, all rates): Using these estimates, reflecting a combination of a declining portion of investment gains subject to tax, a declining portion of investment gains attributable to dividends and the prospect for meaningfully increased investment asset tax rates, we estimate that the S&P 500 should fall by 270 basis points (bps) to equilibrate for slightly higher required before tax returns to keep after tax compensation unchanged.
Top Marginal Tax Rate Impact: We can also estimate the impact for investors subject to the top marginal investment asset tax rates using 43.4% for dividends and 23.8% for capital gains. We estimate that the portion of investment gains subject to taxation is also slightly higher and assume 40% for dividends and 15% for capital gains. Using these estimates, cash flows are reduced such that investors subject to the top rate will see their after tax compensation unchanged if equity markets fall by 419 bps.
High Dividend Impact: When we compare those stocks with higher dividend yields to the S&P 500 and considera dividend yield of 4.0% (as opposed to the current S&P 500 average of 2.0%) the portion of total return subjectto the dividend tax rates increases to 57%. For this cross section of high dividend yielding stocks, we would estimate a required fall of 449 bps for the average marginal tax rates and 706 bps for investors subject to the top marginal tax rates. This represents a relatively larger fall of 179 bps for the high dividend yielding stocks compared to the S&P 500 at average marginal tax rates and 287 bps at the top marginal tax rates.
Capital Gain Impact:
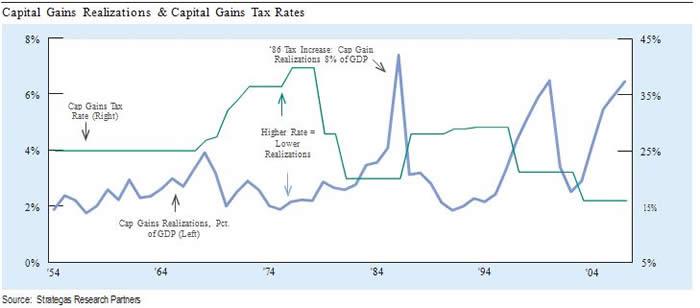
The isolated impact from varying levels of capital gains is more muted, but we would note that qualitatively the incentive is to realize gains over shorter horizons when capital gains rates are relatively low and ahead of increases in capital gains rates. Investors already considering a sale resulting in realized gains in the near future are incentivized to do it before year end. Whereas dividends are a more predictable series subject to adjustment at the corporate level, capital gains can be adjusted more quickly at the investor level and we would expect the increase in short and long term capital gains rates to lead to lower trading volumes and longer holding periods after the end of the year all else equal. This is known as the lock-in effect. Interestingly, astiming would have it, US equities have delivered double digit positive returns in 2012 and over the last few years increasing the likelihood that investors are currently sitting on unrealized gains. From a sector standpoint, we would also note the fairly steady out performance of telecoms and consumer discretionary over the last several years.
Other Approaches & Summary
In addition to our framework leading to an estimated 3% drop in aggregate US equity prices from the resetting of investment tax rates, we can also refer to more extensive empirical research by Clemens Sialm in “Tax Changes and Asset Pricing” in the 2009 American Economic Review. He estimated the impact due to the 2003 tax reforms under George W. Bush as providing a 6% increase to equity prices so an essential reversal of those reforms should provide some symmetry and lead to an estimated decrease of roughly 6%. Our prior research a decade ago also suggested about a 5% increase to prices and is confirmed by Sialm. Also, Victor Canto at La Jolla Economics has done some work this year which includes historical analysis of changes in “keep rates” from personal and corporate income taxes as well as taxes on investment income and estimates a decline in prices closer to 8% if the Bush tax rates expire. Our current estimated price impact of 3% is on the low end of these estimates.
Of course these potential changes will not occur in a vacuum and will be shrouded in short term market movements. However, we seek to provide some quantified context to guide our qualitative analysis of incentives. In terms of horizon, we would expect the adjustment process around these potential changes to happen in weeks or months and not multiple years as we find is often the case for our long term valuation signals. A misvaluation of close to 25% would suggest an average annual adjustment of 3%per year beyond the required discount rate over an eight year window. It is in that context that we acknowledge a potential price impact of 3% is meaningful if recognized over much shorter horizons. The understanding of expected tax impacts for cross sections of the market as well as single stocks within the aggregate equity market continue to suggest a greater opportunity for “tax alpha” at the vehicle level led by a seasoned team of investment advisors focused on individuals’ specific situations.
Important Disclosure
This material is provided for general informational purposes only and is not intended as investment advice. Any discussion of particular topics is not meant to be comprehensive and may be subject to change. Any investment or strategy mentioned herein may not be suitable for every investor. Information has been taken from sources we believe to be reliable, but its accuracy, completeness or interpretation cannot be guaranteed. Information and opinions expressed are those of the Dynamic Allocation Strategies Team and may not reflect the opinions of other investment teams within William Blair & Company, L.L.C.’s Investment Management division. Information is current as of the date appearing in this material only and subject to change without notice.
Alternative investments strategies, including strategies using options, futures, hedge funds and leverage, are speculative and typically involve a high degree of risk. These investments are intended for experienced and sophisticated investors who are willing to bear the loss of their entire investment and may not be suitable for all investors. Performance of these products maybe volatile, and while they may provide the potential for positive returns in both rising and declining markets, the potential for loss is equal. Some alternative investments can be highly illiquid, may not be required to provide periodic pricing or valuation to investors, and may involve complex tax structures and delays in distribution of important tax information. Certain alternatives are not subject to the same regulatory requirements, charge higher fees and may have limited opportunity for early redemption or transference of interests. Alternative investment strategies are not intended as a complete investment program. Each investor should consult their own advisors regarding the legal, tax, and financial suitability of alternative investments.
© William Blair


