This week we look to 2011 pension data for States and Cities and zero in on funded ratios, unfunded liabilities and some of the assumptions of the underlying plans. We also touch on recent housing data that gives us some hope and offer some thoughts following inauguration day. We conclude with a reminder to take a look at the MMA/Lumesis FAQ addressing Municipal Holdings and OCC/FDIC Compliance.
Pension Shortfalls, Funded Ratios and Assumptions
Last week, Pew released their study of 61 Cities’ retirement systems (populations over 500,000) and the gap they face. What struck us was that this was reported as news. Not so much because we all know the reality facing many public pension plans but because the “news” was based on 2009 data.
Lumesis has been tracking fifteen categories of pension-related data for 2011 and 2010 across the 50 States, DC and Puerto Rico (“States”) and for those Cities with populations greater than 100,000. We start with some critical data points comparing 2011 and 2010. Perhaps the 2012 figures will reflect some of the changes we have been hearing about and the double-digit earnings reported by some plans.
|
Category |
Funded Ratio |
Unfunded Accrued Actuarial Liability |
Discount Rate |
% of ARC Paid |
Plans |
|
State – 2011 |
72.73% |
$538,408,541,389 |
7.63% |
75.66% |
236 |
|
State – 2010 |
72.51% |
$528,660,375,524 |
7.74% |
73.78% |
233 |
|
City – 2011 |
80.10% |
$101,704,413,665 |
7.55% |
91.18% |
684 |
|
City – 2010 |
81.59% |
$ 90,367,684,076 |
7.56% |
91.74% |
698 |
Source: Lumesis, Inc., Pension Plan study; State and City CAFRs, January 2013.
So, between the State and City plans, there is (at least) a cool $640+ billion in Unfunded Pension Liabilities (this does not include OPEB) for fiscal year 2011. As we tend to remind readers, the trick is to understand which States and Cities are on the right and wrong end of that equation.
1In fairness to the folks at Pew, there are still a number of Cities with populations greater than 100,000 that have not fully reported their data – for 2010, 42 of the 273 cities have yet to report and for 2011 39 of 268 have not yet reported (the number of Cities changed due to population shifts). Moreover, some reported State and City plans use actuarial valuations that precede the CAFR date (in other words, a 2011 CAFR can use 2009 or 2010 actuarial valuations) – this speaks to a completely different issue!
To help in this regard, we offer a look at the best and worst Funded Ratios for 2011 for our City data.
|
Cities - Top |
Funded Ratio |
Cities – Bottom |
Funded Ratio |
|
Westminster, Colorado |
139.86 |
Portland, Oregon |
0.98 |
|
Bellevue, Washington |
132.10 |
High Point, North Carolina |
3.31 |
|
Fresno, California |
116.12 |
Indianapolis, Indiana |
7.19 |
|
Washington, District of Columbia |
111.00 |
Durham, North Carolina |
10.45 |
|
Everett, Washington |
108.82 |
Raleigh, North Carolina |
11.57 |
|
Tallahassee, Florida |
103.65 |
South Bend, Indiana |
13.03 |
|
New York, New York |
99.98 |
Fort Wayne, Indiana |
13.31 |
|
Inglewood, California |
97.64 |
Wilmington, North Carolina |
21.89 |
|
Clearwater, Florida |
97.26 |
Greensboro, North Carolina |
28.03 |
|
Garland, Texas |
94.71 |
Cary, North Carolina |
29.62 |
Source: Lumesis, Inc., Pension Plan study; State and City CAFRs, January 2013.
For more information on how to obtain the underlying detail associated with the pension plan data, please see the “Contact Us” section at the conclusion of this commentary.
Housing Delinquency & Foreclosure Data
In past commentaries, we have focused on Housing Prices and Foreclosures. This week, we take a look at Delinquency Rates, which offer a positive year on year trend, from Lender Processing Services. The Delinquency Rate – separate and distinct from the Foreclosure Rate – was down in all but three States for the period November 2011 to November 2012. Those States, Delaware, New York and New Jersey, may be due a little slack given the impact of Sandy.
This positive year on year trend is supported by a decline in the average percent delinquent to 6.84% for November 2012 compared to 7.7% for the month of November 2011. Reinforcing the notion that one needs to access and explore the underlying data, it is important to note that 26 and 27 States, respectively, had Delinquency Rates greater than the average.
Importantly, Delinquency Rates can be a preceding indication of the trend in Foreclosures which, as we know, can suffer lags to due to the unique legal process associated with processing foreclosures State by State. The Annual Foreclosure Rate for 2012 was greater than it was in 2011 for the 18 States identified below.
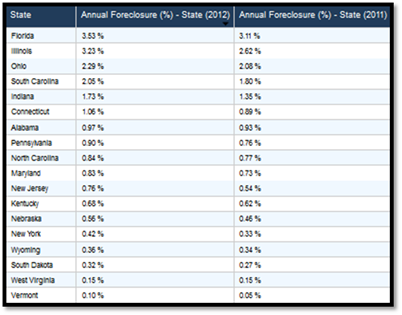
Source: DIVER Analytics, Filter Module; RealtyTrac.
Delinquency Rates and Foreclosures can both be key drivers to understanding what may be in store for property tax receipts and rates within the affected States and counties. Two additional critical data points we encourage our readers to follow as they evaluate their municipal holdings and opportunities – Assessed Values and Housing Prices.
The Presidential Inauguration – “Inauguration” means “to induct into office by a formal ceremony.” It also means “to cause to begin or a formal beginning.” It’s this latter definition that I hold on to. As President Obama begins his second term, perhaps he and the 113th Congress can look to a new beginning in our nation’s capital and move to get a few things done for the people without the specter of everything being done or not done for the sake of politics. Be it the debt ceiling, gun control, addressing our deficit or the many other significant issues that will come to bear on our great nation. It is time to do the work for the majority of people in our United States that sit pretty darn close to the center and not let the opposition between the far left and far right paralyze our great nation.
On a closing note, last week, Lumesis and Municipal Market Advisors issued a FAQ, “ Are Your Municipal Holdings Ready for the OCC & FDIC? ” Worth a look. http://www.lumesis.com/pdf/mma-lumesis-faq.pdf
How to Access the State and City Pension Data : Component aspects are incorporated into the DIVER suite of solutions and available to subscribers. The complete detailed State and City, plan by plan data is also available for purchase. For more information, please contact us at [email protected] or call us at 203.276.6500.
© Lumesis


