In the last few months we have seen the rise of Haka politics.
Familiar to any All Blacks fan, this is the ritualistic Maori war dance, full of noise, bluster and theater. But it rarely intimidates and most opponents sit it out with some amusement. So it is with the political interventions last year. We saw countless announcements and intentions from EU leaders and solemn pledges with little follow-through. And in the US we had a soporific election and a squalid squabble over the fiscal cliff that caught the public but not the market’s attention. We seem to be in an era where financial or monetary policy is all. And markets react only to that. The politics has become scarcely relevant. Entertaining. Loud. Intimidating. But markets keep moving. The dogs bark the caravan rides on.
Why? Well the US and European economies, together about 43% of world GDP, are driven by powerful and independent central banks that are managing the debt, demand and growth drivers as best they can. And doing a fine job. We will look back at the Bernanke and Draghi tenures as periods of deft navigation. These are no Arthur Burns or Montagu Normans. Each has a close read of the economy’s drivers. In the US, the Fed has introduced new monetary policy measures to backfill demand crushed by a balance sheet recession and atavistic fiscal policy. In Europe, the ECB [1] too has policies which are a picture of clarity compared to the Pollock-like logic in austerity we heard from EU leaders. As we’ve noted before: cometh the hour, cometh the man.
So 2013 looks better than 2012. Last year, we feared European growth would deteriorate and euro exits. And in the US, some feared debt and uncertainty would slow everything down into recession. Neither happened. What we learned from 2012 was that i) European determination to hold the eurozone together was tougher than expected ii) US monetary policy is prepared to change and keep employment on any path to improvement iii) the China economic machine is vulnerable and sounds increasingly like the Japanese threat stories from the 1980s iv) removing uncertainty, which the ECB and Fed clearly achieved, was not any panacea and v) recessions caused by financial incompetence that wipe out household savings take a very long time to recover from. Let’s look at some of these because they tell us what to expect in 2013.
Europe
The view of Europe from London and New York is distorted. Neither is used to contiguous borders (ok, the US has two but one barely counts) or a political construct formed as necessity. The UK has never understood the French-German alliance and has a long history of undermining it.
Adenauer, who with de Gaulle, started the EU partnership, called the UK’s policy “ein einziges Feilschen, ” one long haggle. Last year the UK distanced itself even more from Europe policy-making by excusing itself from bank reform. The US, unfortunately, sees Europe as an economic entity that should behave like a fiscal union and so keeps applying a financial logic to which Europe does not subscribe. In Germany, economics is a branch of moral philosophy. In the US it strives to be a science. Europe works despite having no Treasury or fiscal policy and is held together by a determination to maintain political union, first and only.
Also last year, we saw many calls for labor and market reform in the peripheral economies. Most of these were from Germany which made significant changes to unemployment benefits and labor markets in the early 2000s and saw no reason why other economies should not apply the same treatment. But something happened mid- year when the ECB president broke the log jam of rising bond yields and uncertainty about the commitment of the union. He stated the bank would do “whatever it takes” to save the euro. After that the call for reforms waned. Since then we saw:
1. Italian and Spanish bond yields fall sharply.
2. European equities rally; nearly every European stock market, but not the UK,
outperformed the US by 10% to 20%.
3. Bank borrowing from the ECB slow.
4. French bond yields stay around 2%, confounding yet again all investors who
run at the first sign of a socialist government.
5. A broad agreement on banking supervision.
6. Clear benefits to the most troubled economies with Ireland, Spain, Portugal and to a lesser extent Italy, showing improved current accounts, unit labor costs and export terms.
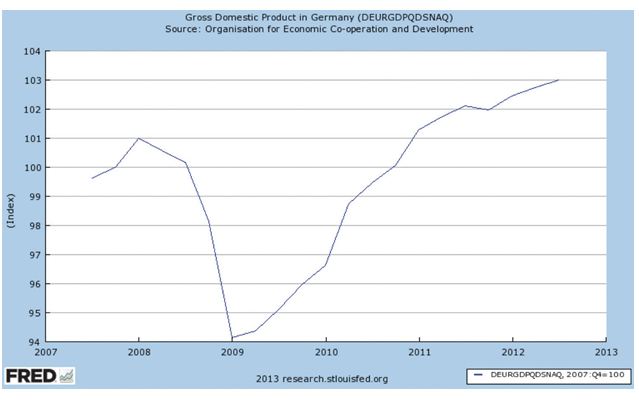
The list of what is still in crisis is long: mostly dead banks, miserable loan demand and credit growth and some dire economic prospects. Recently, unemployment has taken a turn for the worse and private consumption points to mild recession. Even Germany, whose GDP growth has been decent for a while, will struggle as 40% of its very export- driven economy relies on EMU[2] partners. Here’s German GDP which is one of the few European countries to even see output rise above 2008 levels. This slow pattern is one reason why we think Germany will not extend a new round of austerity in the run- up to the fall elections and instead use up some of its borrowing slack.
So Germany will be critical in this year as it has been before. Europe generally heads into 2013 in better shape not because of its immediate economic prospects but because of diminished political and financial chaos. There will be no exits and probably no deterioration of economic conditions. This is progress and markets react well to an end of bad news and start to discount the arrival of better times. Hence the rallies and, more important, the holding of gains we have seen in European capital markets. And it all comes down to sound money policies and less likelihood of external shocks both of which mean Europe may be a less newsworthy but more predictable economic and investment story this year.
US: The Biggest Change
In late 2012, the Fed reinforced its dual mandate charter by focusing on employment. This started first with pressure from several Fed board members for a change in communication policies. The Fed implemented forward guidance back in December 2008. Back then, it was about rates staying low for “some time.” Wind on to March 2009 and we got the first “extended period” language. Then in August 2011 we saw “exceptionally low… through 2013” and finally in January of 2012, we had “at least through late 2014” language. Note the trend. Each time the Fed was trying to shift expectations and establish the ground rules of stability. This was of course accompanied by the portfolio rebalancing policies of LSAPs[3] and MEPs[4]. But in all this, it was never clear when or how the Fed would change policy and the fear grew that as soon as the economy grew, inflation climbed or unemployment fell, for whatever reason, policy would change. Abruptly.
So the news from the last meeting was very welcome. The quick version is that i) low rates would continue until unemployment remains below 6.5% ii) that the new inflation target could have an upper bound of 2.5% iii) introduction of “well anchored” criteria for inflation, which means they won’t tighten if there’s a commodity- type uptick iv) a broader definition of “labor market conditions,” which means that while headline rates matter so, too, do things like participation and U-6[5] rates and v) a Treasury purchase program would replace the maturity extension program at year- end. We viewed these at the time as very bullish for the economy and equities and, although nominal purchase amounts were the same ($40bn of MBS[6] and $45bn of treasuries), the net result was further easing because it was a purchase and not a swap program.
So that set the stage for monetary policy. Fiscal policy took an expected bad turn in the New Year with the sinister-named American Taxpayer Relief Act, which actually, er…raised taxes for everyone. That’s right. No one in 2013 pays less than they paid in 2012. This is our best estimate of the fall out. It’s definitely better than what was at risk back in November but it’s still a net drag on the economy of around 1.0%.
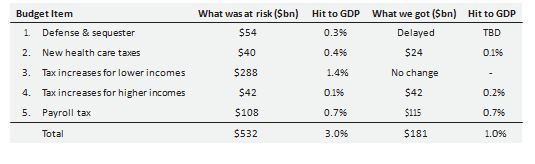
A few points starting first with the obvious danger that three big issues are postponed a few months into a Part 2. These are i) the sequestration on spending cuts, mostly defense ii) the debt ceiling and iii) continuing resolution to keep the government funded. So everything so far is prelude for another round of acrimony. Second, the restoration of the payroll tax from 4.2% to 6.2% is perhaps the most regressive tax hike imaginable. Everyone pays it, except for some municipalities that have Social Security opt outs, yet only up to $113,000. This clips around $115bn from wages and salaries of $6.8tr so around 1.7%. This will hit after-tax income hard, especially as compensation growth is barely 2.0% anyway. The net effect is a big fat zero for ordinary workers in 2013. Third, the drag on the economy is about the same as we’ve had for the last few years. Remember, despite headlines about out-of-control spending, the government component of GDP has slowed growth by about 0.8% for the last two years and the deficit had decreased 22% in dollar terms and from 10% to 7% as percent of GDP. The reason the deficit has improved so quickly is because of the rise in income tax receipts, which requires either new jobs or higher pay and is far and away the quickest way to reduce deficits. Personal current tax receipts are 26% above their 2009 lows and still very low by historic standards. Here they are as a percent of GDP over the last 10 years:
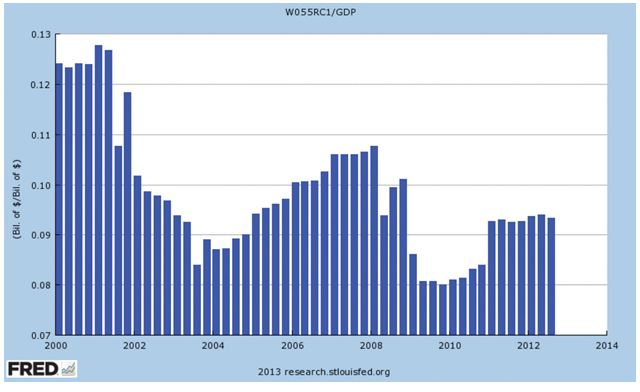
The reason the deficit has improved so quickly is because of the rise in income tax receipts, which requires either new jobs or higher pay and is far and away the quickest way to reduce deficits.
But why it’s going to be still slow
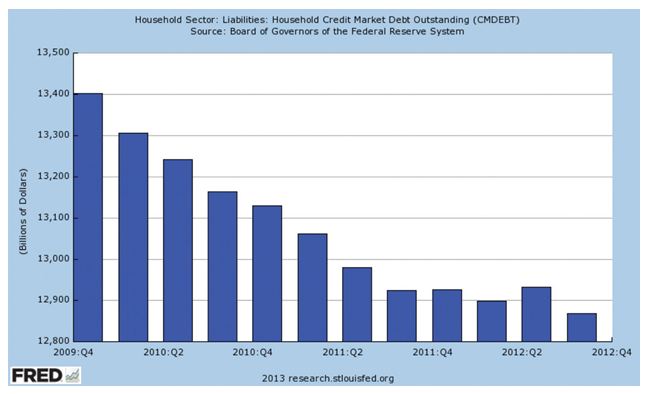
Amidst all the economic news, it is worth remembering how financial balances work. The household and corporate private sectors continue to run surpluses. Net private savings are now at $1,200bn, according to the Fed’s Flow of Funds report, almost double the 2008 level and net liabilities have fallen by $1,700bn. So saving more and cutting debt means that balance sheets are in slow repair. Here’s the run down in liabilities:
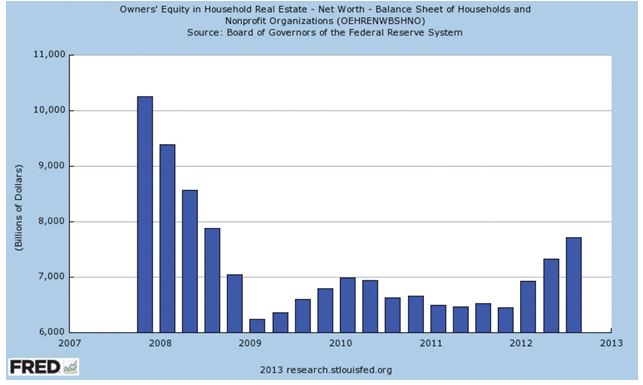
And with foreclosures, loan forgiveness and recent upticks in house prices, here’s the home equity feel-good factor for households.
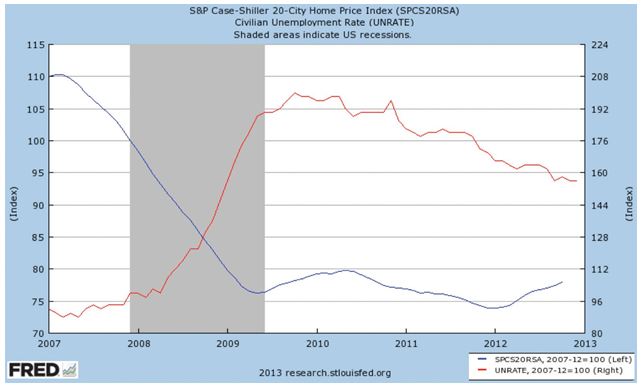
Recent improvements in house prices and unemployment should continue. Here are the most recent numbers and both are very real drivers of consumer confidence.
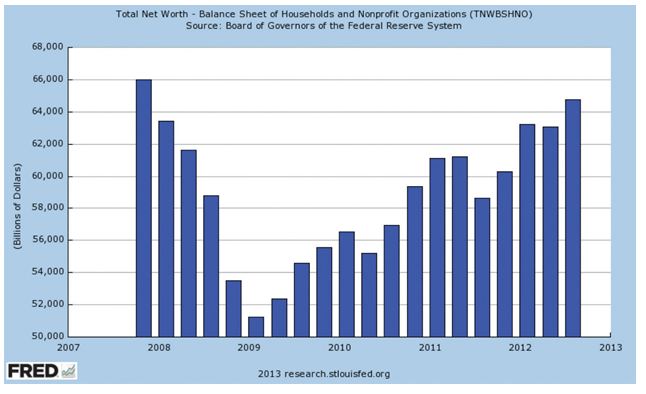
Now add in rising securities markets, lower liabilities and a big increase in time and savings deposits, for total net worth: back up to pre-crisis levels.
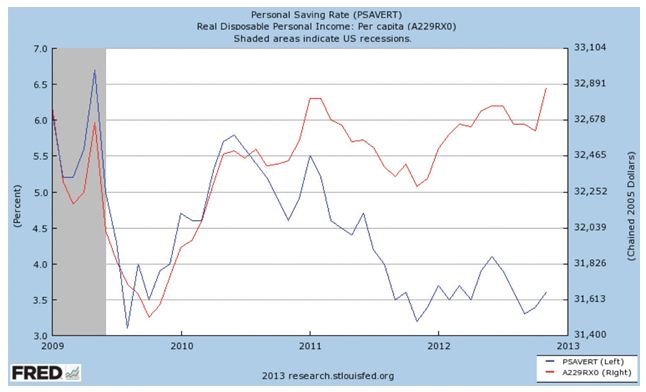
So this is all good except that the private sector is struggling with negligible growth in disposable income, still paying down debt and reluctant to return to dissaving on any scale. Here’s the latest on savings rates and real DPI[7] per capita, which continue to show no change with the likelihood of further deterioration in the first quarter.
That leaves only the public sector with a savings deficit and thus filling some of the demand gap. And as we know, that’s about to go into negative territory for this year by around 1.0% of GDP. That’s quite a change because for the last two years, it has been around 0.5% (which includes the big pull backs from state and local government). As all the sectors (so that’s public, households, corporate and foreign) in the economy must balance, and with three out of four in full savings mode, the outlook for stronger, higher, faster income growth is pretty flat.
Put all this together and we see the US struggling on. There’s no inflation risk and we say that with some confidence because i) we don’t believe that there’s any wage pull or any structural shortage of labor ii) fiscal spending is coming down and iii) if you subscribe to the money build-up at the Fed theses (we don’t), the Fed will keep all its securities through to maturity. We are never going to see them on the open market.
Why the payroll tax hurts.
The New York Fed recently surveyed what recipients of the 2011 payroll tax cuts intended to do with their money.
Spend More 39%
Save More 25%
Pay Down Debt 36%
And when asked what they would do if the payroll tax increased answered:
Spend Less 70%
Save Less 28%
Borrow More 2%
So respondents plan to reduce consumption at twice the rate they planned to increase it. We would expect that for a tax hitting lower paids and it’s one reason why low end retailers sold off hard.
Bonds
The story behind bonds is well worn by now. We see bonds trading at very low bands. For most of 2012, the GT10 was in the 1.5% to 1.9% range and by the end of the year only 7bps off where it started. The TIPS market is firmly in negative territory as shown here:
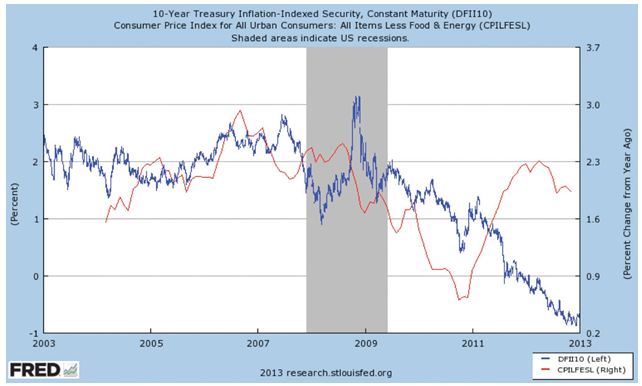
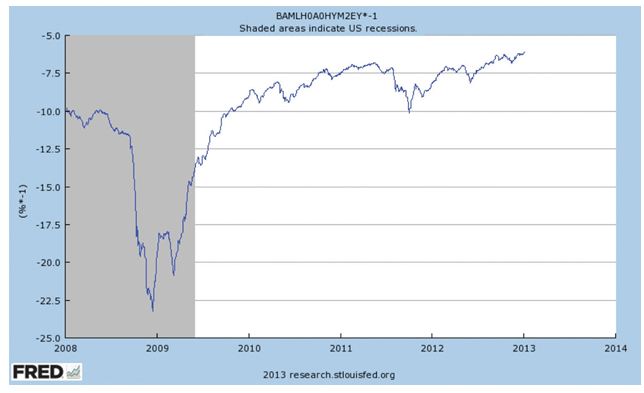
And for the conceivable future, they’re going to stay there as long as the wider measure of inflation stays below 2.5%. But the market is not without risk. Here are high yield rates over the last few years but on an inverted scale to show just how strong the increase has been. This is one reason why it makes no sense to talk about financial repression. Yes, yields are low by historic standards and savers in demand accounts or rolling CDs earn less. But the total return for savers—in treasuries, investment grade corporates and high yield—has been very strong indeed.
There’s no bond bubble. For a real bubble you need three conditions absent today: i) leverage ii) prospect of unlimited returns and iii) a widening base of buyers. The only one that remotely conforms here is that more institutions and retirees are buying bonds to meet liabilities, conform to capital requirements or de-risk their portfolios. And if it’s for the latter reason, they could be in for an unpleasant surprise. Fitch recently estimated that if rates rise to 2011 levels, a typical investment grade bond with a 10-year maturity would lose 15% of its value. A longer duration of 30-years would lose 26% in the same scenario.
That’s why we’re quite worried about the break-down of recent resistance levels in the treasury market. Support for the 10-year was around 1.55% to 1.89%. The When- Issued 10-year, which is the one setting the price range, rose to an intra-day high of 1.98% in the first week of the year, taking out the recent highs. This means a new range could be more like 1.85% to as much as 2.40% which would be a price swing of around 4 points. It pays to be defensive, nimble and trading in treasuries right now. Any move risks wiping out much of the coupon payments. As a point of comparison the Spanish 10-year printed a few weeks ago below 5% compared to nearly 7% before the August “whatever it takes” speech. The total return has been around 15% compared to a loss of 1.5% for US GT10s. Such is the speed of change in world bond markets theses days.
Equities
Despite the 13% return in equities in 2012, the market barely rerated. In other words it’s still trading around 2.2% and on a forward P/E of 13x. This puts the market on an earnings yield of 7.6% against corporate bond yields less inflation of 2.8%. This roughly compares real corporate yields against real earnings yields because corporate earnings, of course, track inflation. It’s historically a gap of around 0.5% compared to the 4.8% gap today and seems a very solid base. We expect a slow rotation by investors into equities, especially as quarterly bond fund statements begin to show lower rates or even negative total returns. The equity market rally since 2009 has been thinly spread with most investors net sellers of equities for four straight years.
The big story in equities remains dividend growth and, no, don’t give up on it. An average stock with an average 10% growth rate in dividends will end up with a running yield of 3.5% in five years. Even assuming no change in price, that’s a return that will not come through bonds. In last year’s search for yield (always a bad strategy), high dividend stocks performed well. But we currently see dividend growth stocks trading at their biggest discount to high dividend stocks in at least two decades.
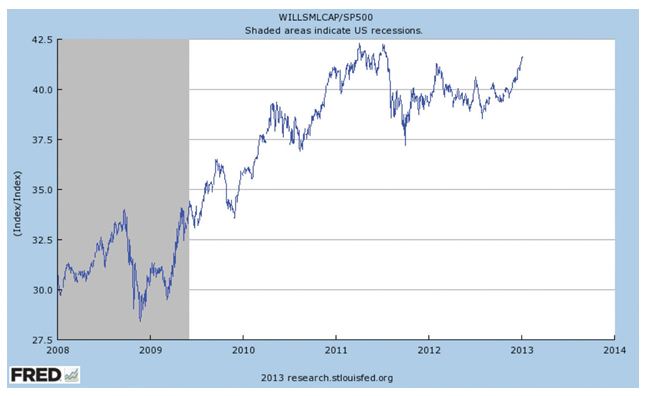
Finally here’s the S&P[8] against small cap stocks. If the line goes up, small caps outperform. When down, large caps outperform. Right now we see a lot more value in large caps: they have larger equity buffers, more access to credit and a much higher propensity to return capital in hard cash. We expect this line to be flat at best and more likely down: so a large cap outperformance.
So to put it all together here are the Top 10 from Sentinel for 2013
1. Stocks continue to pay off as the best asset class.
2. No withdrawal of easing by any major central bank.
3. Less headline risk from Europe…
4. and positive bank reform in Europe…
5. but Italy can still surprise and it’s the world’s third largest bond market.
6. Some recovery in China …
7. but Japan a bigger story.
8. Large cap equities outperform small caps.
9. Both outperform bonds.
10. Rossi claims his 10th world title.
How we did with our 2012 Top 10
Right
• US unemployment drops to low 8% mark.
• ECB manages new round of easing but…
• Greek default (there was technical default on some issues in December).
• China slows and no RMB revaluation.
• US bond yields remain below inflation.
• S&P dividend growth accelerates.
Mostly Right
• Lower US stock market volatility.
Wrong
• Euro weakens to €1.15.
• One or more EU states do not ratify compact.
Dead Wrong
• Casey Stoner wins MotoGP world championship
Sources: Bank of America Merrill Lynch, Federal Reserve Bank of New York, Fitch Ratings, Bloomberg, Capital Economics, The Economist Free Exchange, Federal Reserve Bank of St. Louis, Federal Reserve Board, High Frequency Economics, ISM Chicago, US Treasury Department, European Central Bank, Congressional Budget Office, Sentinel Asset Management, Inc.
[1] European Central Bank
[2] European Monetary Union
[3] Large scale asset purchases
[4] Maturity Extension Program
[5]Total unemployed, plus all persons marginally attached to the labor force, plus total employed part time for economic reasons, as a percent of the civilian labor force plus all
persons marginally attached to the labor force
[6] mortgage-backed securities
[7] Disposable Personal Income
[8] Standard & Poor’s 500 Index is an unmanaged index of 500 widely held US equity securities chosen for market size, liquidity, and industry group representation. An investment
cannot be made directly in an index.
Graphs sourced from the Federal Reserve Bank of St. Louis, Economic Research
NOT FDIC INSURED • MAY LOSE VALUE • NO BANK GUARANTEE
Consider a fund’s objectives, risks, charges and expenses carefully before investing. The prospectus contains this and other
information about the Fund and is available from your financial advisor or www.sentinelinvestments.com.
Please read the prospectus carefully before you invest.
Sentinel Investments is the unifying brand name for Sentinel Financial Services Company, Sentinel Asset Management, Inc.,
and Sentinel Administrative Services, Inc. Sentinel Funds are distributed by Sentinel Financial Services Company,
One National Life Drive, Montpelier, VT 05604, 800.282.FUND, www.sentinelinvestments.com.
This article contains the current opinions of the author but not necessarily those of Sentinel Investments.
The author’s opinions are subject to change without notice. This article is distributed for informational purposes only.
Forecasts, estimates, and certain information contained herein are based upon proprietary research and should not be
considered as investment advice or a recommendation of any particular security, strategy or investment product. Information
52329 SF1536(0113)
© Sentinel Investments