This week we provide some thoughts on the recent Cliff deal and plunge into some surprising data regarding jobless claims. We conclude with a look at the Philly Fed’s Leading Index and an offer for a free trial of Ambr.
For those of us focused on the municipal space, Washington’s “solving” of the Cliff brought interim relief. Fearing most of America would have nothing to discuss the next two months, the 112th Congress concluded with its version of Fiddler on the Roof. On the one hand, the Cliff was “solved” by enacting revenue measures that make permanent the Bush-tax cuts for most Americans but, on the other hand, Congress and the President kicked the can down the road on the spending side (Sequestration – recall that concept). So, it seems, what they were unable to solve in more than a year, the 113th Congress and President Obama will solve in two months. By the way, for those of us focused on muni-land, that means a few more months of uncertainty before we fully understand the impact on the municipal bond market.
Now, some may call me cynical, but there may be another motivation to keeping most of America focused on the Cliff and the Debt Ceiling (yes, that will be back in the media as well). I am referring to the employment situation in the United States. We keep hearing things are getting better, the rate is moving in the right direction and 155,000 thousand jobs were created this past month (mind you, that’s barely enough to absorb new entrants to the labor force as opposed to chipping away at the millions of unemployed and underemployed). In fact, the Federal Reserve has gone so far as to say they will hold the Federal Funds Rate where it is until unemployment dips below 6.5%. So, you ask, what is your point?
Recently, we took a look at Weekly Initial and Continuing Jobless Claims – these are actual numbers. No survey of employers or households. Hard numbers reported (not produced) by the United States Department of Labor. The distinction between this data and the unemployment rate, so widely reported on by the media, is critical. Weekly Initial and Continuing Jobless Claims “are collected as a by-product of UI programs. Workers who lose their jobs and are covered by these programs typically file claims (“initial claims”) … Claimants who qualify for benefits are counted in the insured unemployment figures (as “continued claims”).” The unemployment rate, a by-product of the total number of employed and unemployed, comes from a monthly survey called the Current Population Survey, of about 60,000 households (about 110,000 individuals). The “sample is selected so as to be representative of the entire population of the United States.” How the Government Measure Unemployment, BLS Website.
We looked at a sample period of October 6, 2012 to the most recent data reported for December 22, 2012. The numbers don’t appear to support all the positive news we’ve been hearing about the job market.
Let’s start with Weekly Initial Claims. We looked at the average number of Weekly Initial Jobless Claims between October 6 and December 22 and compared the same against the most recent Weekly Initial Claims. We found that nine States had fewer claims for December 22 period than the average for that State over the preceding twelve week period.
|
Alaska |
Georgia |
South Carolina |
|
Arizona |
New Jersey |
Texas |
|
California |
New York |
West Virginia |
Source: DIVER Analytics, Filter Module; DOL.
We used the average for the period to account for weekly anomalies that can drive the numbers markedly higher or lower on a week to week basis.
We then moved to Continuing Jobless Claims as reported by the DOL. The comparison of the most recent week data to the individual weekly numbers yielded the following.
|
Date of Filing |
States with Claims Less on 12/22/12 |
|
12/15/12 |
10 |
|
12/8/2012 |
13 |
|
12/1/2012 |
23 |
|
11/24/2012 |
3 |
|
11/17/2012 |
6 |
|
11/10/2012 |
9 |
|
11/3/2012 |
5 |
|
10/27/012 |
6 |
|
10/20/2012 |
6 |
|
10/13/2012 |
6 |
|
10/6/2012 |
8 |
Source: DIVER Analytics, Filter Module; DOL.
We were surprised by the fact that the number of States seeing a decline in Continuing Claims was generally in the single digits and only recently 10 or more (perhaps reflecting holiday season seasonal job growth).
Even more surprising was the aggregate data for the US over the period and the percent increase in many States over the referenced period. Get a load of this:
- Overall US Continuing Jobless Claims rose from 2,785,230 to 3,250,645 (a 17% increase)
- For the period, only 4 States saw a decline in Continuing Claims from October 6 to December 22 (again, we used the average for the period to account for weekly anomalies that can drive the numbers markedly higher or lower on a week to week basis)
- Arizona, Florida, Georgia, Hawaii
- On the other end of the spectrum – those above 20% for the average for the period to December 22:
- Michigan, Alaska, Iowa, Minnesota, Idaho, Montana, South Dakota, Maine, North Dakota, Wyoming, Utah and Vermont
Source: DIVER Analytics, Filter Module Extract; DOL.
As with all data and analysis, this is simply one aspect of the myriad of data available to better understand the dynamics of the employment situation in the US and its impact on the States and their tax receipts as well as spending. We encourage our readers to revisit this data weekly and to also consider the Unemployment Rate, the size of the Labor Force, number of people Employed and Income data. One may also consider Labor Underutilization as another barometer.
Not wanting to conclude on a down note, the Philly Fed released their Leading Index last week. It predicts the six month growth rate of each State’s Coincident Index and, in addition to the factors comprising the Coincident Index, also considers housing permits, unemployment insurance claims and interest rate spreads.
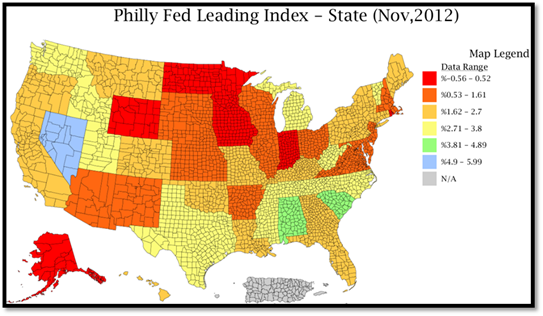
Source: DIVER Analytics, Map Module; Federal Reserve Bank of Philadelphia.
Given the breadth of the data aggregated for the Index, we think it, too, is worth watching monthly.
© Lumesis


