Advisor Perspectives welcomes guest contributions. The views presented here do not necessarily represent those of Advisor Perspectives.
Stock investors spend countless hours sifting through fundamental data, listening to earnings calls, charting prices, and tracking the economy. Yet one of the most revealing gauges of the financial conditions and liquidity that underpin the stock market sits in a market most equity investors don’t follow. Even if you don't own a bond, corporate credit spreads deserve a spot on your equity dashboard.
Think of credit spreads as a real-time vote by some of the world's most sophisticated investors on the health of corporate America, the economy, and financial market liquidity.
In this article, I explain what credit spreads are and why they matter to stock investors. I also examine what they are signaling today by reviewing key spreads across the credit curve, historical percentiles, and relative value metrics.
What Is a Credit Spread?
A credit spread is the difference between the yield on a corporate bond or index of corporate bonds and the yield on a Treasury of similar maturity. Because Treasuries are considered to be free of default risk, the spread represents the compensation investors are paid for the risk that a company does not pay them back, along with liquidity and other risks.
The most widely followed market spread data comes from ICE BofA indices. These are option-adjusted spreads (OAS), which strip out the value of embedded options on callable bonds so that bonds with different structures can be compared fairly. Spreads are quoted in basis points (bps), where 100 bps equal one percentage point.
To track the broader markets, investors generally differentiate bonds by credit rating and often distinguish between investment grade and high yield, or junk. Investment-grade bonds run from AAA down to BBB-. Anything rated BB+ or lower is high yield, or junk. As we move down the ratings ladder, default risk rises, and spreads widen.
Stock Versus Bond Analysis
Unlike stock investors, a bondholder's best-case scenario — assuming they plan on holding the bond to maturity — is a series of coupon payments and the return of principal. Thus, unlike a stockholder who focuses on potential upside and downside, most bond analysis focuses on downside risk. Accordingly, analysts ask whether a company can make good on coupons and ultimately return the principal.
Equity investors, by contrast, often focus on growth, multiples, and how well a management team can execute the plan. That difference in mindset, with bond investors much more heavily focused on downside risks, makes credit spreads a valuable cross-check on the stock market and individual stocks.
What Spreads Can Tell Us
Credit spreads have proven to be a great barometer of financial conditions and broad market liquidity.
A corporate bond yield, made up of the spread over Treasury yields, represents companies' cost of borrowing. Wider spreads are therefore financially restrictive. They raise the cost of capital, weighing on hiring, investment, buybacks, and debt refinancing. Accordingly, spreads tend to widen ahead of and during recessions as investors anticipate rising defaults. They tend to tighten when the economic outlook is improving.
Spreads are also reflective of financial market liquidity. Corporate bonds trade far less often than stocks or Treasuries, and dealers have limited balance sheet capacity to absorb selling. Accordingly, when broad financial market liquidity dries up, spreads can widen rapidly even on high-quality bonds as forced sellers meet few buyers. Widening driven by liquidity rather than fundamentals often signals broader funding stress in the financial system — the kind that tends to draw a Fed response.
Often, spreads move inversely with stock prices. When stocks rally, the economic outlook and earnings forecasts tend to be bullish, leaving corporate bond investors with less reason for concern. However, when spreads widen during what is otherwise a period of good economic growth and rising prices, the divergence deserves attention.
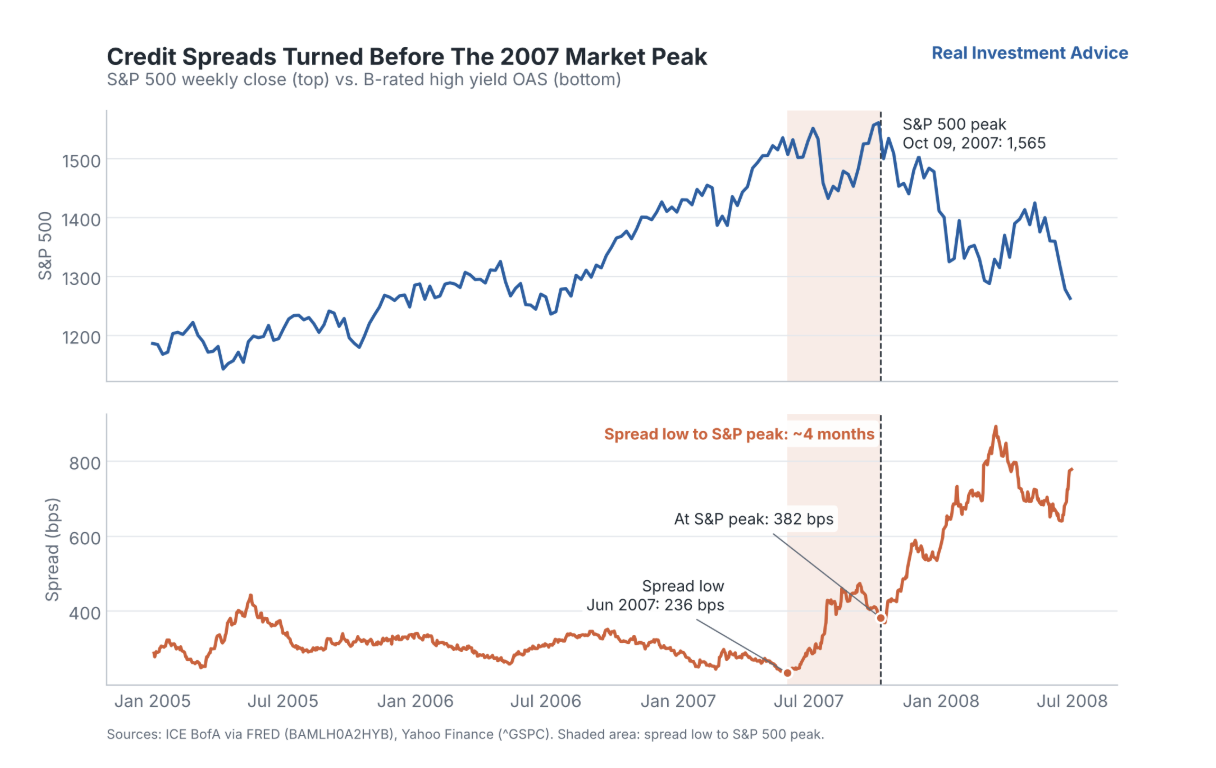
Junk bond spreads can be a good harbinger of broader market, financial, and economic risks. In 2007, bonds sent a warning four months before the stock market peaked. As shown below, credit spreads were tightening as stocks rose from 2005 to mid-2007. But starting in July 2007, credit spreads on junk-rated B debt started rising. The stock market didn’t peak until October, when B-rated spreads were already at two-year highs.
Is CCC the Canary in the Credit Mine?
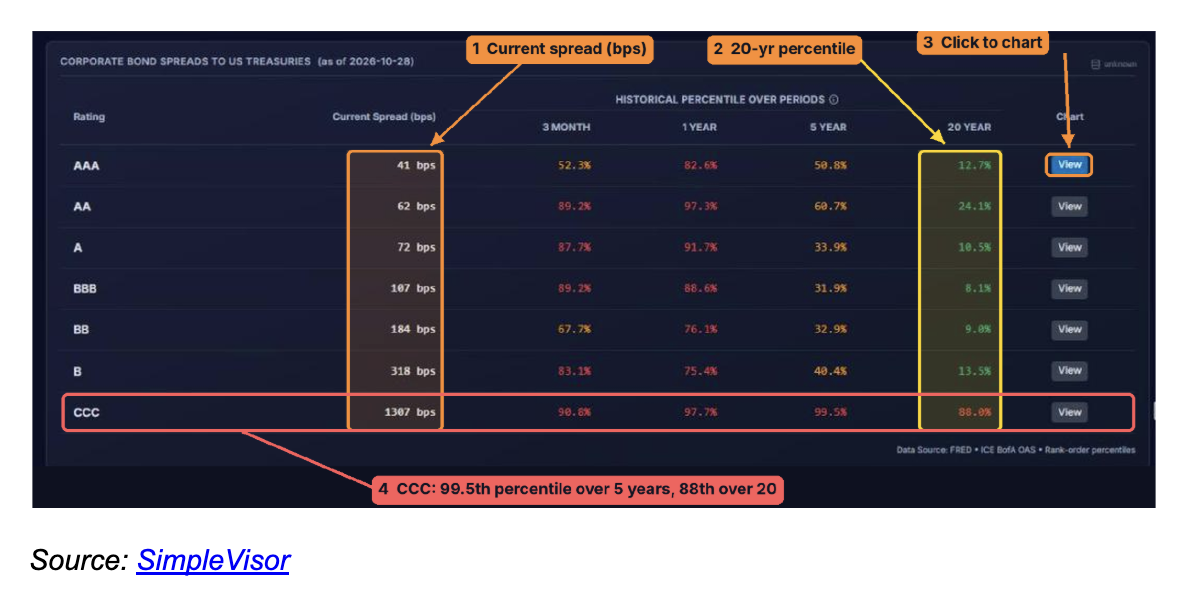
As of October 28, 2026, the ICE BofA BBB-rated investment-grade OAS was 107 bps, and the BB-rated high yield OAS was 184 bps. Both spreads had widened over the previous few months. However, while some commentators on social media have expressed alarm, both BBB and BB spreads remain tight by historical standards, sitting in the 8th and 9th percentiles of their 20-year ranges, respectively.
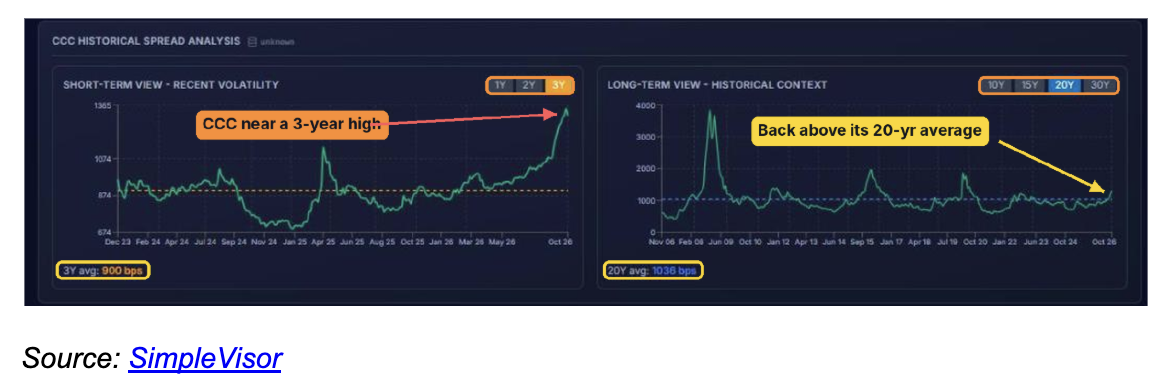
BB and B junk-rated spread indexes don’t tell the whole story about high yield debt. CCC-rated bonds, the riskiest tier of the market, have a spread of 1,307 bps. That is in the 99.5th percentile over the last five years, and the 88th percentile over 20 years. CCC spreads have risen by more than 500 bps since the start of September and touched 1,356 bps on October 23, their highest level in three years. In other words, the lowest-quality borrowers face mounting financing stress while conditions for the rest of the corporate bond market remain relatively easy.
To analyze the spread structure across tiers, I can evaluate three key questions: How wide are spreads? How do they compare to history? Where is the stress concentrated?
Current Spreads & Historical Context
The table below lists the current spread for each rating tier along with its historical percentile over three-month, one-year, five-year, and 20-year windows. A low percentile means spreads are tight and investors are earning little extra yield for taking credit risk. A high percentile means spreads are wide and the market is demanding more compensation. Red shading indicates spreads are wide relative to history, and green signals that spreads are tight. Today, every tier from AAA through B sits between the 8th and 24th percentiles of its 20-year range. CCC, at the 88th percentile, is the clear outlier.
However, while spreads are tight historically, note the contrast between the orange and yellow windows. All rating tiers are above the 75th percentile over the last year. The takeaway: Spreads have widened recently, but from very low levels.
Graphing Historical Spreads
Looking deeper into historical spread data for individual ratings, CCC spreads show an outsized move. The short-term view shows a steep climb since the summer, well above the three-year average of 900 bps. While that graph raises concerns, the long-term view shows today's level is above the 20-year average of 1,036 bps, but still far below 2008 crisis levels and moderately below the 2016 and 2020 peaks.
Intra-Credit Spreads
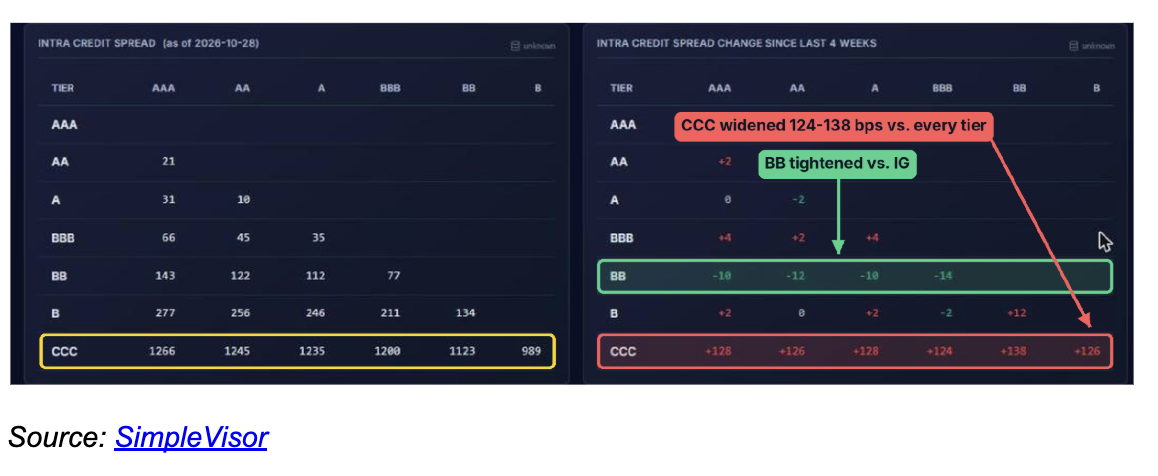
Examining the spread differentials between each rating pair and their four-week changes shows whether investors are differentiating between strong and weak borrowers.
For example, over the last four weeks, the gap between CCC and every other tier widened by 124 to 138 bps. Meanwhile, the gap between BB and investment-grade tiers narrowed by 10 to 14 bps, and gaps within investment grade (AAA–BBB) barely moved. The stress seen in CCC-rated debt is not spreading up the ratings ladder.
Comparing ETF Implied Credit Spreads
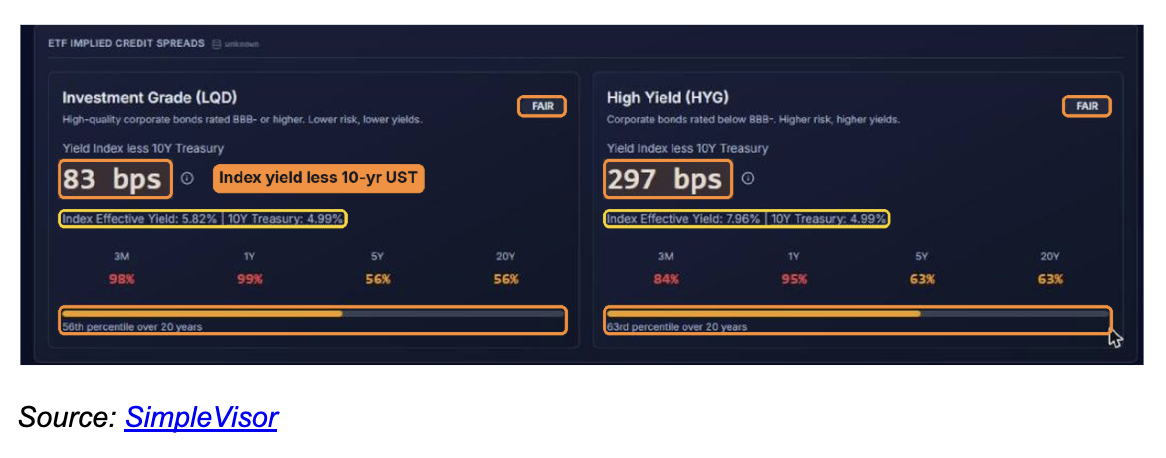
A complementary approach is evaluating implied investment-grade and high yield spreads derived from the two most popular corporate bond ETFs: LQD (investment grade) and HYG (high yield).
Each spread is the ETF's effective yield less the 10-year Treasury yield. The investment-grade index yields 83 bps over the 10-year Treasury, and the high yield index yields 297 bps over. Both are rated FAIR, meaning between the 20th and 80th percentiles of their 20-year history, but are near the top of their three-month and one-year ranges.
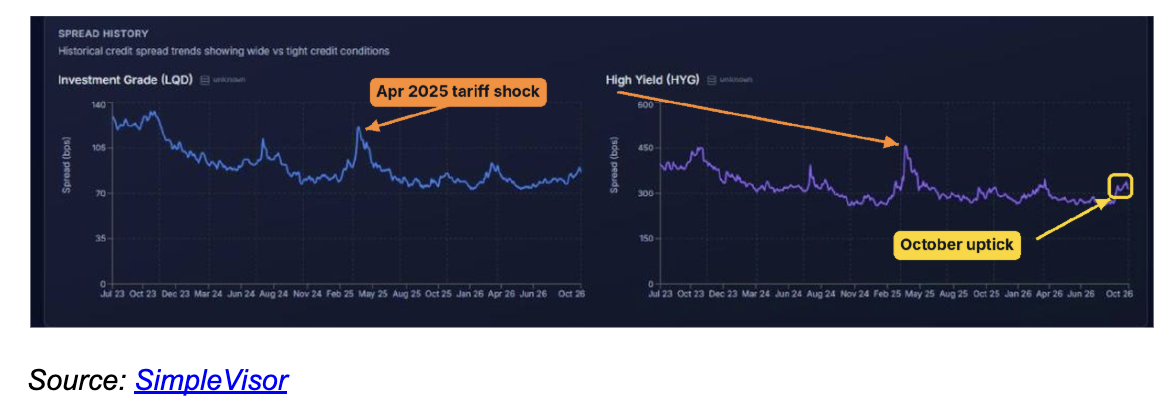
Below are the current ETF implied spreads plotted over the last three years. The April 2025 tariff shock stands out. The current increases are noticeable but, like the charts on the AAA through BB indexes, are not alarming.
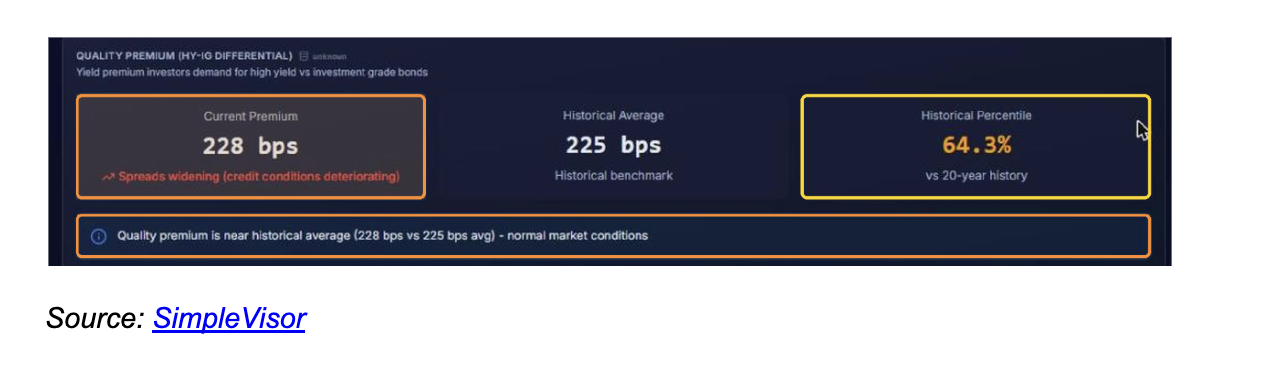
Finally, the quality premium differential measures the difference between high yield and investment-grade spreads. At 228 bps, it is close to its 225 bps historical average and in the 64th percentile of its 20-year history. A rising premium signals investors are becoming more selective, and credit conditions may be deteriorating.
What Is the Message?
Taken together, the credit market is sending a nuanced message. On the surface, spreads are historically tight. Investment-grade companies are borrowing at spreads that are near the bottom of their 20-year ranges, and the high yield index is near the middle of its long-term range. That suggests little fear of a broad-based recession or a meaningful tightening of financial conditions.
Beneath the surface, CCC spreads are flashing a warning. Their sharp widening tells us investors are making a sharp distinction between companies that can handle rising yields and those that cannot. The weakest borrowers tend to feel higher rates first because they rely most on refinancing.
Encouragingly, the stress has not migrated to BB- and B-rated bonds. If CCC stress begins to move up the ratings ladder into B, BB, and eventually investment-grade BBB credits, it would be a far more meaningful signal for the economy and the stock market.
I would also caution that tight spreads cut both ways. They may reflect confidence, but they can also mean investors are complacent and willing to be paid relatively little to bear credit risk. As I have written before about valuations in other asset classes, low compensation for risk does not cause a sell-off, but it does leave little cushion if the outlook changes.
Summary
Credit spreads deserve a place on every investor's dashboard, whether or not you own corporate bonds. Today, they signal calm and bullish financial conditions, but with growing stress among the lowest-rated borrowers. If the widening we see in CCC bonds starts to show up in B, BB, and BBB spreads, it may be time to consider hedging or reducing your equity exposure.
Read more by Michael Lebowitz:
- The Fed Risks a Policy Error Fighting Oil Prices
- Are Bonds Pricing In a Fed Policy Mistake?
- Think Rates Are Peaking? Consider Mortgage-Backed Securities
Michael Lebowitz is a portfolio manager with RIA Advisors and author for Real Investment Advice. For more information, contact him at [email protected] or 301.466.1204.
Join RIA Advisors and elevate your career within a deeply experienced team focused on innovation. Our collaborative environment is built on a foundation of advanced technology and effective investment models, designed to enhance your ability to serve clients and grow your practice. Benefit from a supportive culture that encourages professional development and fosters a forward-thinking approach. By joining our team, you’ll be part of a group dedicated to excellence and continuous improvement, empowering you to focus on building meaningful client relationships and pursuing your business ambitions. Discover the advantages of working with our accomplished advisory team by starting your conversation today.
A message from Advisor Perspectives and VettaFi: Discover something new! Click here to register for our upcoming webcasts.
More ETF Topics >
 Advisor Perspectives welcomes guest contributions. The views presented here do not necessarily represent those of Advisor Perspectives.