Market Valuation: Expensive CAPE Or Cheap PEG?
Membership required
Membership is now required to use this feature. To learn more:
View Membership Benefits Advisor Perspectives welcomes guest contributions. The views presented here do not necessarily represent those of Advisor Perspectives.
The S&P 500's Shiller CAPE ratio just hit 41. Since 1881, the market valuation has been more expensive under CAPE only once. That was during the final months of the dot-com bubble. At the same time the CAPE is ringing alarm bells, the PEG ratio, which measures price relative to expected earnings growth, is at its lowest level in at least three decades, possibly its cheapest reading ever.
One market valuation says “run for cover,” while another says “bargain.” Both market valuation tools use data from the same 500 companies in the S&P index but interpret the market completely differently.
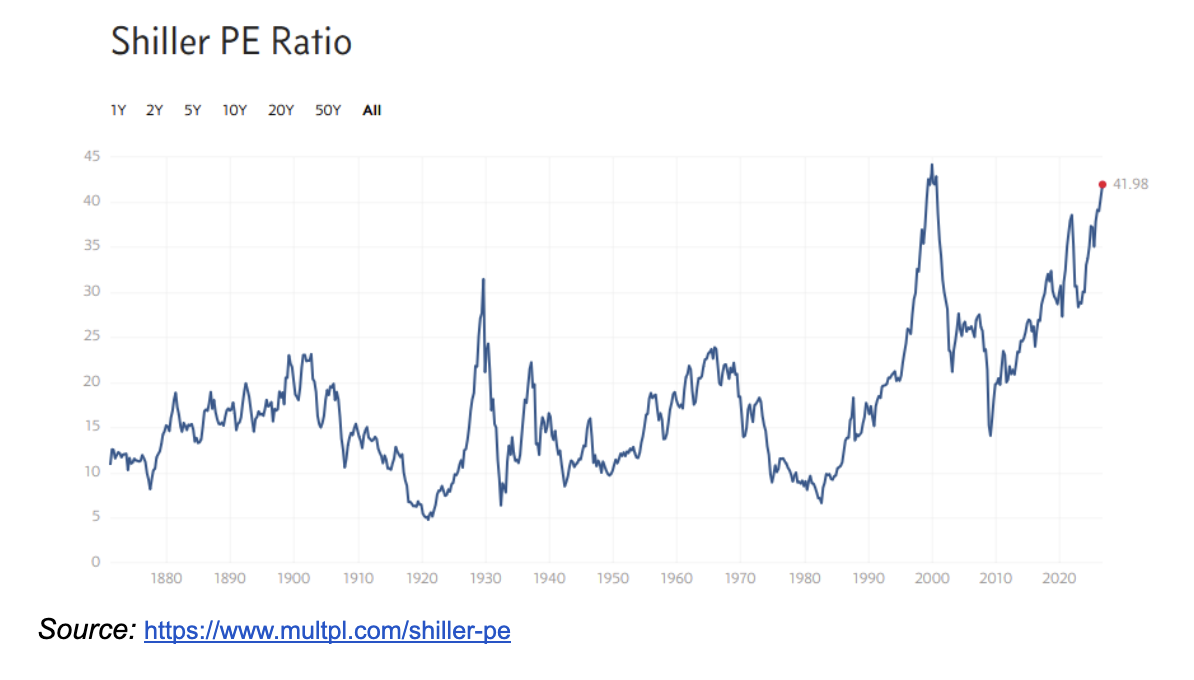
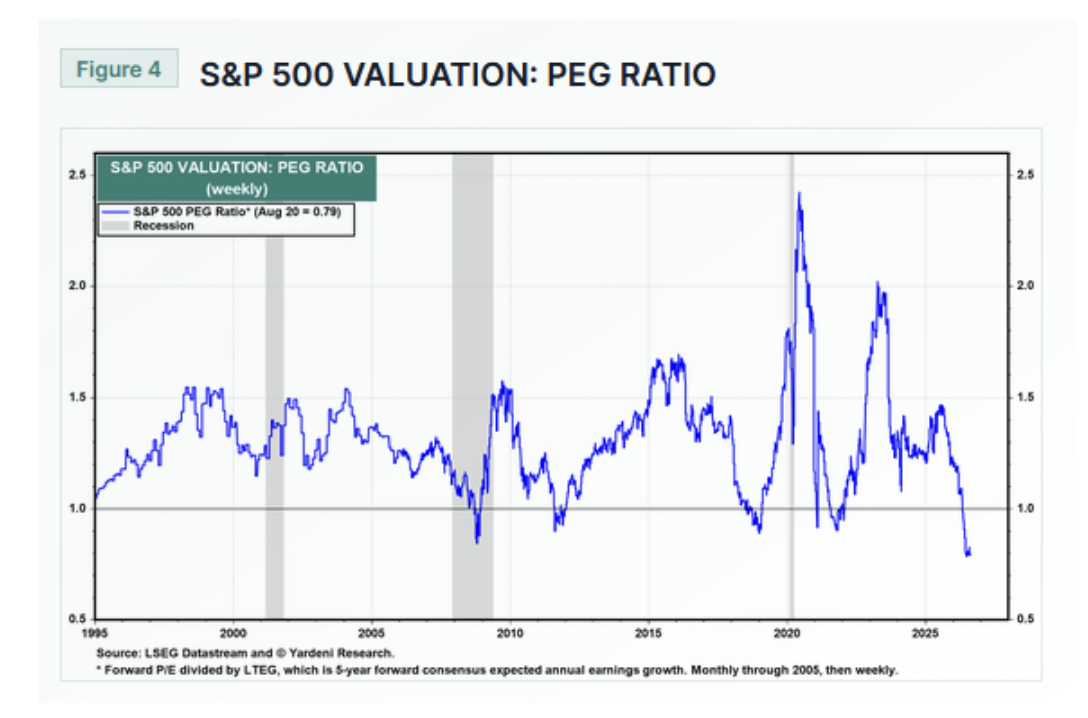
Confusing, yes, but the disagreement between the two charts comes down to one question: Is the past a better predictor of the future than the wisdom of Wall Street?
To answer this question, I'll first summarize what each ratio measures, then dig into expected growth versus historical growth, the culprit behind the big difference in the two graphs.
CAPE Isn’t Perfect
The P/E ratio is one of the most quoted market valuation gauges for stocks and stock indexes. While valuable, it rests on one bold and often wrong assumption: Future earnings will match past earnings. In other words, it doesn’t capture how earnings may change.
For the CAPE valuation, the assumption is similar, but instead of using the most recent one year of earnings to assess value, it uses 10 years of earnings. This better smooths earnings, reducing the impact of short periods of economic volatility. But it has the same vulnerability, assuming the future will be just like the past.
P/E tends to be most useful for comparing companies with similar earnings growth. However, it is less useful when analyzing high-growth companies or those with the potential to change their growth trajectory.
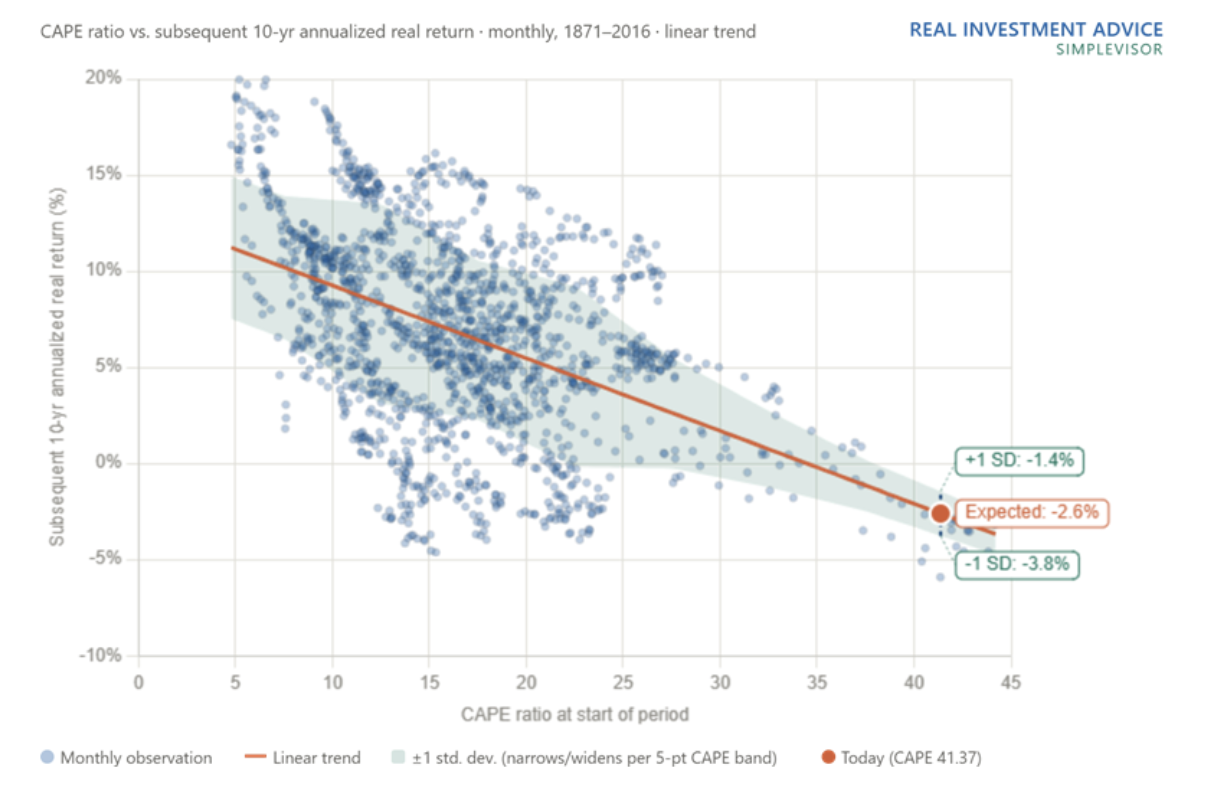
Despite its flaws, the CAPE valuation strongly correlates with future market returns, as shown in the graph below that compares CAPE valuations and forward 10-year S&P 500 returns. While the CAPE provides a good indicator of expected returns over the full next 10 years, it doesn’t provide a roadmap for the monthly and annual returns that make up the period.
The PEG Ratio
The PEG ratio builds on the P/E ratio framework but uses future earnings growth estimates instead of prior realized earnings. Because it uses estimates, it can change rapidly.
The PEG ratio calculation is the forward P/E divided by the expected three-to-five-year earnings growth.
To better appreciate today’s PEG ratio, I break down the numerator, forward P/E, and the denominator, G (three-to-five-year growth estimates).
Forward P/E
The numerator in the PEG ratio is the forward P/E. Instead of using the trailing 12 months of earnings as in the traditional P/E ratio, the forward P/E uses earnings estimates for the coming 12 months. Thus, its value depends heavily on how well Wall Street can predict earnings for the coming 12 months.
I can analyze the effectiveness of one-year earnings forecasts in a couple of different ways.
First, I can compare the trailing 12-month P/E to the forward P/E and imply expected earnings for the next year. I can then compare the implied earnings with actual earnings. Using this method, the top two charts below show that Wall Street almost always overestimates earnings — by a wide margin, at times.
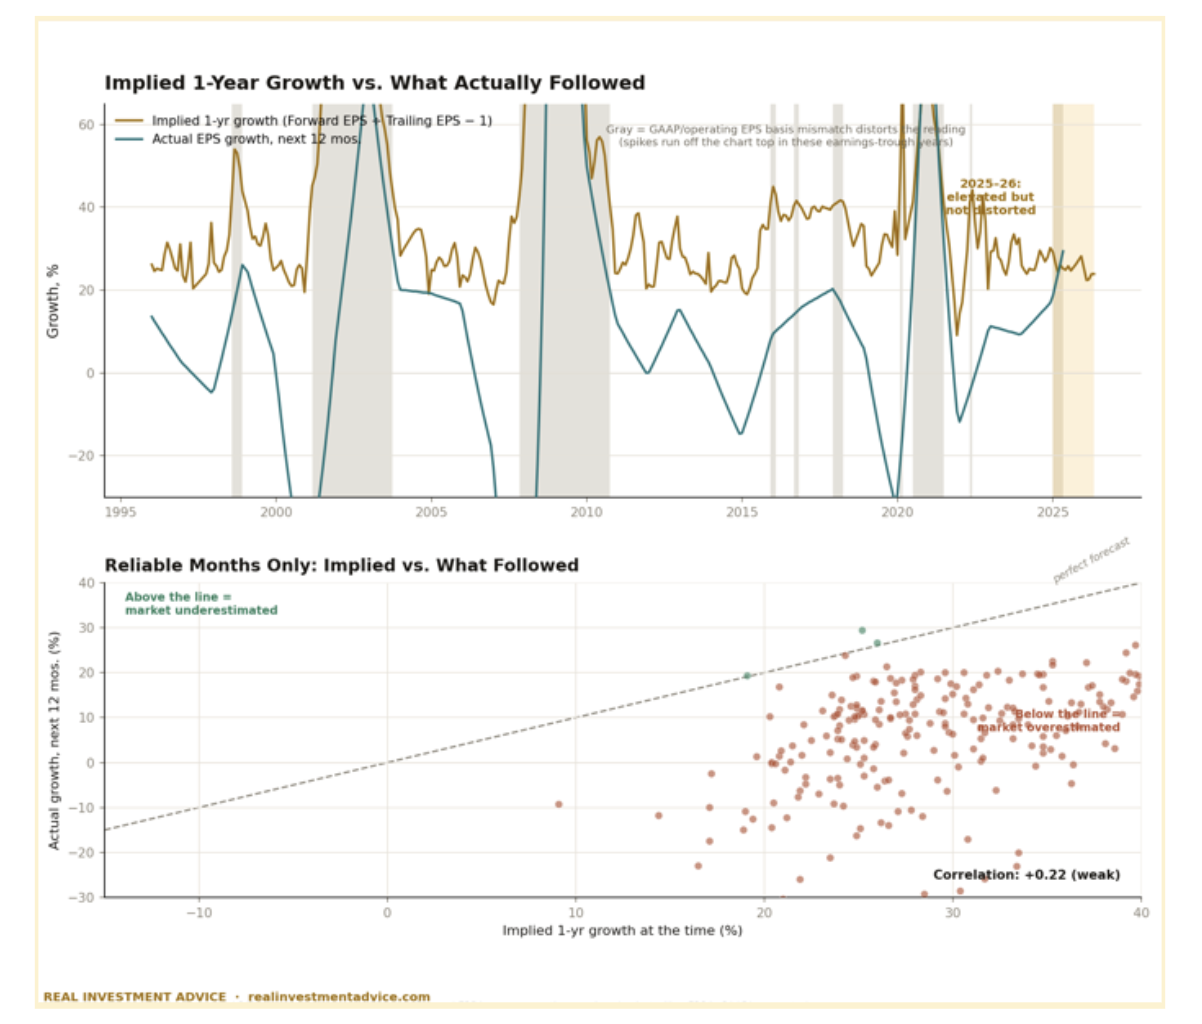
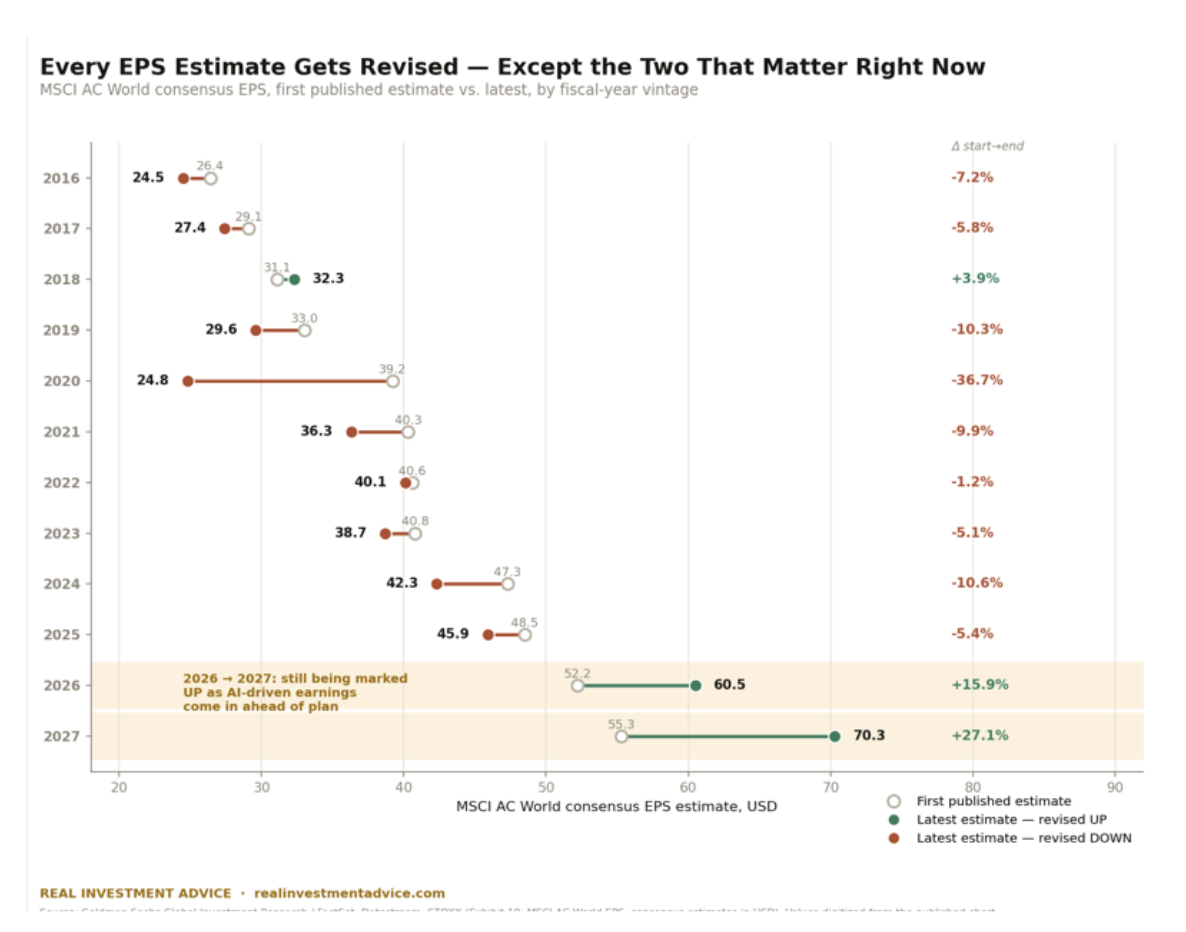
The second way to grade Wall Street's forecasting ability is to compare final one-year forecasts with those made at the start of the period. The graph below reinforces the message of the graphs above: Wall Street tends to overestimate earnings. EPS estimates were reduced in nine of the ten years spanning 2016 through 2025. However, the trend has changed, with 2026 and 2027 estimates trending higher than original forecasts.
G: 3–5-Year Expected Earnings Growth
Forecasting earnings for just 12 months forward is extremely difficult for Wall Street professionals. Accordingly, forecasting three to five years of earnings growth (the G in the PEG ratio) is much trickier and more prone to errors.
(Note: for this article, I use four-year expected earnings growth to balance out the three-to-five-year range of estimates.)
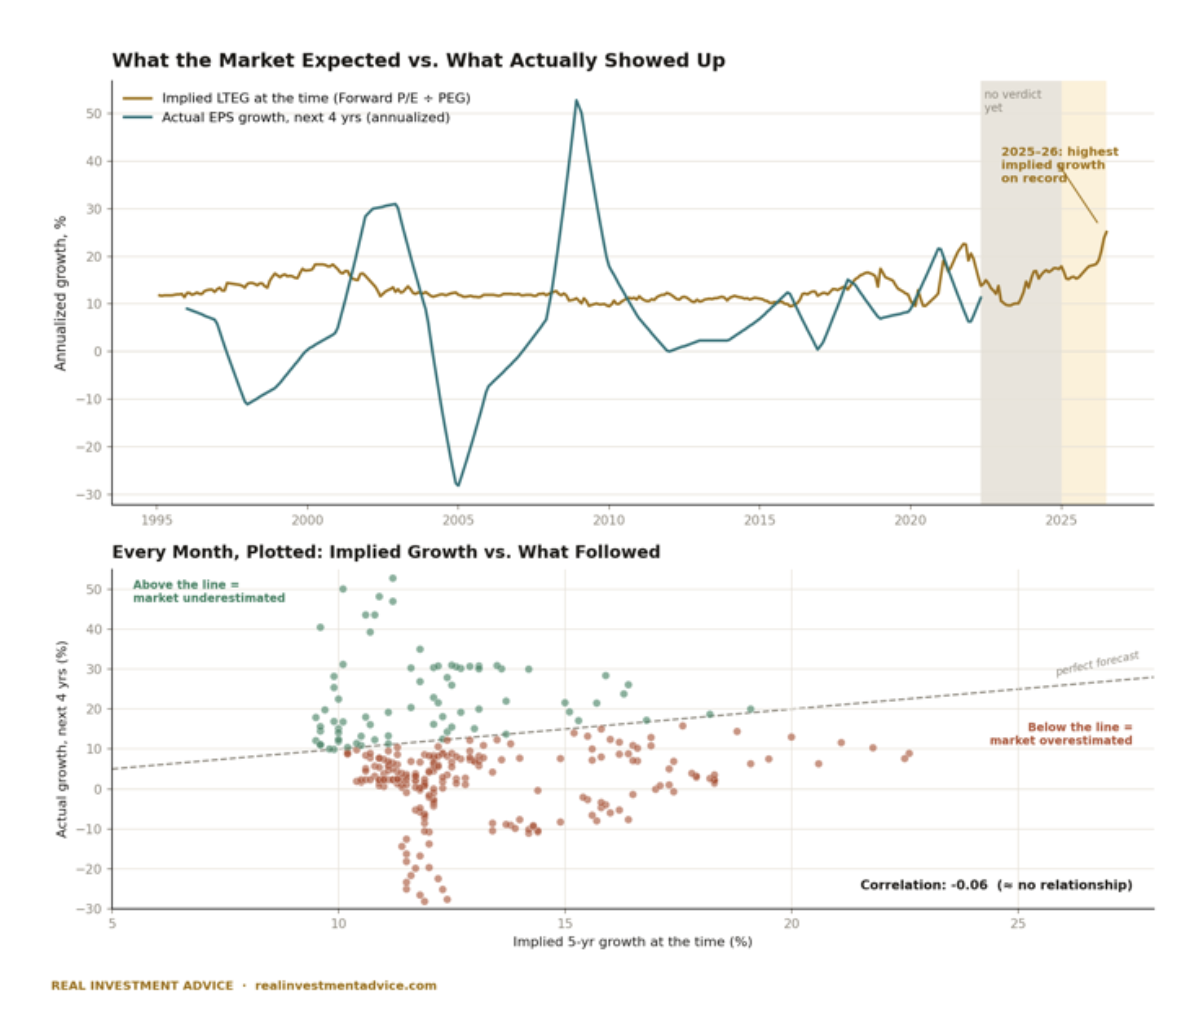
To assess the effectiveness of longer-term forecasts, I can use historical PEG and forward P/E ratios to back out an implied four-year growth rate. As I did with one-year estimates, I then compare that to the actual four-year growth that ensued.
As shown below, there is very little correlation between four-year earnings growth estimates and actual growth. As with the one-year estimates, the market overestimated earnings far more often than it underestimated them.
Deciphering Today's PEG Ratio
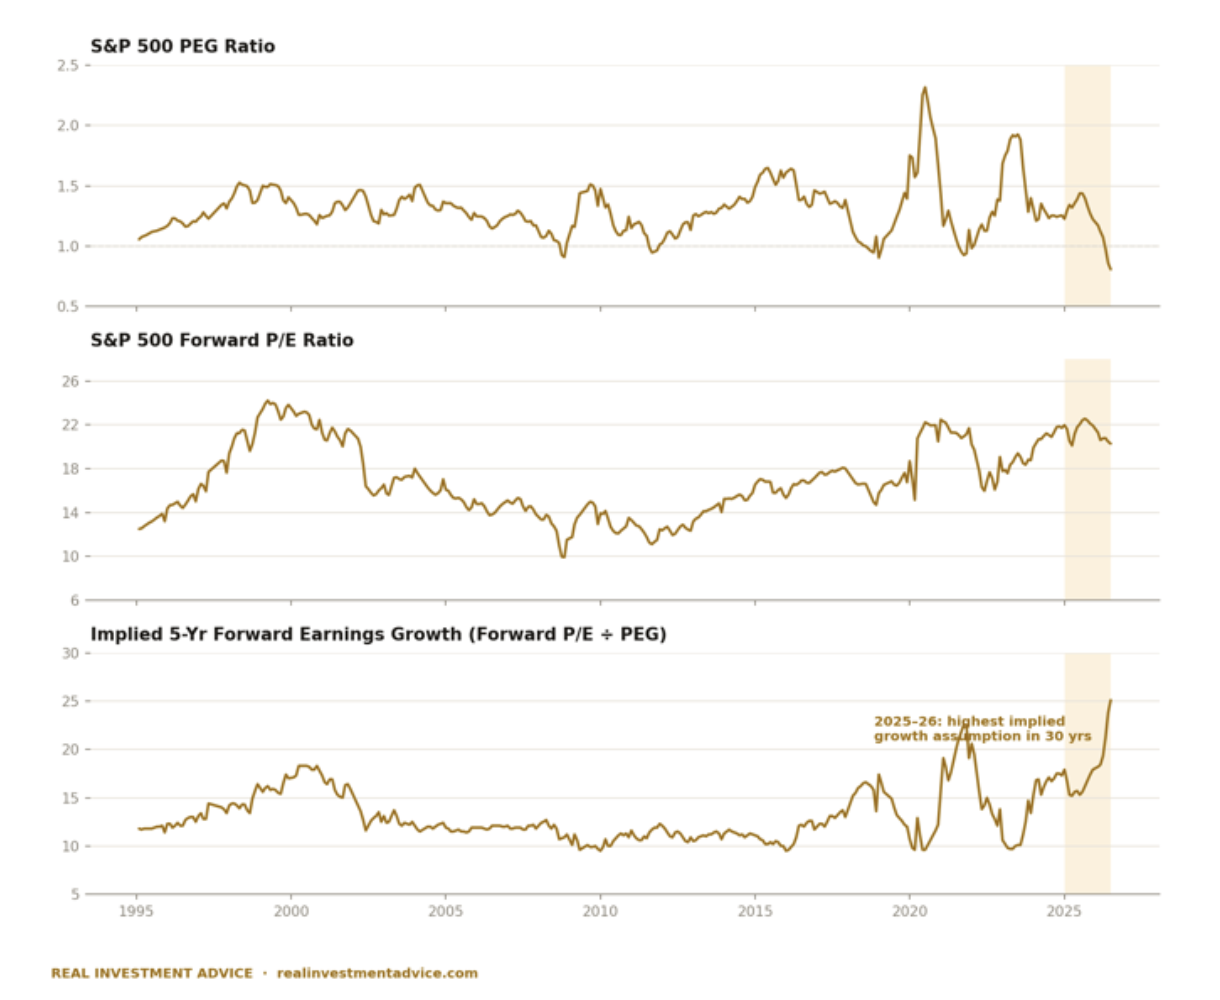
The graphs below show the market PEG valuation and its two components, forward P/E and three-to-five-year earnings estimates.
The middle graph shows that the forward P/E (the numerator) is stretched, indicating a relatively expensive valuation. Despite the forward P/E, the PEG ratio in the top graph is cheap because the longer-term earnings growth estimate shown in the bottom graph is at its highest level since at least 1995. The takeaway is that the PEG ratio is cheap entirely because of strong earnings-growth forecasts.
The G Is Concentrated
The hardest part of analyzing the G in the PEG ratio is the abnormal divergence in recent earnings trends and earnings expectations between a few large tech companies and the large majority of other S&P 500 companies.
Second-quarter earnings results exemplify this problem. In a mid-July summary of the quarter, with roughly one-third of the stocks in the index still to report, FactSet reported the Magnificent 7 was growing earnings 31.1% year over year versus a blended rate near 25% for the index. Only a few weeks later, on August 7, the quarter's growth rate more than doubled, to 50.4%.
Most of that acceleration traced back to two companies. Alphabet and Amazon, both large earnings contributors, reported significant nonoperating gains. Alphabet reported a $98 billion markup in its equity portfolio primarily due to SpaceX, and Amazon added a $53 billion gain largely from Anthropic. Strip out those gains, and FactSet's blended growth rate for the S&P 500 falls from 50.4% to 32.0%. Two companies, out of 500, are worth 18 full percentage points of index earnings growth.
This leads to a big question. Can 10 or so large-cap technology companies carry earnings growth for a 500-company index? Hyperscalers are on pace to spend roughly $700 billion on AI infrastructure in 2026 and are projected to top $1 trillion in 2027. That spending shows up today as reported capex and, eventually, as revenue for a small number of companies selling the chips, the cloud capacity, and the construction and power systems supporting it. It does not contribute much to the earnings growth for the other companies in the index.
Is the Market Rich or Cheap?
Think of this market valuation conundrum between PEG and CAPE like you would your favorite sports team that's been mediocre for a decade. Ten years of results argue that your expectations for next season should be minimal. But during the offseason, the team signed a few all-stars, and a reasonable fan would bump up their expectations regardless of the last 10 years.
The historical losing record is real, and so is the upgraded roster. The substantial growth estimates are making a big bet that the new players will significantly help the team. The question investors need to ask is whether they will help generate more wins than the market expects.
So, how should investors think about today’s stock market valuations? The answer likely sits between rich and cheap. If earnings keep growing rapidly alongside AI spending, the market, in aggregate, may be fairly priced despite CAPE's warning. But a recession — or a slowdown in planned AI spending — is a real risk to that outcome.
That said, while the optimism embedded in the PEG ratio carries downside risks, we must also consider that AI's productivity gains will eventually spread to other S&P 500 companies. The open questions are when, how much, and — most importantly for pricing today's market — how that eventual payoff compares to what's already priced in.
Summary
CAPE uses historical realized data to value stocks. You can debate whether the past decade is a fair guide for valuing stocks, but not whether the earnings in CAPE's denominator are real — they are.
PEG asks you to rely on one-year and three-to-five-year earnings estimates. This leaves the obvious question of how much current forecasts deserve to be trusted. The historical answer, as I showed, is not very much.
Nine of the last 10 annual EPS estimates were revised lower before they were finished. Thirty years' worth of four-year growth estimates show no statistical relationship to the growth that followed.
However, today's outlook is trickier than in the past, as the expected growth making today's PEG ratio look so cheap is disproportionately concentrated in a small handful of companies. That earnings growth concentration hinges on AI, a powerful innovation that could be an economic game changer.
PEG says market valuations are cheap, while CAPE says they are expensive. CAPE is a report card on what already happened. PEG is a bet on what happens next. If you keep that distinction in mind, the two market valuation charts stop contradicting each other.
Michael Lebowitz is a portfolio manager with RIA Advisors and author for Real Investment Advice. For more information, contact him at [email protected] or 301.466.1204.
Join RIA Advisors and elevate your career within a deeply experienced team focused on innovation. Our collaborative environment is built on a foundation of advanced technology and effective investment models, designed to enhance your ability to serve clients and grow your practice. Benefit from a supportive culture that encourages professional development and fosters a forward-thinking approach. By joining our team, you’ll be part of a group dedicated to excellence and continuous improvement, empowering you to focus on building meaningful client relationships and pursuing your business ambitions. Discover the advantages of working with our accomplished advisory team by starting your conversation today.
A message from Advisor Perspectives and VettaFi: Discover something new! Click here to register for our upcoming webcasts.
Membership required
Membership is now required to use this feature. To learn more:
View Membership BenefitsSponsored Content
Upcoming Virtual Events View All