The Hidden Concentration Between a Portfolio's Equity & Bond Sleeves
Membership required
Membership is now required to use this feature. To learn more:
View Membership Benefits Advisor Perspectives welcomes guest contributions. The views presented here do not necessarily represent those of Advisor Perspectives.
We all know that equity funds like the Vanguard S&P 500 ETF (VOO) and the Vanguard Morningstar Total Stock Market ETF (VTI) overlap heavily, but what might be less intuitive is the overlap between VOO and the Vanguard Total Bond Market ETF (BND).
Corporate bonds make up a modest yet significant portion of many bond funds (BND, iShares Core U.S. Aggregate Bond ETF (AGG), etc.). Compared to the rest of the bond sleeve, this appears to diversify the portfolio. However, many investors also hold an equity sleeve that usually comprises the same companies in the bond portfolio.
Let's use this imaginary portfolio as an example.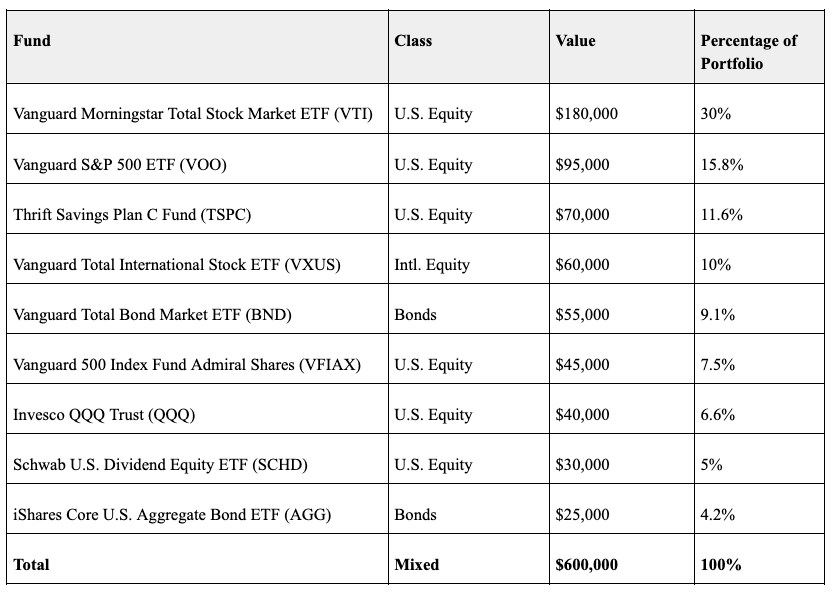
A hypothetical $600,000 portfolio. The funds are real; the allocation is invented.
This portfolio has a few clear concentrations. For instance, VOO, the Thrift Savings Plan C Fund (TSPC), and the Vanguard 500 Index Fund Admiral Shares (VFIAX) are all essentially duplicate holdings (as they all track the same S&P 500 index).
VTI also overlaps with all three of those funds quite significantly (with the overlapping S&P 500 companies held by the three funds representing ~88% of VTI’s total market capitalization), and has a noticeable overlap with the Invesco QQQ Trust (QQQ) (~48% of VTI’s total weight).
Meanwhile, the dividend and international equity ETFs, the Schwab U.S. Dividend Equity ETF (SCHD) and Vanguard Total International Stock ETF (VXUS), provide meaningful diversification, having little overlap with any other fund in the portfolio.
Moving on to the bond sleeve, there is another significant overlap between BND and AGG (~94% by weight).
Unnoticed Exposure
While it is useful to analyze holdings by asset class, a portfolio-wide view can provide additional insights. Typically, the bond sleeve and the equity sleeve are seen as entirely separate. However, they usually hold unnoticed concentrations in different companies. About a quarter of holdings within most broad bond funds are corporate bonds, and a vast majority of those corporations are also present in investors' equity sleeves.
A company with shares listed on the market can also borrow, and the large ones typically do. When an investor holds a broad equity fund and a broad bond fund at the same time, some companies end up in both products — as stock in one and as debt in the other. Fund-level overlap will never show this, because the two funds hold almost nothing in common, despite the intensified exposures to individual companies.
A share of Apple and an Apple bond are different instruments with different CUSIPs, so the measured overlap between VTI and BND in this portfolio comes out to 0.63%, which is effectively just cash. That leaves a question the usual measurement cannot answer: How many companies does this portfolio actually hold twice, and where does that doubling sit?
Looking at the Big Picture
Expanding all nine funds in the example portfolio into their underlying securities, 509 distinct companies show up as both stock and debt. That works out to 2.14% of the $600,000 portfolio being held in the bonds of companies whose shares are already owned, or about 16.0% of the entire bond sleeve.
The more useful finding is that the doubling is not evenly distributed. Financial companies are the largest block by a wide margin, carrying roughly 26% of all the debt of companies that are also represented in the equity sleeve, close to twice as much as the next sector. Six of the 10 largest cross-sleeve overlapped positions are banks: JPMorgan Chase, Bank of America, Morgan Stanley, Goldman Sachs, Wells Fargo, and Citigroup.
The reason is not complicated. Banks borrow as a matter of business, far more than an ordinary company does, so they end up among the heaviest corporate issuers in any broad bond index. They also happen to sit in almost every broad equity index. A fund like BND holds them in proportion to how much they have borrowed rather than in proportion to their size, like in a traditional cap-weighted index fund.
The Banks Example
Let’s look at an example to clarify. Information technology accounts for 24.61% of this portfolio in equity and 0.24% in debt, so roughly 1% of the portfolio’s tech exposure is found in debt, a negligible amount. Financials account for 5.89% in equity and 0.56% in debt, meaning debt makes up about 10% of the total financial position. A much smaller equity position is carrying a much larger debt one alongside it.
This is where the doubling starts to matter for reasons beyond the arithmetic. A bank's stock and a bank's bonds are not independent holdings. They are two claims on the same balance sheet, affected by a lot of the same conditions.
Interest rates are the clearest case. A rate move reprices the bond directly, the way it would any fixed-rate bond. That same move also runs through the bank itself, changing what it earns on lending against what it pays for funding and changing the marks on the securities sitting on its own books. Credit conditions work much the same way. A stretch of rising loan losses turns up in the equity and the spread on the debt simultaneously, because both are looking at the same borrower.
Different Asset Classes, Similar Drivers
None of this makes the two positions identical, and it would be wrong to suggest an investor owns the same risk twice. Debt sits ahead of equity; it gets paid first. The two asset classes actually behave quite differently when something goes wrong.
However, it’s fair to say they are driven by an overlapping set of conditions. Most people aren’t thinking about that when an equity sleeve and a bond sleeve appear in separate columns of a report.
Every figure above comes from three steps, all of them reproducible from published data.
3 Steps
The first is look-through. Each position's weight is its dollar value over the portfolio total. Each fund is then expanded into its constituent securities, with the constituent's weight inside the fund multiplied by the fund's weight in the portfolio.
Funds of funds, such as a target-date fund, are expanded recursively. Holdings come from the issuers' own published files for ETFs and from SEC N-PORT filings for mutual funds, which carry a roughly 60-day lag.
The second is overlap. For two funds, A and B, overlap is the sum over every security they both hold of min(wA, wB), with weights measured within each fund. It is the share of either fund that is the same securities in the same proportions, meaning if Fund A has a weighting of 6% in NVIDIA and Fund B has a weighting in the same stock of 5%, the overlap for NVIDIA is 5%. Now add up the overlap of every security both funds share, and you have the total overlap.The third step is what makes the cross-sleeve number possible. Equity holdings files are keyed by ticker. Bond holdings files are keyed by CUSIP, and a single issuer will have dozens of CUSIPs outstanding, one per issue, differing by coupon and maturity.
The first six characters of a CUSIP identify the issuer rather than the issue, so grouping issues by those first six characters turns dozens of rows into one issuer-level position. That issuer then has to be matched to a listed ticker, finally pairing the two asset classes.
Doubled Exposure Might Not Be a Problem
First and foremost, a roughly 2% cross-sleeve overlap is not a reason to panic. Even in a traditional 60/40 portfolio, the overlap between stocks and bonds is only 5.5%. None of this says the portfolio above is built poorly — or that it is built well. The two asset classes still behave differently from one another for all the reasons they always have.
The narrower point is that some part of what looks like exposure to a second asset class is exposure to the same companies through a different instrument. Moreover, that duplicated exposure concentrates in the one sector where results are most closely tied to rates and credit.
Whether that matters depends on the portfolio, the horizon, and what the bond sleeve was understood to be doing in the first place. That is a judgement for whoever owns the portfolio and whoever advises them; it is not for my measurements to settle.
All calculations are as of 8/3/2026.
Anthony Jordan is a software developer and a student at Colby College. He built Overlap Monitor, a portfolio look-through tool. All formulas used in this article, including the overlap calculation and the issuer-level bond join, are published in full at overlapmonitor.com/methodology. He is not a financial advisor, and nothing here is financial advice.
A message from Advisor Perspectives and VettaFi: Discover something new! Click here to register for our upcoming webcasts.
Membership required
Membership is now required to use this feature. To learn more:
View Membership BenefitsSponsored Content
Upcoming Virtual Events View All