Narratives vs. Fundamentals: Battle in the Bond Market
Membership required
Membership is now required to use this feature. To learn more:
View Membership Benefits Advisor Perspectives welcomes guest contributions. The views presented here do not necessarily represent those of Advisor Perspectives.
On January 8, 2025, I answered many of your questions with an article titled Why Are Bond Yields Rising? Since then, bond yields initially fell but have recently risen back to early January levels. Unsurprisingly, my email box is again filled with the same questions we got in early January.
This article presents a different perspective on the question of why bond yields are rising. I focus on the difference between narratives and fundamentals. However, I briefly review the current situation with Treasury yields before starting.
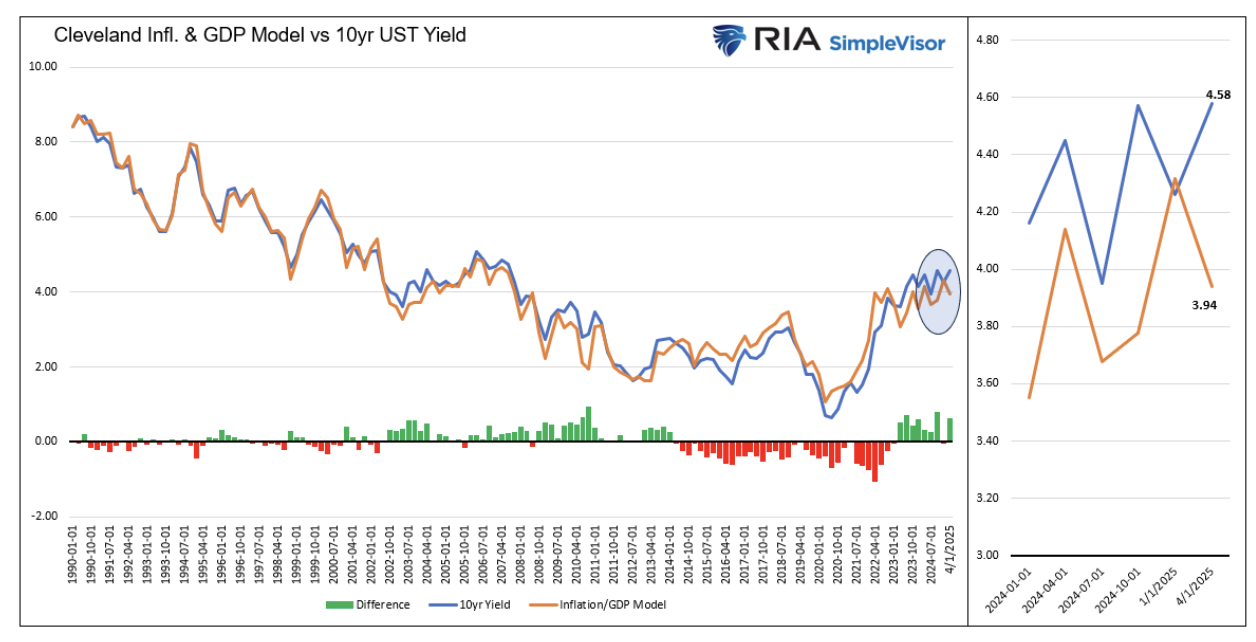
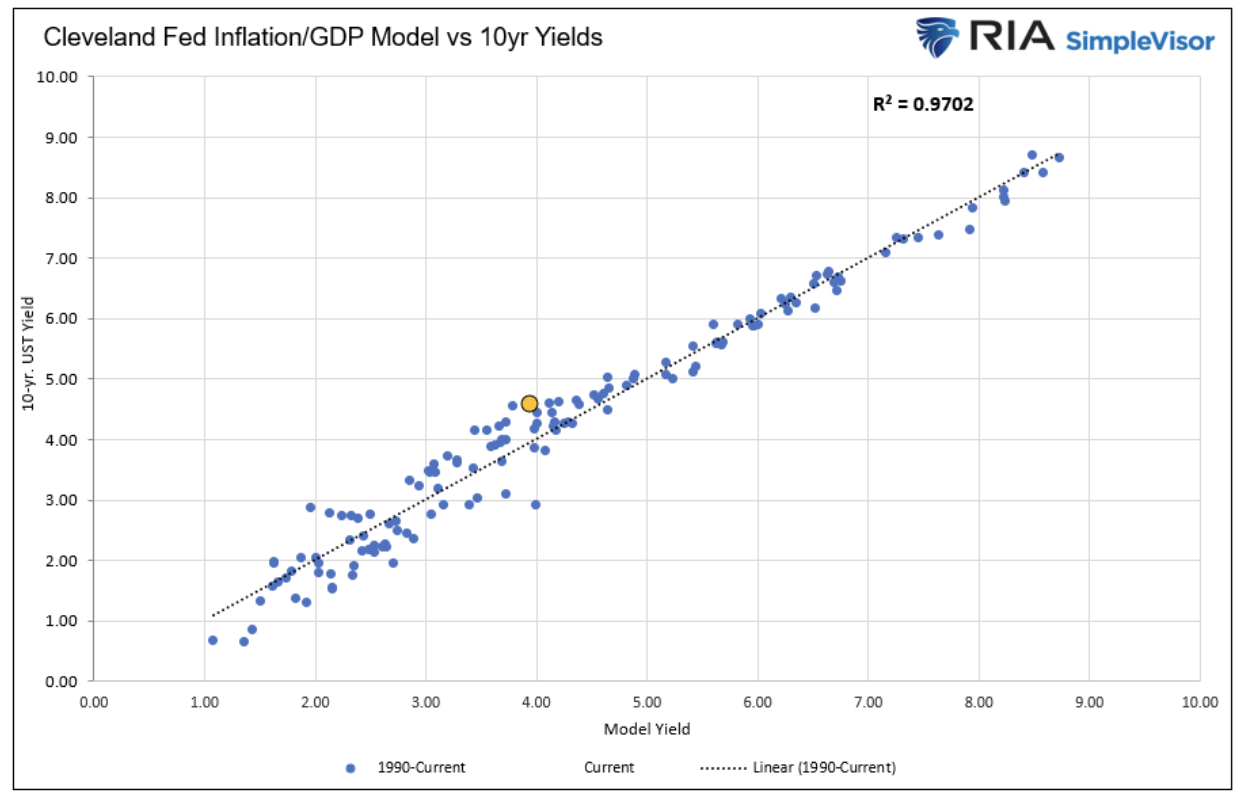
Fundamental bond model
The two graphs below, updated from the January article, illustrate the strong historical correlation between 10-year bond yields and our model, which is based on inflation, inflation expectations, and economic activity. Currently, the fair value yield of the 10-year U.S. Treasury is 3.94%, approximately 64 basis points below the actual yield.
The gap between the fair value and the bond’s yield is technically referred to as the term premium. The term “premium” quantifies all nonmodel factors that impact yields. Today, the divergence can largely be explained by deficits and tariff-related inflation concerns, i.e., the current narratives.
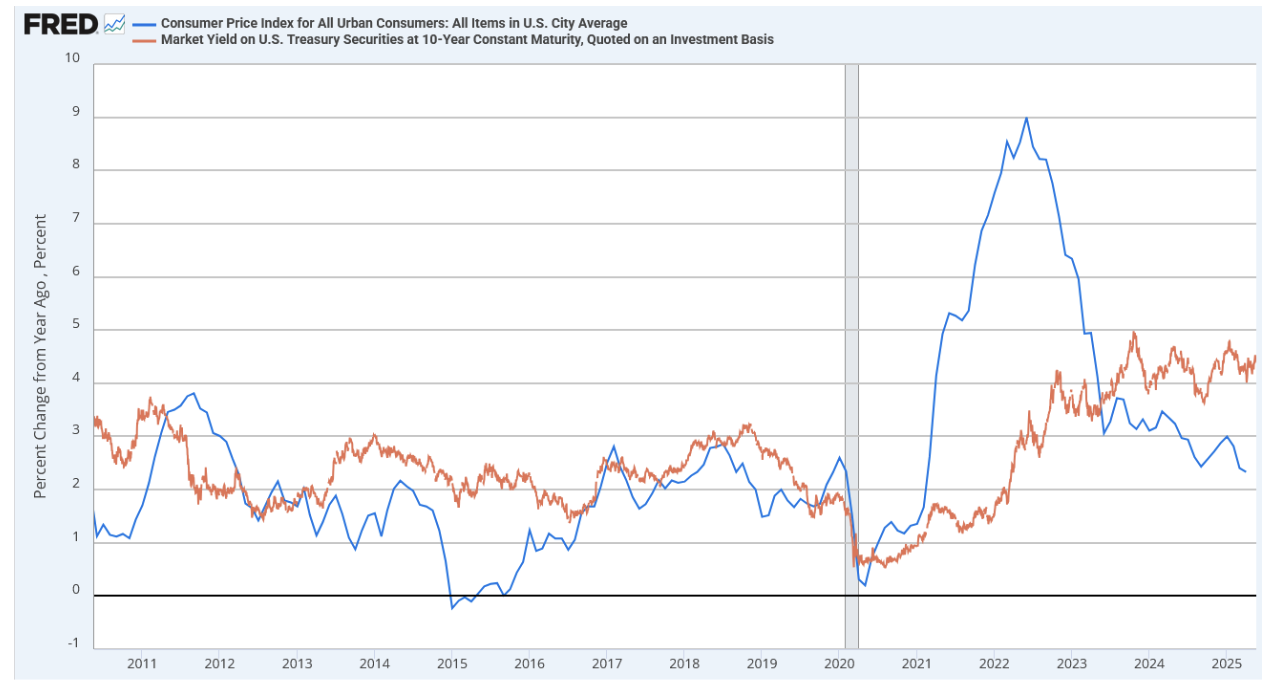
The following graph provides historical context for the relationship between yields and inflation. Yields jumped in 2021 and 2022 as inflation rose to a peak of 9%. Since then, inflation has fallen rapidly and is nearing the Fed’s 2% target. However, bond yields remain near their highs, trading in a wide range spanning 3.75% to 5.00%.
Day Traders, narratives& Fundamentals
Fundamentals, such as the price-to-earnings ratio for stocks or the term premium for bonds, are meaningless for day traders. Narratives explaining why markets rise or fall are equally worthless to day traders.
Day traders focus on minute-by-minute imbalances between buyers and sellers. They devise trading tools to quantify how said imbalances may impact prices. Their work is incredibly technical. Most successful short-term traders do not care about market narratives and do zero fundamental analysis. The impact of these traders is most considerable on very short-term intraday prices.
Looking beyond the day traders, narratives often determine the short- to medium-term price trends. These narratives, which can last days, weeks, months, or longer, are stories or themes that shape how traders and investors interpret and react to changes in the financial markets. They simplify complex topics into easily digestible explanations.
Sometimes, market narratives accurately explain why markets are moving in one direction or the other. However, other times they prove false. Whether grounded in hard data or not, market narratives can perpetuate market trends by shaping shorter-term investor behaviors. Furthermore, as narratives gain popularity, they are amplified by the media and, more recently, social media platforms.
Moving out further, fundamental-based investors focus on hard data and facts. At its core, fundamental analysis enables investors to determine the intrinsic value of an asset or market, and therefore assess whether it is overvalued or undervalued. While fundamental analysis focuses on objective data, its interpretation can vary widely. Investors grounded in fundamentals are willing to look beyond the second-by-second trading of day traders and the narratives that move assets for weeks or months at a time. They are comfortable buying an asset at what they believe is a discount to its fair value.
Fundamentals vs narratives
As active investors, we strike a balance between the short-term impact of narratives and the longer-term performance driven by fundamentals.
This is incredibly difficult in the stock market, as stocks can stay well above or below their intrinsic value for years. Thus, stock narratives tend to result in longer-lasting trends than bond market narratives.
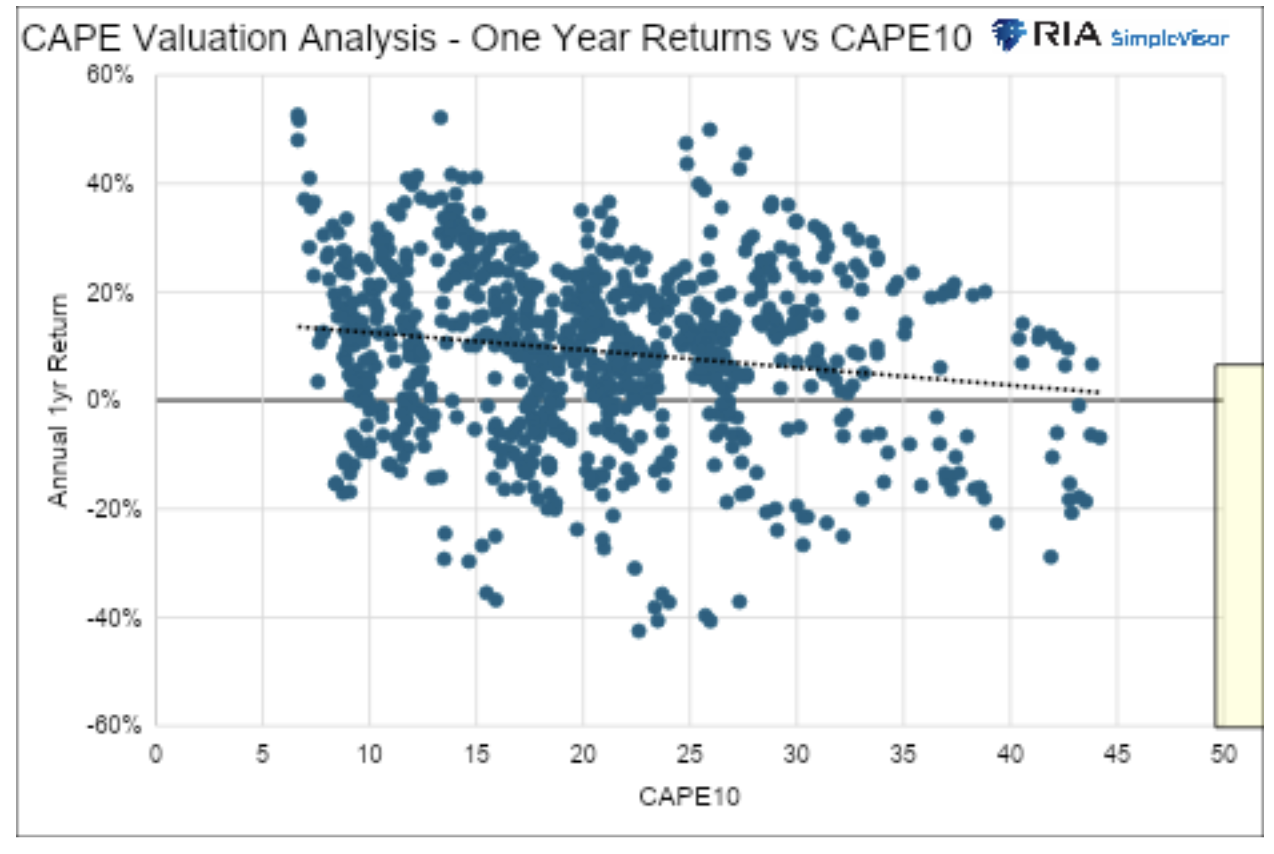
To better appreciate this, consider the first graph below, which shows the correlation between the CAPE10 for the S&P 500 and the one-year returns following each monthly valuation. The chart encompasses 75 years of data. As I highlight, we can expect a one-year performance range of approximately plus or minus 20% at current valuations. Moreover, with an R-squared of .0277, we have no confidence in that forecast.
The following graph shows that fundamentals are much more predictive of returns over 10-year periods. According to this model, the current expectations for the S&P 500's annualized 10-year return range from -0.50% to +3.50%. Not only is the range of expectations tight, but we are much more confident, as evidenced by the R-squared of 0.4033.
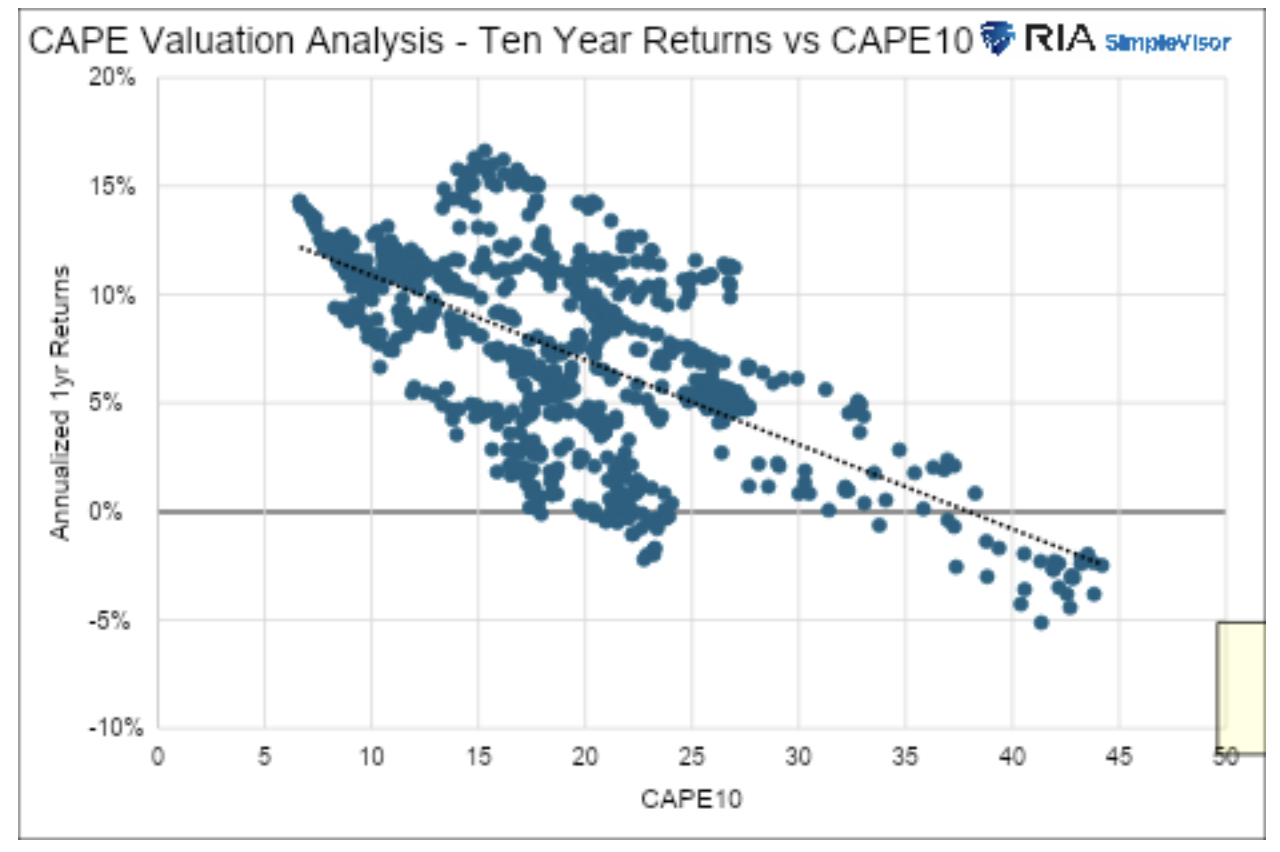
If you are a buy-and-hold long-term investor, the paltry expected returns that stocks offer over the next 10 years should provide caution. However, the first graph informs active traders that the sequence of the annual returns, which comprises the 10-year total return, is difficult to predict. Narrative and sentiment will determine that sequence.
In the bond market, narratives also considerably impact yields, but they don’t tend to last nearly as long. This is due to the interconnectedness between yields and economic activity. Higher interest rates provide less incentive to invest or consume. Thus, as we have repeatedly seen throughout history, periods of above-trend interest rates have been associated with slow or negative economic growth, and vice versa.
Feeding the narratives
Narratives typically need a steady diet of supporting news to sustain themselves. To feed the beast, so to speak, the market exaggerates some news and downplays other news.
The recent round of Treasury auctions is a perfect example of how the current bond bearish narrative shapes the way news is reported.
The 20-year doom auction
The bearish narratives were in overdrive after the Moody’s credit downgrade and the larger-than-expected “Big Beautiful” government spending bill. But narratives always need to be fed. The bearish bond narrative ate on May 21, 2025, with a Treasury 20-year auction deemed “terrible” and “horrible” by some pundits. Some interpreted the auction as an obvious sign that the Treasury was struggling to fund itself.
Might those views be a bit of an exaggeration?
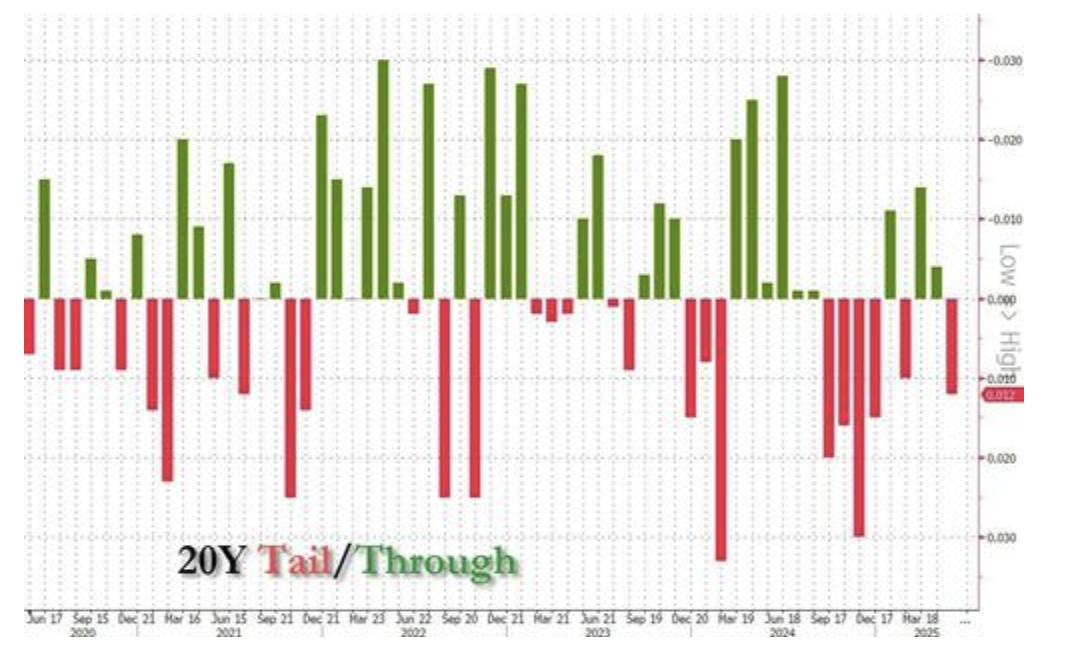
Some fearmongers pointed out the “large” auction tail. The tail is the difference between the auction yield and the yield before the auction. A large tail can mean insufficient demand for the auctioned bonds. As the graph below shows, the recent red tail is not that abnormal. Moreover, the size of the tail is volatile in both directions. This is partly because the 20-year bond is not as widely regarded as a market benchmark as other maturities.
Also, indirect buyers were allotted 82% of the auction bonds. These are primarily central banks. Does that mean foreign demand was strong despite the anti-dollar narrative claiming that central banks are selling U.S. Treasuries in size?
Indeed, the auction could have been better, but the media exaggerated the outcome to feed the bearish bond narrative.
The unseen 10-year auction
Two weeks before the “horrendous” 20-year auction, a very good 10-year auction was met with little fanfare.
For context, the 10-year Treasury is more closely followed than the 20-year and significantly more heavily traded. Importantly, it is a key economic rate, meaning it has a substantially greater financial impact than the 20-year yield. Lastly, bear in mind that the 10-year auction was $42 billion, compared to the relatively small $16 billion 20-year auction.
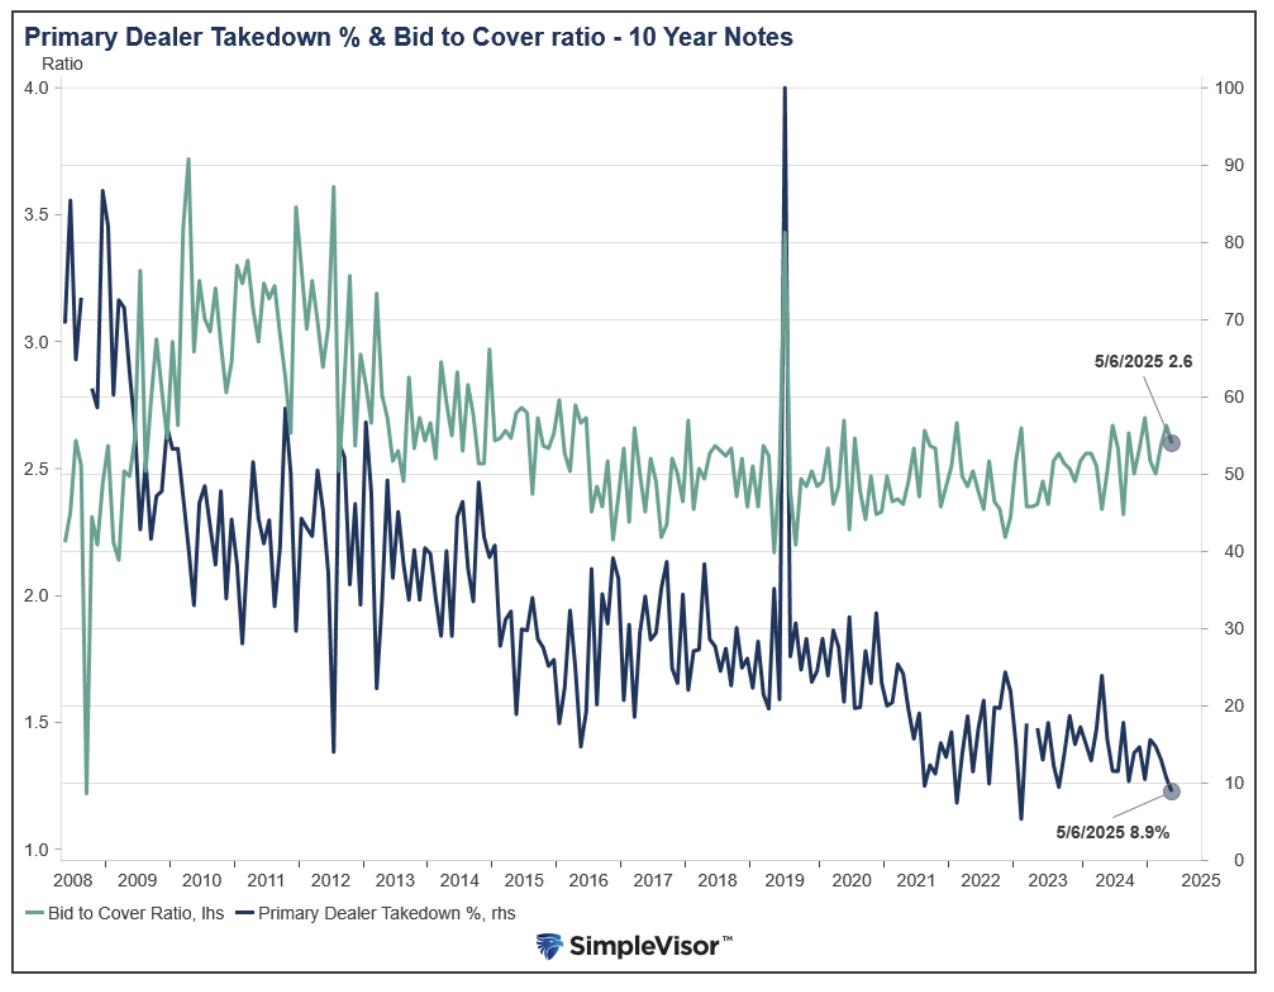
Despite being much larger than the 20-year bond, the 10-year auction was met with strong demand, as seen in the graph below. Primary dealers (direct bidders), the backstop for Treasury auctions, account for the third-lowest allotment since at least 2008 at 8.9%. This signifies that demand from other sources was robust.
Second, there were bids for 2.6x as many bonds as were being auctioned. The average of the last six auctions was 2.4x. Furthermore, the ratio was at the high end of the range of the last 10-plus years.
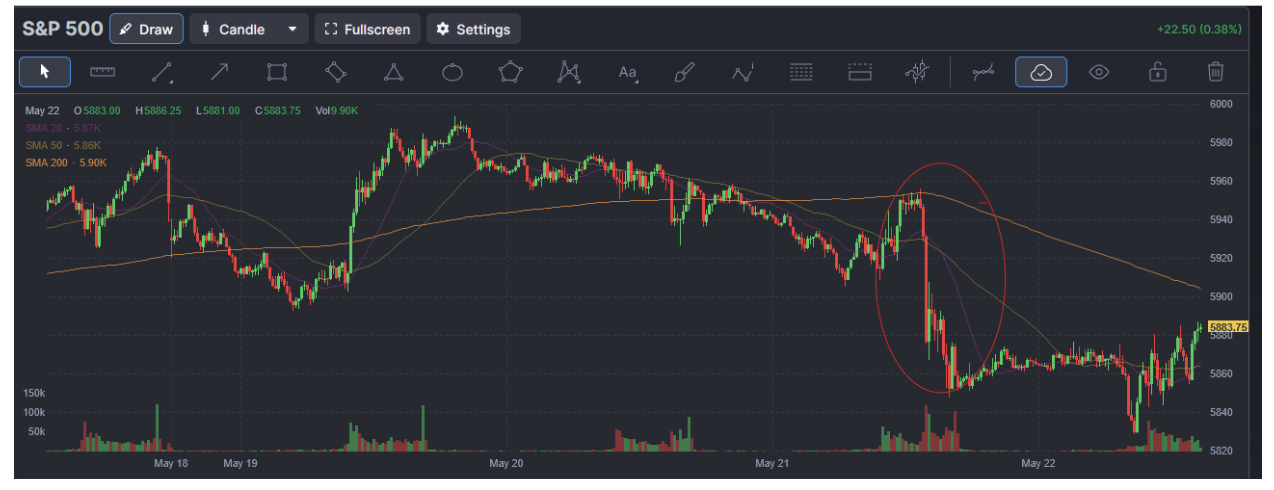
On May 6, despite the outstanding 10-year auction, bonds eked out a small gain. The “meh” 20-year auction and the bearish narratives it fed pushed prices significantly lower. Furthermore, the fear emanating from the 20-year auction sent shockwaves to the stock market, which, as circled below, fell rapidly following the announcement of the auction results.
Debunking the deficit narrative
We believe the hefty term premium is primarily a function of the deficit narratives spreading through the bond market.
History has shown that government spending is often unproductive. Almost all economists agree that the U.S. government has a negative multiplier on its debt. This means that each dollar of government spending reduces long-term economic growth. Therefore, higher deficits lead to lower growth and lower inflation.
While the market worries about the sheer size of bond issuance required to meet the government’s funding needs, it overlooks the potential negative impact on economic growth and inflation. One side of the story feeds the narrative, the other doesn’t.
To help quantify the economic impact of large deficits, we share the graphic below from Rising National Debt Will Cause Significant Economic Damage, a report by the Peter G. Peterson Foundation, May 2025.
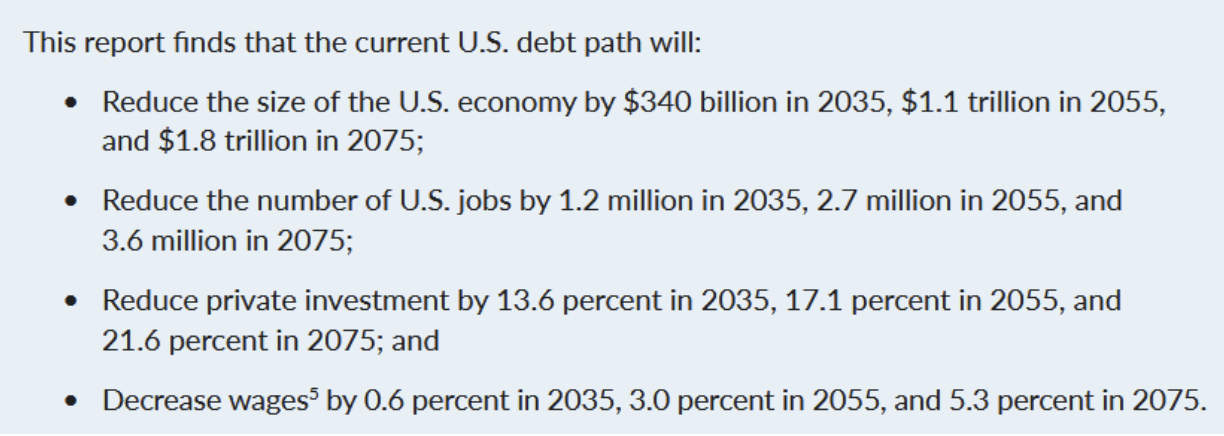
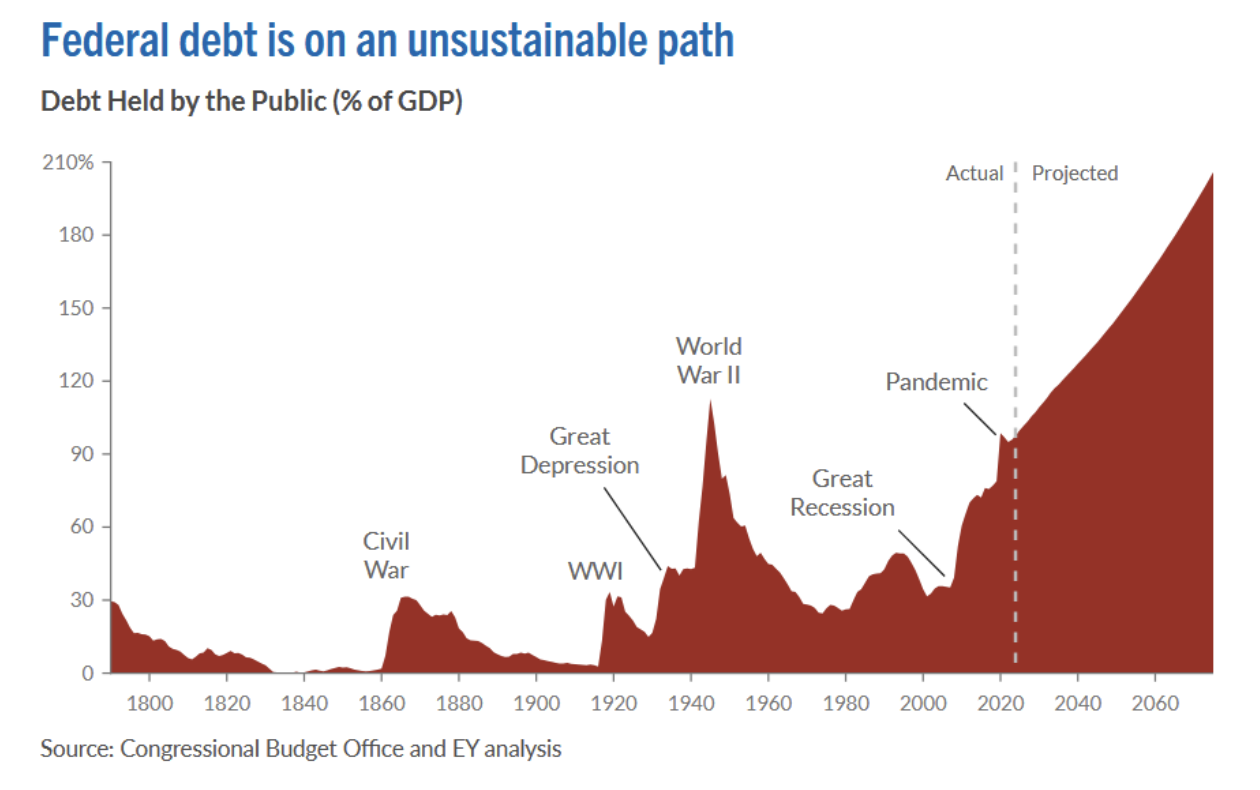
The graphic below from the report shows that, by 2070, the debt-to-GDP ratio may surpass 200%. Assuming that proves correct, which is a big assumption, it would still be below Japan’s current ratio of 265%. Moreover, Japan’s economic growth has slowed to a crawl. Its GDP is the same today as it was in 2018. Further consider that its population is shrinking, and the yen is not the world's reserve currency. Japanese 10- and 30-year yields are 1.60% and 3.10%. S&P and Moody’s rate them a notch below their U.S. equivalents at A+ and A1, respectively.
Summary
We are active investors, which entails walking the fine line between narratives and fundamentals. Whether we agree with the prevailing narratives or not, we must comply with them, as they can significantly impact prices. However, we must also recognize and seize opportunities when we believe the narrative has stretched the price too far from its fundamentals.
Such is the dilemma we face today with bond yields. If we are correct that the bond market is overreacting to deficits, we may see a sharp drop in yields. However, if the current narrative persists, current yield levels or even higher yields may persist.
Our deficit has been growing for decades. We believe this is a critical reason economic and productivity growth has weakened for over 40 years. We have little doubt that if this continues, it will someday become highly problematic. However, that day is not today.
Michael Lebowitz is a portfolio manager with RIA Advisors and author for Real Investment Advice. For more information, contact him at [email protected] or 301.466.1204.
Join RIA Advisors and elevate your career within a deeply experienced team focused on innovation. Our collaborative environment is built on a foundation of advanced technology and effective investment models, designed to enhance your ability to serve clients and grow your practice. Benefit from a supportive culture that encourages professional development and fosters a forward-thinking approach. By joining our team, you’ll be part of a group dedicated to excellence and continuous improvement, empowering you to focus on building meaningful client relationships and pursuing your business ambitions. Discover the advantages of working with our accomplished advisory team by starting your conversation today.
A message from Advisor Perspectives and VettaFi: To learn more about this and other topics, check out some of our webcasts.
Membership required
Membership is now required to use this feature. To learn more:
View Membership BenefitsSponsored Content
Upcoming Virtual Events View All


