Advisor Perspectives welcomes guest contributions. The views presented here do not necessarily represent those of Advisor Perspectives.
Summary
- Investment advisors can add considerable value for investors, but must be aware of the impact of “wrapper fees” paid to third-party managers over time that can erode investment value.
- While investors may be aware of direct fees charged, they are much less aware of the opportunity cost of fees, which have a greater impact on client wealth than the actual fees themselves over time. Fees reduce asset values, leading investors to miss out on compounded returns.
- In the article, I provide an example in which 120% of the original portfolio value is lost to wrapper fees over a 30-year investment horizon.
- By implementing direct indexing and reducing wrapper fees, advisors can keep significantly more assets in client accounts — which makes clients happier — and increase their own profits while keeping their own management fee fixed.
Introduction
Have you ever felt a little jolt of frustration when you glance at your cellphone bill or cable bill? You sign up for a plan with a reasonable monthly rate only to see unexpected charges or hidden fees. You likely have experienced this with rental cars and hotels, as well. The hidden fee problem happens in investments, too. In fact, investment fees can be even more dangerously opaque.
Investors often benefit from trusting financial advisors to manage their portfolios. As Vanguard has noted, “advisors can add meaningful value by helping their clients with asset allocation, investment selection, rebalancing, tax-efficient strategies, cash flow management, family will and legacy planning, and behavioral coaching during periods of market volatility—each of which are well within an advisor’s control.”1 For this benefit, investors naturally pay fees that cover the advisor’s cost and reasonable profit margin. Asset-based fee advisors typically charge fees ranging from 0.5% to 2.0%.2 This article focuses on asset-based fees that cover both advice and investment-related costs, which is a model that I believe is best-suited for most individuals, as advisors can add value across multiple dimensions.
To manage money on behalf of clients, advisors often turn to asset managers to design and implement portfolios. Embedded in the fee charged to the end-investor can be considerable fees paid to these third-party managers. These “wrapper fees” may be as low as a few basis points for a basic S&P 500 ETF or in excess of 1% for actively managed mutual funds.
In this article, we explore the impact of fees by using a simple example showing the compounded growth of a hypothetical $100,000 investment in the S&P 500 over the past 10-, 20- and 30-year periods. We illustrate not only fees paid, but the opportunity cost associated with lost interest on interest.3
For my analysis, I assume the average all-in fee paid by an investor is 1.25% of assets. This fee is inclusive of all costs associated with maintaining a portfolio, including the fees paid for custody and portfolio implementation, the costs of the underlying investments, and the costs and profit margin of the financial advisor.
We estimate the impact of reducing all-in fees from 1.25% to 1%, cutting 25 basis points from wrapper fees, to be approximately 120% of the initial portfolio value over a 30-year period. This reduction in fees could be realized without impacting the advisor’s profit margin by moving from higher-cost investments, such as mutual funds managed by third parties, to more cost-efficient and customizable direct-to-index solutions such as Syntax Direct. I will close with comments on how Syntax Direct, our direct-to-index platform, can help financial advisors and their clients achieve their goals and objectives.
The power of compounding
Albert Einstein referred to compound interest as the eighth wonder of the world.4 Warren Buffett said, “My wealth has come from a combination of living in America, some lucky genes, and compound interest.” The power of compounding high returns is illustrated by comparing the results of the S&P 500 over 10-, 20- and 30-year time frames, as shown in Exhibit 2, before considering the impact of any fees.
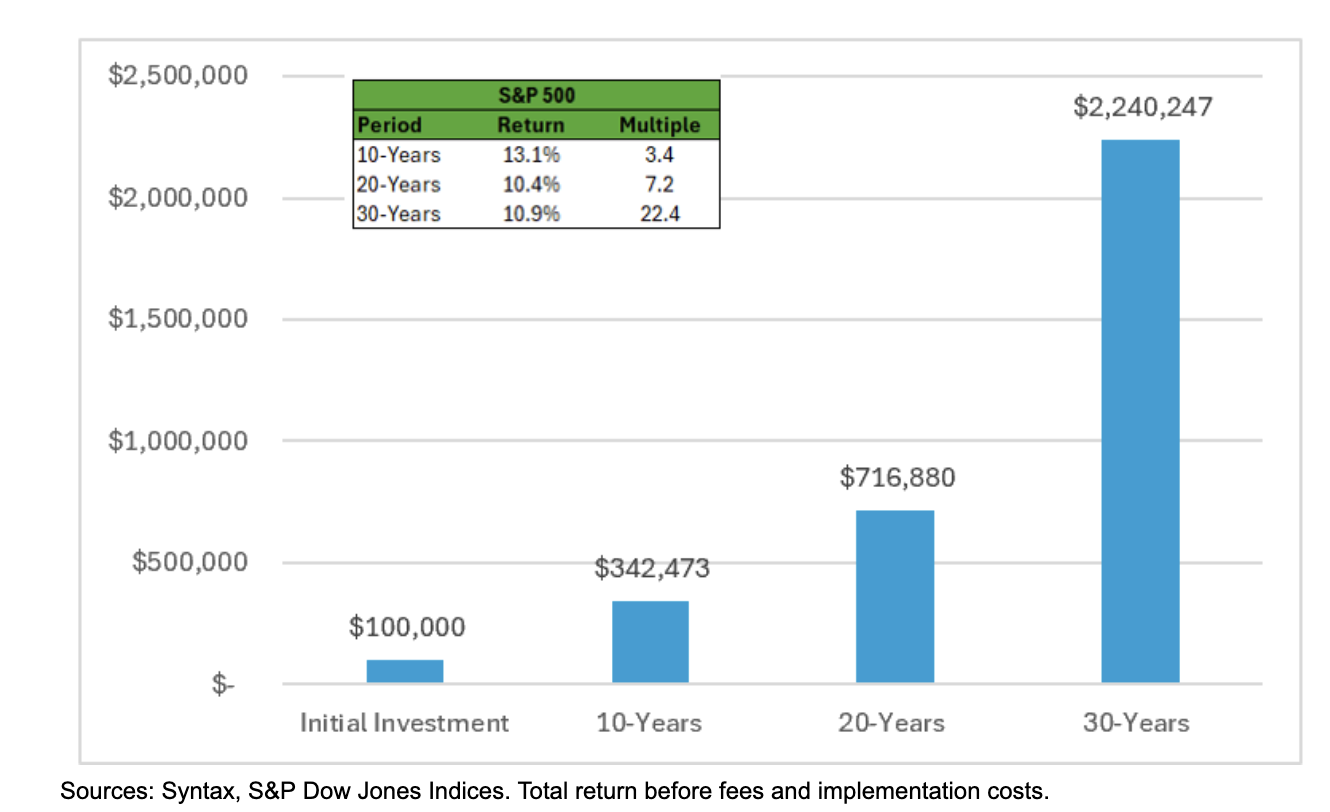
Exhibit 1: S&P 500 Growth in $100,000 Over 10, 20, and 30 Years Through 12/31/2024
As shown in the table, the S&P 500 return over the past 10 years has been exceptional, at 13.1% per year. The 20- and 30-year results have been strong at 10.4% and 10.9%, respectively. A hypothetical $100,000 investment grows to about $350,000 over 10 years and doubles to roughly $715,000 over 20 years. Remarkably, the 30-year results triple to more than $2.2 million, or a multiple of 22.4 times the initial $100,000 investment. Compounding is indeed a powerful force.
The growth of $100,000 in the S&P 500 is shown in Exhibit 2 as well, but this time it includes the impact of a 1.25% fee, reflecting the cost an individual may pay for both advice- and investment-related fees as part of a relationship with a financial advisor.
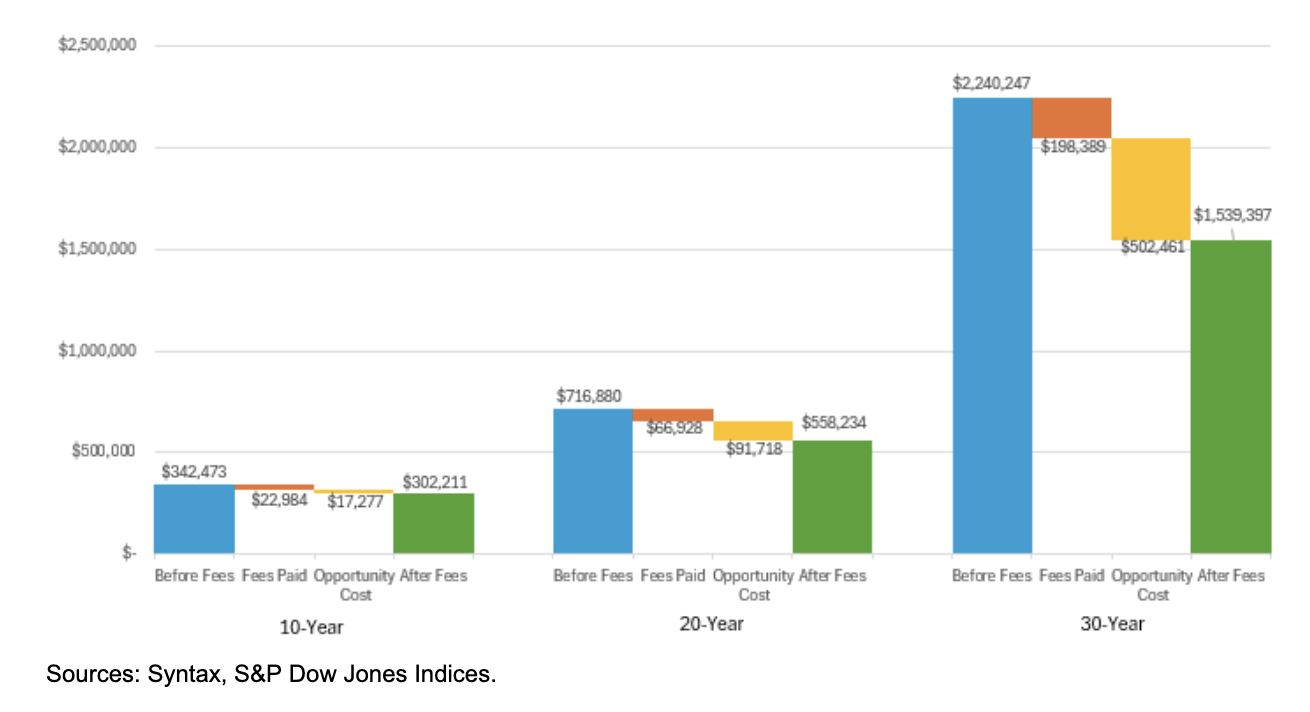
Exhibit 2: S&P 500 Growth of $100,000 Over 10, 20, and 30 Years Net of 1.25% Asset Fee
Focusing on the 30-year results, the blue bar represents the ending value of the S&P 500 before fees and is equal to the $2.24 million as shown in Exhibit 1. The green bar reflects the after fee value of $1.54 million, a difference of $700,000. Yet the fees paid (the orange bar) are only $198,000. So, what is the $502,000 (the yellow bar) that we refer to as the opportunity cost?
This hidden cost is the impact of having lower balances over the life of the investment tied to the payment of fees, or the loss of interest on interest. When fees are paid over each period, the investor no longer earns an investment return on the money taken out of the account. Over time, this impact grows dramatically, particularly during periods of sustained high returns. Over 10 years, the fees paid are higher than the opportunity cost ($22,984 versus $17,277), but this changes over time. Over 20 years, the opportunity costs are about 37% higher than the fees paid, and over 30 years, the opportunity costs are roughly 2.5 times the fees paid.
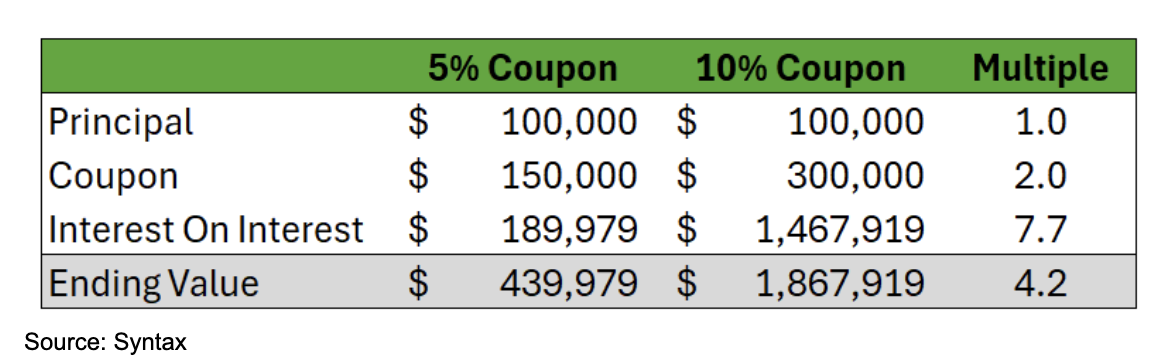
As it turns out, over long periods of time, interest on interest (compounding) is the largest driver of returns. Exhibit 3 shows the value of investing $100,000 in two 30-year bonds: one that pays a 5% coupon and one that pays 10%. The analysis assumes the coupons paid are reinvested at their respective 5% and 10% interest rates.
Exhibit 3: Impact of Interest on Interest: 5% Coupon Bond With Coupons Reinvested at 5%
As expected, the coupon income earned by the 10% bond is twice that of the 5% bond; however, the interest on interest is 7.7 times. The bond with a coupon that is twice as high over its life delivers 4.2 times the total dollar value.
In Exhibit 4, we show the benefit of an investor being able to reduce their fee from 1.25% to 1.00% for the same 30-year investment in the S&P 500.
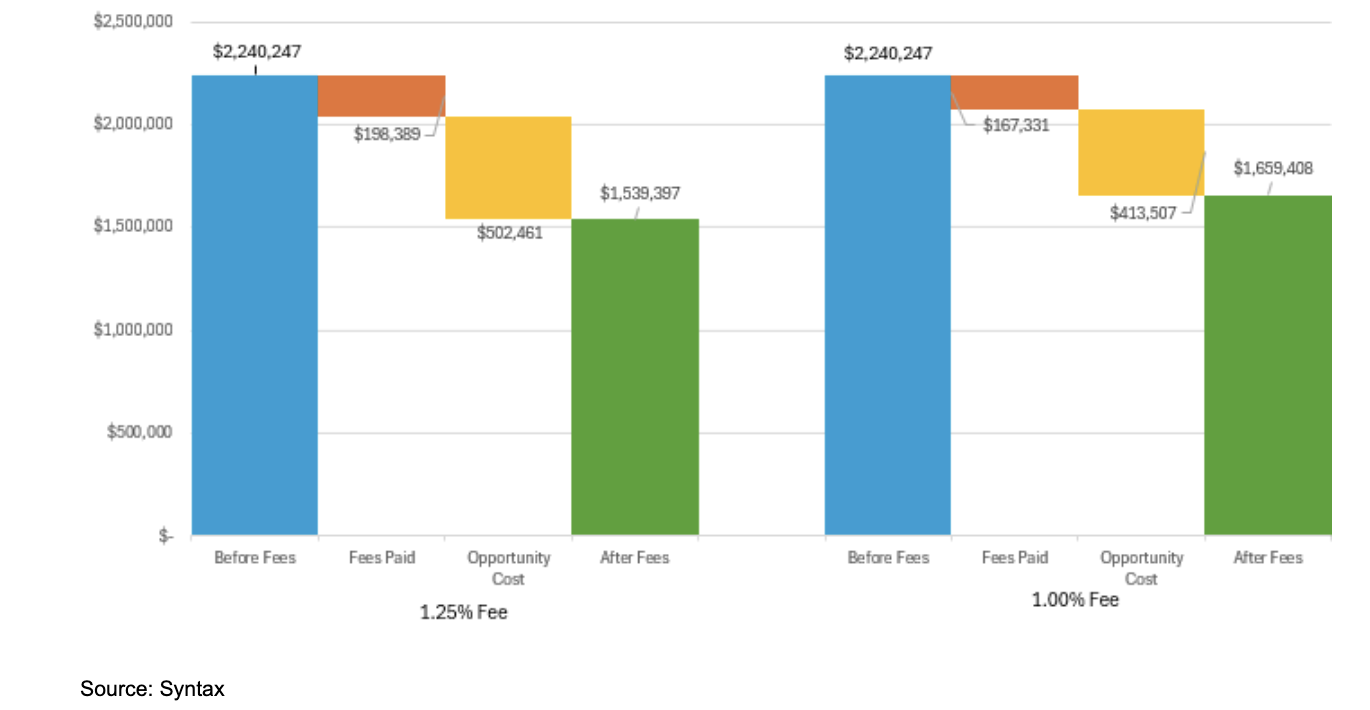
Exhibit 4: $100,000 Invested in S&P 500 Over 30 Years: Impact of 1.25% and 1.0% Fee
The 25 basis point reduction in fees over the life of this example saves the investor roughly $120,000, as the investment would have grown from $1.539 million at the 1.25% fee to $1.659 million at the 1.0% fee. That’s 120% of the initial value of the portfolio saved by reducing implementation fees. Exhibit 5 shows this increase in value comes from roughly $31,000 in fees savings and $89,000 from additional investment return (compounding) associated with having high balances over the life of the investment.
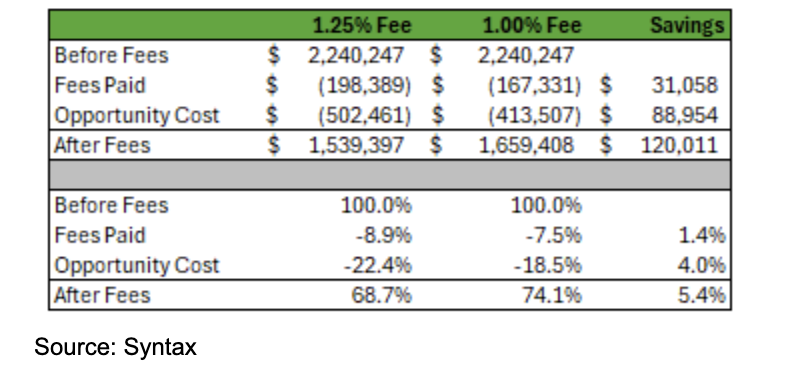
Exhibit 5: Fees Savings From Reduction in Fees From 1.25% and 1.00%
The table above shows that under the 1.25% fee arrangement, fees paid are 8.9% of the index value before fees, and the opportunity cost of interest on interest (or compounding returns with lower balances) is 22.4%. What the investor keeps is about 69% of the before-fee value of this index. Between direct fees and the hidden “negative compounding” effect, the investor loses roughly 30% of their potential value! Under the 1.0% fee arrangement, the fees paid are reduced to 7.5% of the before-fee value of the investment, and the opportunity cost falls to 18.5%; the total value the investor receives increases to 74%. This highlights the importance of managing fees to minimize the negative compounding costs of fees — both the fee itself and the opportunity cost.
Conclusion
Dealing with fees on the goods and services we purchase is a part of life, and the hidden or unexpected fees we pay on our, for example, cellphones or car rentals can be annoying; however, with a little effort, you can quantify the impact. For individual investors, understanding investment-related fees is more complicated. Even if you know the asset-based fee percentage, it is likely difficult to get a detailed statement highlighting the dollar value of the fees paid on a portfolio with numerous holdings and likely multiple service providers. Unlike your cellphone bill, investors also incur a substantial opportunity cost that gets magnified as fees increase.
We recognize that financial planning is complex, and it is hard to quantify the benefits a financial advisor can bring to an individual investor on topics beyond investments such as insurance, estate planning, and taxes. We also understand the need of investors to minimize fees to limit the impact of negative compounding, and the need of financial advisors to be fairly compensated so they can invest in their business and retain the resources and tools they need to fulfill their fiduciary duties while earning a sustainable profit.
To support advisors and their investors, we created Syntax Direct, our direct-to-index platform that allows advisors to create customized, cost-effective indexes at scale, providing advisors an additional tool to manage their costs and generate potential savings for their clients.
Endnotes
1 Celebrating Vanguard Advisor’s Alpha: Clients and their advisors thriving together for 25 years.
2 Financial Advisor Cost | Fee Structures & Average Cost Backed by Data
3 The goal of this article is to illustrate the power of compounding and the impact of fees and negative compounding. We created a simple model where the annual return realized over each period was converted to a monthly return, and fees were paid at the end of the month. In future articles, I will analyze daily benchmark returns that capture the impact of volatility over time. I will also tailor the analysis to how investors typically save, such as making monthly contributions to a 401(k) plan over time, as well as accounting for the impact of taxes.
4 https://www.azquotes.com/quote/364319?ref=compound-interest
Paul Kenney is SVP, Client Solutions at Syntax Data, a financial data and technology company that empowers investment managers, wealth advisors, and financial institutions with precise, transparent data solutions that optimize index development, portfolio customization, and investment analysis to drive better investment outcomes. To learn more about Syntax, please visit www.syntaxdata.com or email [email protected].
A message from Advisor Perspectives and VettaFi: To learn more about this and other topics, check out some of our webcasts.
Read more articles by Paul R. Kenney Jr.
 Advisor Perspectives welcomes guest contributions. The views presented here do not necessarily represent those of Advisor Perspectives.