What Is the Optimal Portfolio Rebalancing Strategy?
Membership required
Membership is now required to use this feature. To learn more:
View Membership Benefits Advisor Perspectives welcomes guest contributions. The views presented here do not necessarily represent those of Advisor Perspectives.
Introduction
Portfolio rebalancing is the practice of realigning a portfolio’s allocation to the allocation percentages originally chosen by an advisor and their client (i.e. the target allocation). This is done by reducing positions that have become an outsized percentage of the portfolio (due to relative outperformance) while increasing positions that have become a smaller part of the portfolio (due to relative underperformance). In doing so, investment managers ensure that the portfolio’s allocation matches their client’s stated risk tolerance.
Unfortunately, this can create a problem. While rebalancing can reduce risk, it can also harm long-term performance. This is true because rebalancing tends to move money out of assets that are outperforming (on a relative basis) and into assets that are underperforming (on a relative basis). As a result, the more frequently you rebalance a portfolio, the more it tends to underperform, all else equal.
This tends to occur regardless of the type of rebalancing strategy you employ. Among financial advisors and planners, the two most common rebalancing strategies are frequency-based — quarterly, annual, etc. — and drift-based — e.g. 5% drift from allocation, 10% drift from allocation, etc. Frequency-based strategies rebalance regardless of what is happening in the underlying portfolio, while drift-based ones only rebalance when the portfolio allocation has strayed too far from its target allocation.
Besides risk and reward, advisors must also consider the costs of employing different rebalancing strategies. The operational time, transaction costs, and possible tax implications of each strategy (e.g. realized gains and losses) can be just as important as the strategy’s underlying performance.
Given this information, the question is: How often should one rebalance their portfolio? Is one strategy better than another for managing risk and maximizing performance? And, lastly, is there a way to save time, money, and effort without sacrificing either?
This research seeks to answer these questions for advisors and their clients alike. To do so, we examine the performance of a 60/40 global stock/U.S. bond portfolio across four different rebalancing strategies:
- Quarterly Rebalance: The portfolio rebalances once every three months.
- Annual Rebalance: The portfolio rebalances once every 12 months.
- 10% Drift: The portfolio rebalances anytime the actual allocation is 10% above (or below) its target allocation.
- Never Rebalance: The portfolio never rebalances across the time periods tested.
The performance, risk, and rebalancing frequencies of these strategies were studied over 29 years of history (Apr 1996–Dec 2024), including five bull markets and four bear markets. The findings show the pros and cons of these rebalancing schemes, which may inform your own best practices for portfolio management.
Lastly, we examine a final rebalancing strategy for those clients that are still in the accumulation phase of their wealth journey. This Accumulation Rebalance is a great way to keep risk tolerances in check without triggering the tax consequences often associated with typical rebalancing strategies.
Rebalancing Portfolio and Frequencies
The four rebalancing strategies in this study hold the same five Vanguard mutual funds and, at their specified frequencies, are rebalanced to the following allocation:
- 35% — Vanguard Total Stock Market Index (VTSMX)
- 30% — Vanguard Total Bond Market Index (VBMFX)
- 20% — Vanguard Total International Stock Index (VGTSX)
- 10% — Vanguard Short-Term Bond Index (VBISX)
- 5% — Vanguard Emerging Markets Stock Index (VEIEX)
This is the rebalancing portfolio that was the starting point for each of the four rebalancing strategies analyzed in this research. For context, the table below gives the total number of instances, and instances per year, that each strategy rebalanced across the 29 years of performance examined:
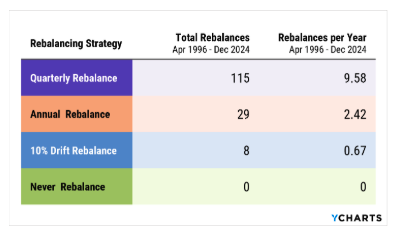
Link to Table (Updated Data Through 2024)
As you can see, some strategies rebalance far more than others, which can create considerable costs for advisors and their clients.
First, there is the operational time associated with rebalancing a portfolio. Modern portfolio software has made this much less painful than it once was, but the opportunity cost of time and labor spent on rebalancing is not negligible.
Second, there are the transaction costs. For mutual funds, these come in the form of purchase or redemption fees, while for stocks and ETFs these can include brokerage commissions and bid-ask spreads. These costs are likely to be passed on from the advisor to the client in the form of management or service fees.
Finally, capital gains taxes are realized whenever a security is sold for a profit, a likely occurrence when trimming a position that has grown within your portfolio. While this won’t be a problem for your clients’ qualified accounts, considerable care must be taken when rebalancing taxable positions.
Since advisors may trigger one or more of these costs every time they rebalance a portfolio, they must weigh these costs with the risk management benefits they provide. Only then can they choose the appropriate rebalancing strategy and frequency to follow for their clients.
Now that we have an idea for how often each of these strategies rebalances (and some of the costs associated with doing so), let’s look at the performance of each.
How Rebalance Frequency Affects Performance
Portfolio drift is a measure of how far a portfolio moves from its target allocation. This measure can be used over time to illustrate how often a portfolio requires rebalancing. Shown in the chart below, portfolio drift for each of the four strategies generally increases over time, then reverts to 0% at each instance of rebalancing. As the frequency and count of rebalancing increases, the 29-year average drift for a portfolio decreases, evidenced by the 12.6% average drift for the Never Rebalance portfolio and 1.3% average drift for the Quarterly Rebalanced portfolio.
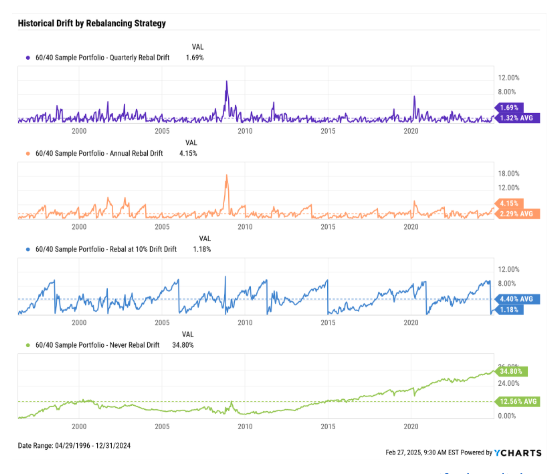
While more frequent rebalancing keeps a portfolio more closely aligned with its allocation targets, the potential downside is that selling winning positions to buy laggards can hinder performance more over time.
Cumulative performance over 29 years differed only somewhat across the four strategies. The Never Rebalanced portfolio outperformed all others by anywhere from 43.8 to 80.9 percentage points.
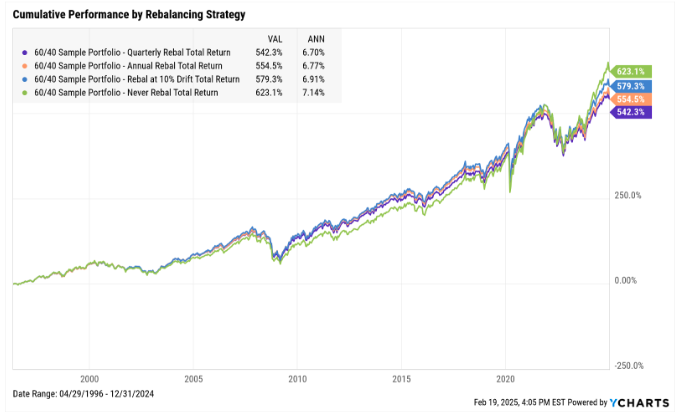
Performance chart link (through 2024)
On an annual basis, the performance characteristics of the four rebalancing strategies appear even more alike. The four portfolios uniformly produced either positive or negative returns in each of the 29 years — rebalancing neither caused nor prevented a significant performance difference in a given calendar year. The latest ten years of performance history are shown below.
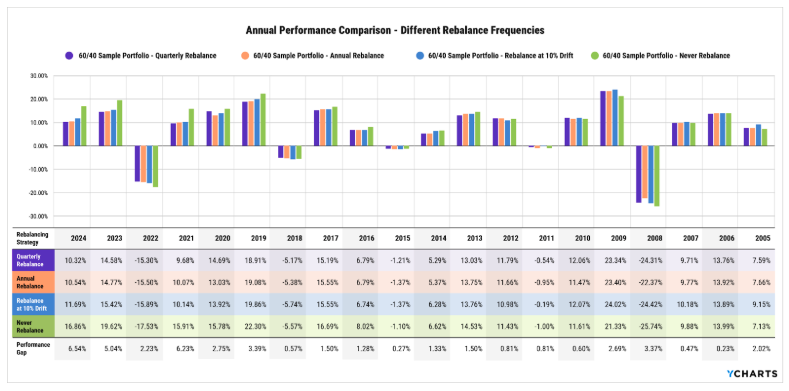
Link to Chart and Table (Updated Data Through 2024)
The largest annual performance gap, given by the highest annual return less the lowest annual return in each period, occurred in 2024, when the Never Rebalance portfolio outperformed the Quarterly Rebalance portfolio by 6.54 percentage points. The average performance gap among the four strategies over 29 years was 1.95 percentage points. Since 2013, the Never Rebalanced portfolio has outperformed the other three strategies in all but two periods — the reason why is examined later in this report.
How Rebalance Frequency Affects Risk Management
As previously noted, more frequent rebalancing succeeds in limiting average drift over time, and inherently keeps a portfolio’s actual allocations in line with its targets. But does less drift equal better risk management?
Different rebalancing strategies appear to have only a marginal effect on portfolio risk, even less than rebalancing’s effect on performance. Portfolio beta, using the S&P 500 Total Return as a benchmark, was greater for the drift-based rebalance portfolio than the frequency-based ones. As for drawdowns, the Annual Rebalance portfolio preserved capital the best — its lifetime max drawdown was 1.9 percentage points less than that of the Never Rebalance portfolio, the worst of the group.
Upside/Downside capture ratio measures how much a portfolio rises and falls in tandem with its benchmark. Portfolios that appreciate more than the benchmark does when it is climbing, and/or depreciate less than their benchmark does when it is falling, will have a greater upside/downside capture ratio. The Annual Rebalance portfolio stands out from the rest on this metric, but not by much.
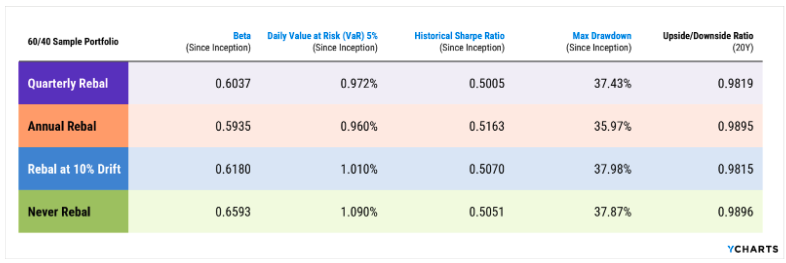
Link to Table (Updated Data Through 2024)
Taken together, all the data in the table below indicates that more frequent rebalancing (e.g. quarterly rebalancing) does not lead to a better risk-reward balance, nor does it limit drawdowns. Rebalancing too frequently appears to actually expose a portfolio to greater drawdowns when the market has lasting, downward momentum. This occurs as a given asset class continues to depreciate, and the portfolio continues buying into that asset class to achieve its target allocation.
Should You Rebalance Differently During Bull and Bear Markets?
While the answer to, “Which rebalancing strategy is best?” would ideally be more definitive, the better question to ask is actually, “Which rebalancing strategy is best — and when?” Why shouldn’t rebalancing schemes evolve based on market conditions, just like investment strategies and portfolio allocations often do?
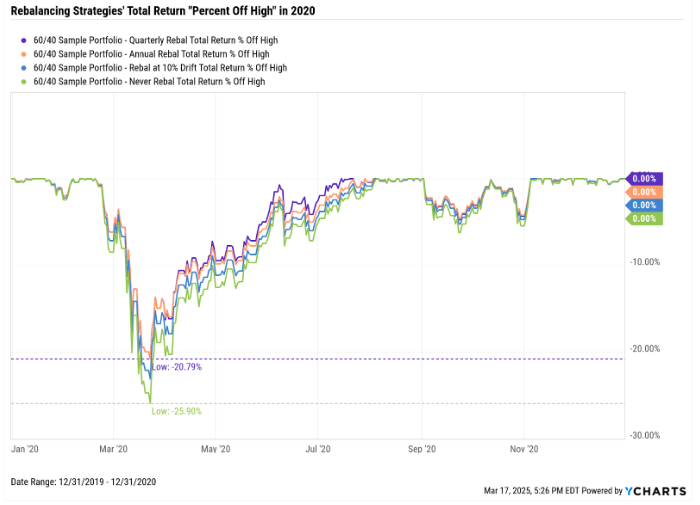
When U.S. equities bottomed out on March 23, 2020 — due to the COVID-19 pandemic — the Never Rebalance portfolio drew down 25.9% from its previous high. In the same period, the Quarterly Rebalance portfolio fell only 20.8% from its latest high. But because the Never Rebalance portfolio outperformed the Quarterly Rebalance portfolio by 1.1 percentage points at the end of 2020, one is led to believe that the optimal rebalancing strategy for maximizing performance does, in fact, differ over time.
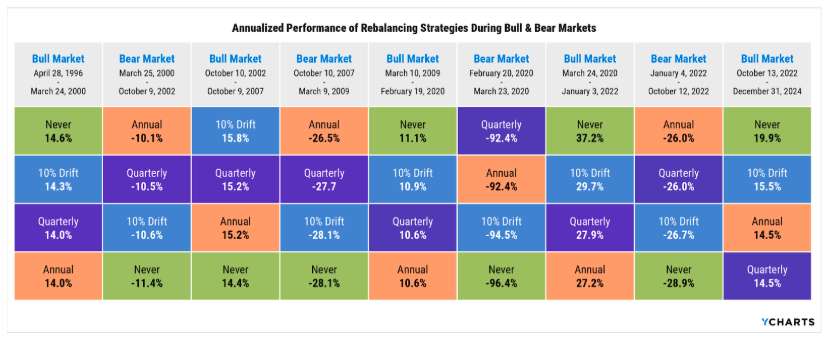
The five bull market periods and four bear market periods encompassed by this 29-year experiment were determined by period highs and lows of the S&P 500 index. (The start and end dates of each period can be seen in the table below.)
In general, less frequent rebalancing leads to better performance in bull markets, but also results in worse performance during bear markets. While our study examined only a 60% stock, 40% bond portfolio allocation, perhaps this trend would reverse if the portfolio in question had a bond allocation greater than 50% and stock allocation below 50%.
The Never Rebalanced portfolio led the group in four out of five bull markets observed. The only exception to the outperformance of Never Rebalancing was the bull market from late 2002 to late 2007. During this period, international and emerging market stocks outperformed U.S. stocks by two times and four times, respectively. Prior to this run by ex-U.S. equities, the Never Rebalance portfolio had never added to its international or emerging markets positions and each depreciated for some time. Thus, the Never Rebalance portfolio had a relatively lower allocation to these asset classes than did the portfolios with rebalancing of any kind, and subsequently missed out on the rally in international markets — a potentially glaring concern for such a strategy.
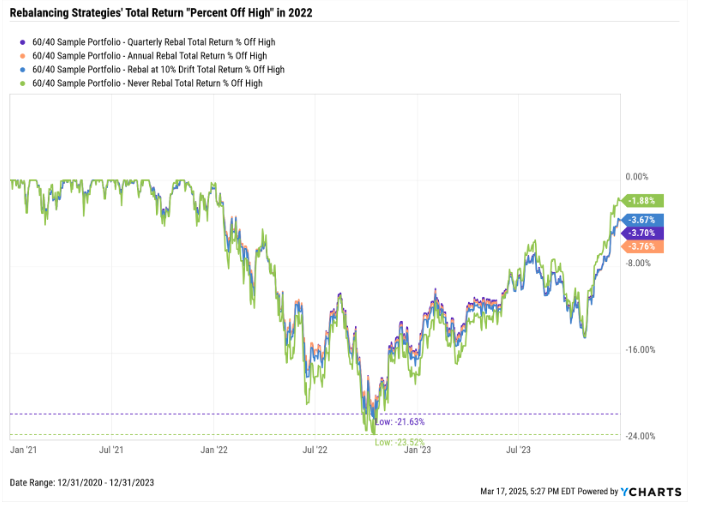
During each of the four bear markets, the Annual Rebalance and Quarterly Rebalance strategies protected portfolio value better than the alternative strategies. Additionally, the Never Rebalance scheme fell to last position in all four of these bear markets, failing to preserve capital relative to portfolios with rebalancing.
Is There a Better Way to Rebalance for Accumulators?
So far, all the rebalancing strategies we have examined assume that money is allocated once and no new money is ever added. However, this typically isn’t the case for advisors and their clients. For individuals who are adding money to their portfolios over time, a better way to “rebalance” the portfolio is to direct new funds to the most underweight assets.
This is called an Accumulation Rebalance. The benefit of an Accumulation Rebalance is that you can keep the portfolio closer to its target allocation without triggering the tax consequences of selling existing investments. So instead of selling stocks to buy bonds (or vice versa), an Accumulation Rebalance can be employed to buy the underweight asset (e.g. bonds) to move it back to its target allocation.
For example, this chart shows the equity percentage in an Accumulation Rebalance strategy (that starts with a portfolio of $10,000 and adds $1,000 per month) and the Never Rebalance over time.
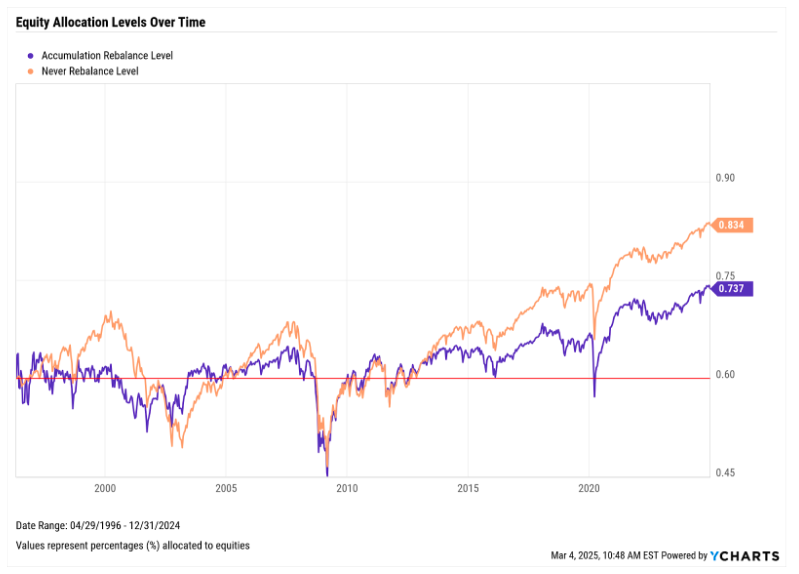
As you can see, the Accumulation Rebalance does a great job of keeping the portfolio within tolerance early on without having to sell any funds. However, this strategy runs into problems during large equity drawdowns (e.g., early 2000s, 2008, etc.) and as the portfolio grows over time. As the portfolio gets larger relative to its monthly investment amount, it becomes increasingly difficult for the Accumulation Rebalance strategy to stay near its target allocation. The solution to this is to have your client increase their monthly contributions over time, but this is easier said than done.
The only other problem with this strategy is its higher operational cost. Not only will an advisor need to check for new money as it comes in, but they will also need to invest it in a timely manner. While this isn’t always easy, having proper cash management is something that every advisor should strive for in their practice.
Choosing the Right Rebalancing Strategy — For You and Your Clients
In conclusion, the optimal rebalancing strategy for managing risk, maximizing performance, and minimizing costs incurred by advisors can change over time, based in part on market conditions. However, more important than any of these factors is the client’s comfort level with the chosen rebalancing strategy. As is often said, peace of mind can be priceless.
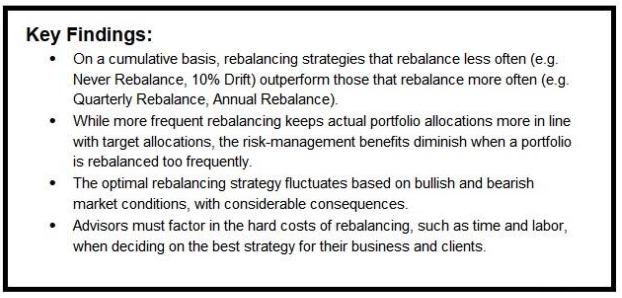
On a cumulative basis, rebalancing strategies that rebalance less often outperform those that rebalance more often. And while portfolios that never rebalance do perform relatively well over time, such a strategy can miss out on secular growth if only a small percentage is allocated to asset classes that eventually become market leaders. While more frequent rebalancing keeps actual portfolio allocations more in line with target allocations, the risk-management benefits diminish when a portfolio is rebalanced too frequently.
Before altering or implementing your rebalancing strategy, a few caveats from this experiment should be considered. Notably, time frame bias and the date of inception could materially affect the performance of a Never Rebalance strategy. Additionally, portfolios holding actively managed funds might better account for the ebbs and flows of different asset classes.
While not applicable to all clients, a proper cash management strategy (via an Accumulation Rebalance) can periodically move a client portfolio back toward its target allocation without needing to sell securities and face tax consequences. Unfortunately, this can only be deployed when clients are contributing new funds over time.
Overall, risk management and performance vary in importance from client to client. Similarly, the costs of rebalancing differ from advisor to advisor. Ultimately, advisors should choose a rebalancing strategy that best serves their client’s needs without putting undue strain on their own operations.
Nick Maggiulli is the chief operating officer of Ritholtz Wealth Management.
Get in touch with YCharts
We are on a mission to enable smarter investment decisions and better communication between financial advisors and their clients. YCharts provides research and presentation tools, actionable resources like this guide, and outstanding support to RIAs, asset managers and other investors. Visit ycharts.com or start a Free Trial to learn more.
Disclaimer
©2025 YCharts, Inc. All Rights Reserved. YCharts, Inc. (“YCharts”) is not registered with the U.S. Securities and Exchange Commission (or with the securities regulatory authority or body of any state or any other jurisdiction) as an investment adviser, broker-dealer or in any other capacity, and does not purport to provide investment advice or make investment recommendations. This report has been generated through application of the analytical tools and data provided through ycharts.com and is intended solely to assist you or your investment or other adviser(s) in conducting investment research. You should not construe this report as an offer to buy or sell, as a solicitation of an offer to buy or sell, or as a recommendation to buy, sell, hold or trade, any security or other financial instrument. For further information regarding your use of this report, please go to: ycharts.com/about/disclosure
A message from Advisor Perspectives and VettaFi: To learn more about this and other topics, check out some of our webcasts.
Membership required
Membership is now required to use this feature. To learn more:
View Membership Benefits