Here We Go Again: Merton Share and Why I Don’t Use Retirement Calculators
Membership required
Membership is now required to use this feature. To learn more:
View Membership Benefits The views presented here do not necessarily represent those of Advisor Perspectives.
Remember portfolio mean variance optimization (MVO)? Unless you’re of Medicare age, you might not, but in the late 1980s, it was all the rage.
In 1952, Harry Markowitz published an algorithm that computed the “efficient frontier” of portfolios that delivered the highest return at a given degree of volatility (which he defined as portfolio variance, the square of standard deviation), or, conversely, the lowest amount of variance at a given degree of return.
For decades after that article’s original publication, the algorithm’s laborious matrix algebra lay beyond the reach of ordinary practitioners, but by around 1990 money managers in search of the MVO fountain of financial youth were eagerly feeding its three inputs – returns, variances, and correlations – into their shiny new desktop computers. The outputted portfolios, thick with the equities of Japanese companies, gold miners, and microcaps, underperformed miserably.
The next fad in quantitative portfolio management was Value at Risk (VaR), which assessed, by a variety of methods, the probability of an asset’s encountering a loss of a given size within a given time frame. VaR achieved near-cult status among financial practitioners, just in time to fall apart during the 2007–2009 financial crisis.
Why was that? Garbage in, garbage out: In the case of MVO, because the algorithm’s outputs are exquisitely sensitive to its inputs, changing an asset’s estimated or historical return by a percent this way or that leads either to its dominating the portfolio or disappearing entirely from it. Wags soon named the new financial engineering fashion the “error maximizer.” Similarly, the inadequacies of VaR’s underlying historical database rendered it worse than useless during an honest to God meltdown.
Interesting but useless
Statistician George E.P. Box famously said that “All models were wrong, but some are useful,” one interpretation of which is that while a good model should help us think about the world, it may not be fit for purpose.
Markowitz had the intellectual honesty to admit that his model fell into the insightful-but-useless category: When Jason Zweig of The Wall Street Journal asked him how he designed his portfolio, the good professor replied:
I should have computed the historical co-variances of the asset classes and drawn an efficient frontier. Instead, I visualized my grief if the stock market went way up and I wasn’t in it—or if it went way down and I was completely in it. My intention was to minimize my future regret. So I split my contributions fifty-fifty between bonds and equities.
Plus ça change. Four decades later, another ancient algorithm, the Merton share, has arisen phoenix-like from the academic literature to become the asset allocation tool du jour. Whereas the Markowitz machine takes pages to describe, the Merton share is simplicity itself:
Merton share (percent stocks) = ERP/(RRA x SD2)
The numerator is the equity risk premium (ERP), and the denominator incorporates the investor’s risk aversion (RRA) and the variance (SD2) of stocks.
The Merton share is the percent of the investor’s total capital (human and investment) placed in stocks. A young investor, for example, whose entire investment portfolio consists of equity, still has a tiny Merton share, since her bond-like human capital dwarfs her investment capital.
Merton share enthusiasts assert that it can produce market-beating risk-adjusted returns by varying equity exposure according to changes in the estimates of the ERP and SD.
What could possibly go wrong? For starters, those with sharp eyes will notice that the Merton share uses two of same inputs – return and SD – as MVO. It substitutes only risk aversion for MVO’s correlation terms. Trouble is, an individual’s RRA is not a relatively stable value, like their height or weight. During bull markets, everyone’s a disciplined buy-and-hold investor with a low RRA, while during market panics, the collective RRA skyrockets.
So, just as MVO produced world-beating portfolio performance only when viewed through the rear-view mirror, so too does massaging the Merton share according to historical ERP – and SD values risk doing the same.
When Elroy Dimson and his colleagues applied similar allocation rules across multiple nations in the 20th century with dividend yields – a key component of the ERP – their derived strategies fell flat going forward. As they wryly put it, “We learn far less from valuation ratios about how to make profits in the future than about how we might have profited in the past.”
Even more alarmingly, the Merton share method decreases equity exposure when volatility peaks, the point, historically, where the highest future returns are earned. As if that were not enough, the Merton share derives its current buzz in no small part from the fame of its inventor.
While Merton is one of the most brilliant financial economists who ever lived, high-level quantitative chops do not guarantee financial success. The boneyards of Wall Street are strewn with genius; as put by Warren Buffett, “Investing is not a game where the guy with the 160 IQ beats the guy with the 130 IQ. Once you have ordinary intelligence, what you need is the temperament.”
In that regard, Merton’s involvement with the 1998 Long-Term Capital Management fiasco – which came within a hair’s breadth of triggering a global financial collapse – should give pause to anyone using his algorithm. Imagine an engineering professor at a prestigious university who produces the field’s seminal mathematical models. Then further imagine that, thirty years later, he designs a span that catastrophically collapses. Some skepticism about his bridge building advice might be in order. Call it the Fundamental Attribution Error of Finance: Smart people do not always have smart ideas.
Retirement calculators
The difficulties of asset allocation algorithms make clear that the vicissitudes of the financial markets, let alone of life itself, render precise portfolio design a fool’s errand. The geopolitical strategist or political scientist who bases their forecasts on even the most elegant stochastic models would rightfully be labeled a crank.
Likewise, the financial markets are not an airfoil or electrical circuit: Why would any reasonable person imagine that even the most powerful mathematical tools can forecast optimal retirement finance strategy with any degree of accuracy? As the joke goes, how does one know that economists have a sense of humor? Because they use decimal points.
We have only a pitifully brief sample of security returns on which to base our forecasts of risk and return. As put by Nassim Taleb, “[the] so-called worst-case event, when it happened, exceeded the worst [known] case at the time.”
Do you think that the near 90% fall in equity prices between 1929 and 1932, the 23% fall on October 19, 1987, or the zero real equity returns between 1966 and 1982 were the worst cases? Look abroad and guess again. Do you think that the 20th century U.S. equity risk premium is in any way predictive? I direct you to the work of Edward McQuarrie on 19th century returns.
Such investment uncertainties are enormous, and I stay away from retirement calculators because the impossibility of accurately modeling the caprice of the financial markets and of human existence itself produces a false sense of security. With a high enough savings rate and a low enough burn rate, it’s possible to get almost any online or software retirement calculator to spit out a 90% or 95% success probability.
You don’t need a Yale history degree to realize how silly this is. The Roman Empire only lasted about a half a millennium, so the average person with an 85-year life expectancy has a roughly 15% chance of encountering a portfolio-ending societal collapse. And the disasters of the twentieth century are even less reassuring in this regard. In addition, many retirement calculators assume that future stock and bond returns will be as generous as in the past, a forecast whose likelihood ranks somewhere between that of the existence of Santa Claus and the Loch Ness Monster.
Long story short, Box’s verdict seems to apply to both the Merton share and to retirement calculators in the same way it applies to Markowitz’s MVO: insightful but useless. How then, to proceed in the face of such model inadequacy?
Start on the back of the envelope
Say the retiree decides she needs $1 million to retire. How to get there? Start with a straight-line deterministic calculation. For example, the PMT function in Excel tells us how much we need to save each month over a 40-year career to achieve an inflation-adjusted $1 million nest egg. Per the below table, we need to save $2,084 each month at a zero real return, but only $503 per month at a 6% real return.
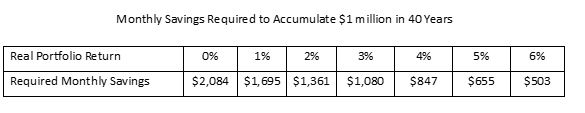
The above table is the financial life-cycle equivalent of the famous Dirty Harry line, “You’ve got to ask yourself one question: Do you feel lucky?” It is, of course, a gross oversimplification: The PMT function assumes constant portfolio returns, but sequence matters. The young saver will do much better with bad returns first/good returns last sequence, whereas that same sequence could easily bankrupt a retiree.
Moreover, the lack of forward visibility of not only investment returns, but also their sequence, is only the beginning of the uncertainty served up by the finance gods. One’s early career could take off and put one on retirement easy street, or one could contract a disabling illness or find oneself in a dead-end job or with a recently obsolete work specialty; one may also want to send children to college. And so on. The young saver just doesn’t know.
What about retirement spending? The retiree first calculates their “residual living expenses” (RLE): how much they need to estimate their annual outlay, inclusive of taxes. For example, the retiree with $70,000 in annual spending, inclusive of taxes, and $30,000 of annual Social Security has an RLE of $40,000.
What’s the appropriate multiple of that to support a successful retirement? Here we’re on much firmer ground. The market for Treasury Inflation-Protected Securities (TIPS) provides a decent method of estimating the target nest egg size.
For example, the 70-year-old wishing to protect their after-inflation spending power to age 100 can do so with a 30-year TIPS ladder. The current yield over that span averages about 2.0%, which amortizes out to a 4.46% COLA-ed payout over those 30 years. $40,000 of real income would thus require a $897,000 ($40,000/4.46%) nest egg.
The 60-year-old wishing to make it to age 100 can only spend 3.66%, with the added uncertainty of having to buy the last 10 annual rungs at the next decade’s 30-year auctions at unknown yields. As such, they would need approximately a $1,093,000 nest egg – more if real yields fall.
This TIPS strategy is said to be “risk free,” but of course that’s only a term of art that translates to “less risky than anything else.” In the real world, even tying one’s shoelaces isn’t truly risk free. It’s easy to imagine bad things happening, even to TIPS, such as the Labor Department fiddling with the CPI-U or the Treasury defaulting.
You say that a TIPS ladder is too conservative for you? Then be my guest; you’re likely to earn higher returns with stocks, but doing so simultaneously makes you more likely to be bunking with your kids in a decade or two.
The bottom line
If you think that a souped-up piece of Monte Carlo software in any way subsumes the gross macroeconomic and personal uncertainties of both retirement saving and spending, then you must also devoutly believe in the Easter Bunny.
It’s far simpler, and more intellectually honest, to start by using the simple back-of-the-envelope methods described above to get you into the savings and retirement ballparks. Then buckle up and internalize the painful fact that even the most sophisticated computational tools are no match for either the unpredictable market gods or the cruel mistress of history.
Don’t shoot me – it’s not my fault I’ve read too much financial history.
William J. Bernstein is a neurologist, the co-founder of Efficient Frontier Advisors, an investment management firm, and a writer with several titles on finance and economic history. He has contributed to the peer-reviewed finance literature and has written for several national publications, including Money Magazine and The Wall Street Journal. He has produced several finance titles, and four volumes of history, The Birth of Plenty, A Splendid Exchange, Masters of the Word, and The Delusions of Crowds about, respectively, the economic growth inflection of the early 19th century, the history of world trade, the effects of access to technology on human relations and politics, and financial and religious mass manias. He was also the 2017 winner of the James R. Vertin Award from the CFA Institute.
A message from Advisor Perspectives and VettaFi: To learn more about this and other topics, check out some of our webcasts.
Membership required
Membership is now required to use this feature. To learn more:
View Membership BenefitsSponsored Content
Upcoming Virtual Events View All


