Five Charts for 2025
Membership required
Membership is now required to use this feature. To learn more:
View Membership Benefits
Advisor Perspectives welcomes guest contributions. The views presented here do not necessarily represent those of Advisor Perspectives.
This has been a year of market highs, puzzling signals, and a few head-scratching moments. Let’s break it all down in five key charts.
No, this time is not different… So far
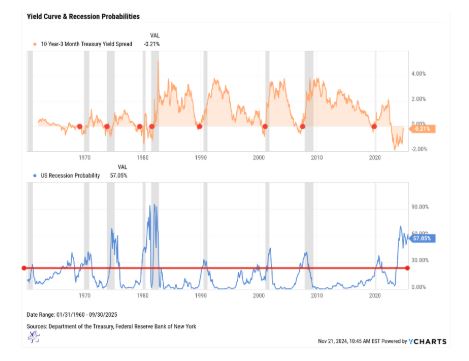
The 10-year minus 3-month yield curve inverted in October 2022, marking its longest inversion in recorded history at 25 months. This phenomenon has garnered significant attention because yield curve inversions, where short-term interest rates exceed long-term rates, are widely regarded as one of the most reliable indicators of future recessions. Historically, a reversion of the curve, where it returns to a normal upward slope, has preceded every U.S. recession since 1955, including the inflationary period of 1970–1982, during which the U.S. experienced four recessions.
As of now, the pattern appears to be holding steady, with recession probabilities reaching levels not seen since the early 1980s. This elevated risk reflects the consistent historical relationship between yield curve reversion and economic downturns. Investors should take note: While the curve has not yet reverted, its eventual shift could signal that a recession is imminent.
That said, some analysts caution against relying solely on historical patterns. Structural changes in the global economy, evolving monetary policies, and central bank interventions may limit the predictive power of the yield curve in this cycle. However, its track record remains unmatched, making it a key metric for assessing recession risks. Whether history repeats itself or takes a new turn, the yield curve’s behavior will undoubtedly shape economic forecasts in 2024 and beyond.
All bubbles pop… Eventually
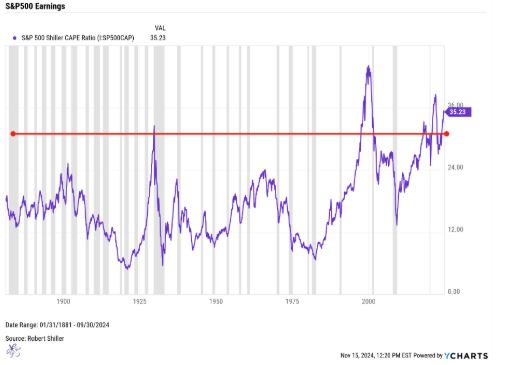
According to the Shiller CAPE Ratio, equities are currently trading at some of the most expensive levels in history, echoing conditions seen during some of the most infamous market bubbles. Historical peaks in this metric occurred in October 1929, January 2000, and November 2021 – periods that were all followed by severe and protracted drawdowns in equity markets. The parallels to today’s environment are striking, raising the question: Are we witnessing another bubble forming?
Each of these prior bubbles shared common characteristics: exuberant investor sentiment, excessive valuations, and a prevailing belief that "this time is different." The similarities to today’s market abound, with high valuations driven by concentrated gains in a narrow set of stocks, relentless liquidity injections from central banks, and speculative behavior among retail and institutional investors alike. While history doesn’t repeat itself exactly, it often rhymes, and the current market environment bears a concerning resemblance to these prior peaks.
As valuations stretch further, forward-looking return expectations and equity risk premiums have evaporated, suggesting that equities offer little compensation for the elevated risks. Investors are effectively betting on perfection, with limited margin for error in corporate earnings, economic growth, or monetary policy. Such conditions create a precarious situation where any adverse shock, whether from inflation, geopolitical tensions, or tightening liquidity, could serve as the pin that pricks the bubble.
While valuations alone do not dictate the timing of market corrections, they are a critical determinant of long-term returns. The lessons of history suggest that periods of extreme overvaluation often lead to painful recalibrations. For investors, the challenge is navigating the current market with a balance of caution and discipline, as well as recognizing the warning signs of a bubble while avoiding the pitfalls of overreacting to short-term noise.
Tight credit spreads: Calm before the storm?
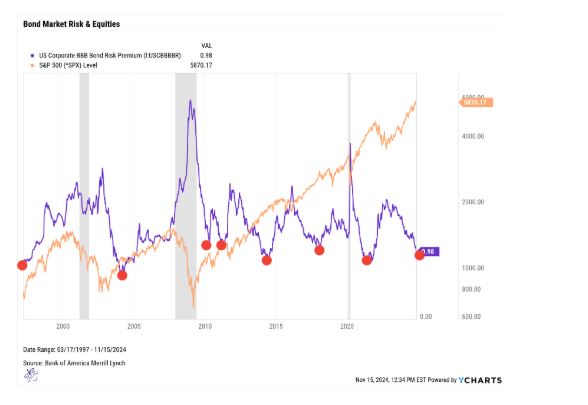
Credit spreads, or bond risk premiums, are currently at some of the lowest levels seen in the past 25 years. These spreads represent the additional yield investors demand to hold corporate bonds over risk-free government bonds, and they oscillate over time between periods of compression (low spreads and low risk premiums) and expansion (wide spreads and high risk premiums). Today’s compressed spreads suggest minimal perceived risk, but history shows that such environments rarely persist indefinitely.
Credit spreads have long served as a reliable contrarian indicator. When spreads begin to widen, it often signals growing investor risk aversion and is frequently accompanied by market turbulence, including heightened equity volatility and drawdowns. For example, during the 2008 financial crisis and the 2020 COVID-19 market selloff, credit spreads widened dramatically, acting as an early warning signal before equity markets declined.
Currently, low spreads may reflect a combination of central bank support and investor confidence. However, potential catalysts, such as rising interest rates, economic uncertainty, or corporate earnings pressure could trigger a reversal. When spreads widen, the impact often ripples through the financial system, increasing corporate borrowing costs, tightening financial conditions, and signaling potential stress in equity markets.
For fixed-income investors, this dynamic highlights the risks of chasing yield in compressed spread environments. Allocating to lower-quality bonds for higher yield may increase exposure to heightened risks just as the market begins to turn. Instead, focusing on higher-quality debt with strong fundamentals can provide stability and mitigate downside risk during periods of credit market repricing.
As spreads remain near historic lows, this is a pivotal time for investors to reassess risk exposure. While the exact timing of a shift in sentiment is uncertain, the cyclical nature of credit spreads reminds us that compressed premiums often precede periods of market stress. Balancing yield generation with an emphasis on quality is crucial in navigating this phase of the market cycle.
Inflation optimism or stagflation warning?
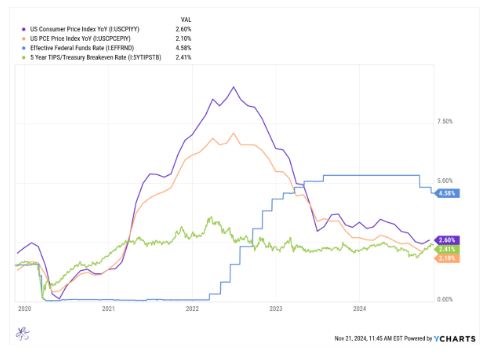
Markets and the Federal Open Market Committee (FOMC) have been optimistic about the slowing growth of inflation, with the Consumer Price Index (CPI) rising 2.6% year-over-year and the Personal Consumption Expenditures (PCE) Index increasing 2.1%. However, the bond market appears less convinced. Five-year breakeven inflation rates, which often lead inflation trends, suggest the market may be overly hopeful about the FOMC’s ability to achieve its projected terminal rate of 3.87%. This projection is already 25 basis points higher than expectations prior to November 5.
Breakeven rates indicate inflation risks remain elevated, challenging the FOMC’s current path. If inflation reaccelerates while growth slows, the economy could face stagflation; a toxic mix of high inflation and weak economic activity reminiscent of the 1970s. During that period, persistent inflation and stagnating growth led to prolonged market underperformance and policy challenges. Signs of stagflation risk include strong wage growth, sticky core inflation, and tightening financial conditions.
The CPI and PCE trends offer critical insights into whether this scenario may unfold. While equity markets cheer slowing inflation, bond market signals caution that terminal rate projections may need to rise further. The resulting policy dilemma – tighten further to combat inflation or risk allowing it to persist while growth slows – could create headwinds for both equity and fixed-income markets.
For investors, navigating these risks requires careful attention to inflation metrics, labor market dynamics, and bond market signals. Stagflationary conditions historically favor defensive sectors like utilities and consumer staples, as well as inflation-hedged assets such as Treasury Inflation-Protected Securities (TIPS). As breakevens flash warning signs, staying vigilant to shifts in inflation expectations and economic growth is crucial for positioning portfolios effectively.
Keep it simple with the S&P 500
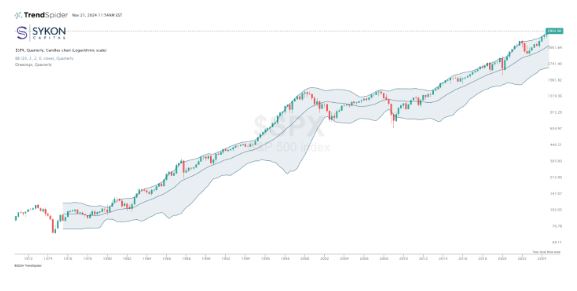
After all the charts, signals, and cautionary tales, the S&P 500 has once again reached new all-time highs in the 12th year of this bull market breakout, which began in Q2 of 2013. Sometimes, the best move is to tune out the noise, resist the urge to overthink, and let the market’s resilience speak for itself.
The market’s signals in 2024 are anything but dull. We’ve got record-long yield curve inversions, equity valuations that could make a 2000 dot-com investor blush, and credit spreads tighter than a pair of skinny jeans. Add in the bond market’s skeptical side-eye at inflation trends, and it’s clear investors are tiptoeing through a minefield of opportunity and risk. Oh, and let’s not forget the ever-present specter of stagflation lurking in the background.
Yet, despite all the noise, the S&P 500 keeps doing its thing – hitting new highs like it’s training for the Olympics. Maybe the lesson here is simple: Stay informed, sure, but don’t overthink it. Sometimes, the best strategy is to hold your nose, trust the trend, and let the market do what it does best – surprise us all.
Todd Stankiewicz, is president and chief investment officer of Harrison, N.Y.-based Sykon Capital. Sykon manages portfolios for financial advisors and institutions who see the value of helping clients minimize downside risk.
Disclosure:
Advisory Services offered through Sykon Capital, LLC, a registered investment advisor with the U.S. Securities and Exchange Commission. This material is intended for informational purposes only. It should not be construed as legal or tax advice and is not intended to replace the advice of a qualified attorney or tax advisor. The information contained in this presentation has been compiled from third party sources and is believed to be reliable as of the date of this report. Past performance is not indicative of future returns and diversification neither assures a profit nor guarantees against loss in a declining market. Investments involve risk and are not guaranteed.
A message from Advisor Perspectives and VettaFi: To learn more about this and other topics, check out some of our videos.
Membership required
Membership is now required to use this feature. To learn more:
View Membership BenefitsSponsored Content
Upcoming Virtual Events View All


