Advisor Perspectives welcomes guest contributions. The views presented here do not necessarily represent those of Advisor Perspectives.
When I discuss technical analysis in articles and podcasts, I often examine the moving average convergence/divergence indicator, better known as the MACD, or colloquially as the Mac D.
The MACD is one of my favored technical indicators to help forecast prices and manage risk. Accordingly, let's learn more about the MACD to see how it detects trends and potential trend changes, and assesses momentum.
It's important to stress that the MACD is just one of many technical and fundamental tools I use to review current or potential investments. There is no such thing as a perfect technical indicator. However, when a handful of trusted indicators give you a similar outlook, the odds of success are much better. As you will see later in this article, the MACD of the S&P 500 has given plenty of wrong signals that, if followed without appreciation for other technical indicators and patterns, would have been costly.
The math behind the MACD
The MACD is the difference between a short moving average and a longer moving average. The MACD line tells us if there is a trend in place. Moreover, if a trend is in place, it tells us if its momentum is increasing or decreasing.
For the daily MACD, it's common to subtract the quicker 12-day moving average from the slower 26-day moving average. Additionally, a nine-day moving average, called the signal, is plotted alongside the MACD to detect momentum changes and potential trend reversals.
Sometimes, a bar chart is included to highlight momentum. The bar chart plotting the difference between the MACD and the signal shows whether the MACD converges toward or diverges from the signal line.
It's worth adding that most technical practitioners use an exponential moving average (EMA) instead of a simple moving average. An EMA gives more weight to recent price data, whereas the simple moving average weights all data equally.
- MACD: 26-day moving average minus 12-day moving average
- Signal: nine-day moving average of the MACD
- Momentum: MACD minus signal
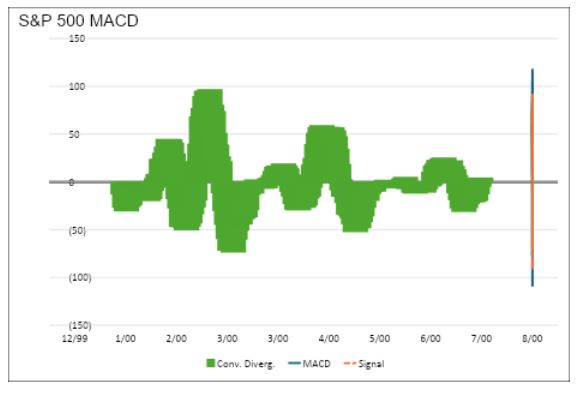
Before moving on, I share a year-to-date graph of the S&P 500's MACD, signal line, and the convergence/divergence bar chart. The price of the S&P 500 is not included, allowing you to focus solely on the MACD.
Convergence and divergence
A MACD convergence occurs when the two moving averages converge with the signal. Thus, the difference between them becomes smaller. When this happens, the bars in the momentum chart will move toward zero. Conversely, a divergence occurs when the MACD increases or decreases faster than the signal. This is shown when the bars in the bar chart move away from zero.
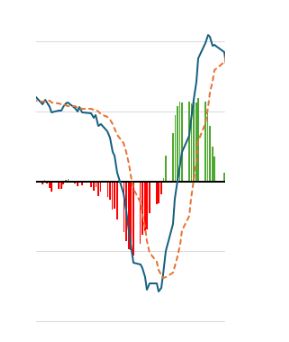
As shown below, in the inset of the graph above, the MACD initially falls faster than the signal. Consequently, the bearish momentum (divergence) is accelerating. As the signal catches up to the MACD, the negative momentum (red lines) troughs and then rises, representing convergence. A buy signal is triggered once the indicator crosses zero, and the green bars confirm a bullish momentum divergence.
Crossovers, trends, and location matter
As I wrote, the crossover of the MACD with the signal will coincide in the bar chart as it crosses zero. That event is a buy or sell signal. There are, however, times when a crossover is a false signal.
It is first necessary to gauge the broader price trend to better differentiate between good and bad signals. In an upward trend, the MACD often oscillates between buy and sell signals while staying above zero.
Similarly, in established downtrends, a series of MACD buy and sell signals can recur while the MACD remains primarily below zero. Signals in a well-established trend can be misleading.
These multiple crossovers tell us that bullish or bearish momentum is wavering but not reversing. However, the trend will ultimately end with a crossover, so consider all other technical indicators with each crossover.
Also of importance is the location of the MACD. Better buy and sell signals often occur from relatively high or low MACD readings. To determine whether a MACD is high or low, I prefer to look back over a two-to-three-year period or longer. However, as a price rises or falls, the MACD range will often follow. A logarithmic-based price or a normalized MACD may be more appropriate for volatile stocks than a standard MACD.
A MACD hovering around zero points to a trendless stock. Ergo, be cautious of buy and sell signals.
Putting the MACD to work
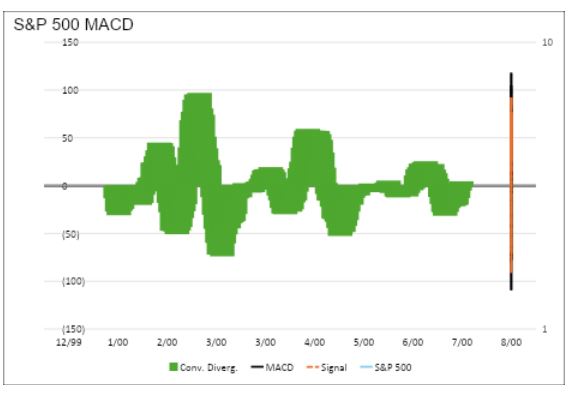
With a better understanding of the MACD basics, I now show a graph of the S&P 500 Index with the MACD, signal, and bar chart to put into action the aspects we discussed. The S&P 500 is on a logarithmic scale to normalize the price changes over time.
- The year-long rally of the S&P 500 has only had two material declines. In both cases (April and July), the MACD became oversold, its bar chart started to change direction, and a good buy signal followed shortly after.
- Besides the two significant declines, the MACD was positive throughout the period.
- In February and March, the MACD and its signal crossed numerous times. Moreover, the MACD was on a downward trend, while the S&P 500 was on an upward trend. This negative divergence between price and MACD warned that momentum was slowing. A similar pattern emerged from late May to mid-July. That divergence also served as an early warning.
- Since early September, a similar divergence has formed. While the setup looks like the prior two declines, other technical indicators and longer-term MACD analysis, as I will share next, can help better assess the current situation. Furthermore, the market narratives on Donald Trump and positive seasonal effects can delay any drawdown for a few months.
Longer-term MACD analysis
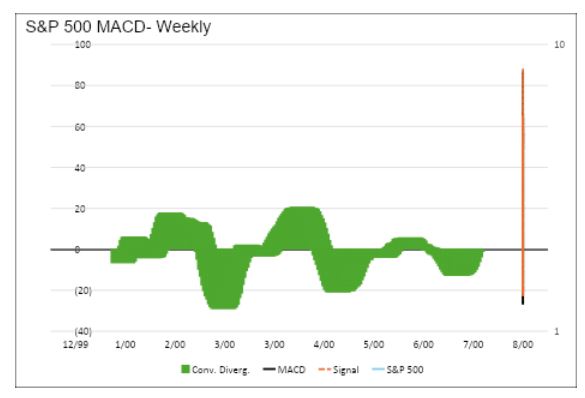
The daily MACD is quick to trigger buy and sell signals, so it often triggers false signals. To help look over some of the daily MACD noise, we also use longer-term weekly and monthly MACDs. While the weekly and monthly MACD signals are often more dependable, they take more time to generate buy and sell signals.
The graph shows that the weekly MACD has given two good buy signals in the last four years. However, the sell signals have been more challenging to trade. This helps highlight why I think using the MACD alongside other technical and fundamental analysis is extremely important.
As shown, the MACD and its signal oscillate in what appears to be a top. These topping patterns can last a while in a bullish trend, so be careful of the current sell signal.
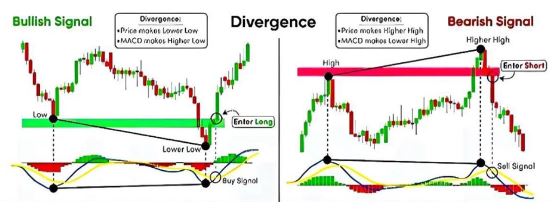
MACD And price divergences
The daily chart shows multiple periods where the MACD steadily declined while the price increased. I noted these instances point to fading bullish momentum.
A longer-term trend change becomes more probable when the MACD peaks or troughs are higher or lower than the prior instance, and the price sets opposing peaks and troughs. Multiple peak/trough divergence warnings are more robust than those based on a singular change in the MACD and its signal line.
The graphic below further highlights what such a multiple price/MACD divergence can look like.
Summary
Fundamental analysis is a vital tool for long-term investment success. However, asset prices are heavily impacted by human emotions and behaviors in the short term. Accordingly, stocks often deviate from fundamentals. It is for this reason that following technical analysis is critical for investors.
Technical indicators and patterns offer a graphical representation of the behaviors that have moved asset prices. They also help gauge the current willingness of investors to buy and sell.
Again, I stress that there is no holy grail of investing. I have found that using as many fundamental and technical tools as possible will not make you perfect but can certainly improve your odds of success. Furthermore – and equally important – they also help to manage the risk of portfolio drawdowns, which is critical for long-term wealth accumulation.
For more information on the MACD and other technical patterns and indicators, I suggest using StockChart's ChartSchool. The site provides excellent and easy-to-read explanations on calculating and using the MACD and many other indicators.
Michael Lebowitz is a portfolio manager with RIA Avisors and author for Real Investment Advice. For more information, contact him at [email protected] or 301.466.1204.
Join RIA Advisors and elevate your career within a deeply experienced team focused on innovation. Our collaborative environment is built on a foundation of advanced technology and effective investment models, designed to enhance your ability to serve clients and grow your practice. Benefit from a supportive culture that encourages professional development and fosters a forward-thinking approach. By joining our team, you’ll be part of a group dedicated to excellence and continuous improvement, empowering you to focus on building meaningful client relationships and pursuing your business ambitions. Discover the advantages of working with our accomplished advisory team by starting your conversation today.
A message from Advisor Perspectives and VettaFi: To learn more about this and other topics, check out some of our webcasts.
Read more articles by Michael Lebowitz
 Advisor Perspectives welcomes guest contributions. The views presented here do not necessarily represent those of Advisor Perspectives.