Advisor Perspectives welcomes guest contributions. The views presented here do not necessarily represent those of Advisor Perspectives.
In my recent piece, “Japan's Lost Decades,” I examined why Japan's GDP is smaller than it was in 1995 and why it took 35 years for its stock market to set its recent record high.
Often, it is said that the U.S. is following Japan's path. That path includes a stagnant economy, massive government debt, and a central bank that must dominate financial markets to keep the economy and financial markets afloat.
There is merit to that opinion. The U.S. government has excessive debt and is increasingly negligent in managing its budget. Also, the nation's economic growth rate has been trending lower for 30 years, and fiscal dominance is becoming the norm, not the exception.
While we may be on a similar path as Japan, we are not nearly as far along, however. There are many differences between Japan and the United States worth considering.
All Asset Bubbles Are Not Alike
Japan's current problems have their origins in the country’s massive real estate and stock bubbles that popped in 1989.
To appreciate the enormity of these bubbles, consider the following bullet points from Ben Carlson's article, “The Biggest Asset Bubble In History”:
- From 1956 to 1986, land prices in Japan increased by 5000%, even though consumer prices only doubled in that time.
- By 1990, the Japanese real estate market was valued at 4x the value of real estate in the United States, despite being 25x smaller in terms of landmass and having 200 million fewer people.
- Tokyo itself was on equal footing with the U.S. in terms of real estate values.
- The grounds on the Imperial Palace were estimated to be worth more than the entire real estate value of California or Canada at the market peak.
- There were over 20 golf clubs that cost more than $1 million to join.
- In 1989, the P/E ratio on the Nikkei was 60x trailing 12-month earnings.
- Japan made up 15% of world stock market capitalization in 1980. By 1989, it represented 42% of the global equity markets.
- From 1970-1989, Japanese large-cap companies were up more than 22% per year. Small-caps were up closer to 30% per year, for 20 years!
- Stocks went from 29% of Japan's GDP in 1980 to 151% by 1989.
- Japan was trading at a CAPE ratio of nearly 100x, which is more than double what the U.S. was trading at during the height of the dot-com bubble.
The aftershock could have been dealt with in many ways, but at its core, it came down to whether to pay a dear price over a short period, or draw out the costs over decades. Japanese officials elected the latter, saving their banks and relying on massive government spending to insulate the economy.
Over the last 25 years, the U.S. dotcom and subprime bubbles have popped. While economically costly, these bubbles were minor compared to Japan's. Accordingly, when they popped, the economic and financial consequences paled in comparison to Japan's.
U.S. Banking Sector: Healthy and Well-Capitalized
Japan’s real estate and stock bubbles were supported with massive leverage via bank loans. When asset values plummeted, the debt supporting them was often worthless. The banking system would have collapsed if the banks had written off the bad loans. The government aimed to keep the banking system out of harm's way. Essentially, the banks didn't have to recognize the losses. However, the nonperforming loans were still on their books, significantly impeding their lending capabilities.
Further crippling the banks were the BOJ monetary policies that pinned interest rates at zero and below zero for long periods. The result was a flat yield curve. In addition to having a limited ability to lend, BOJ policies severely reduced the financial incentive to lend. Japan's private sector economy could not contribute to growth nearly as much as it might otherwise have been able to do, were the banking sector healthy and incentivized to lend.
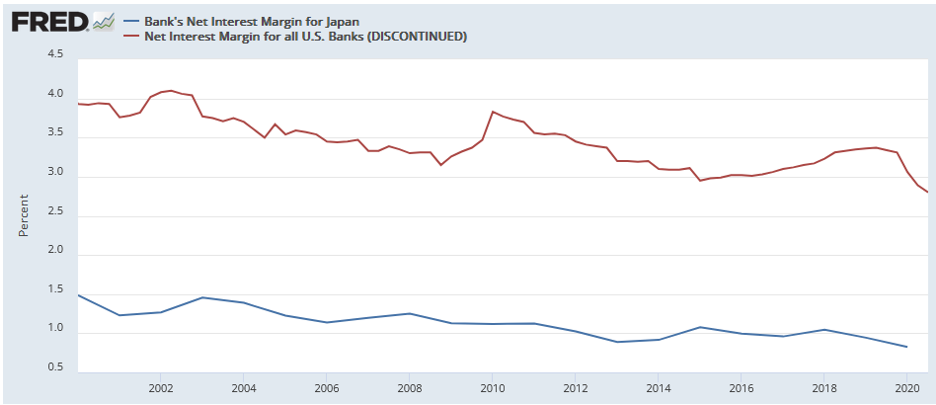
Conversely, U.S. banks are healthy and well-capitalized. Additionally, the Fed is very in tune with the amount of reserves in the banking system, and stands ready to provide more when needed. Reserves are the fodder banks require to make loans.
The graph below compares the net interest margin for Japanese and American banks to show how much more financial incentive to lend versus their Japanese competitors.
Barring a significant financial crisis, there is no reason to expect U.S. banks to be as restricted as Japanese banks have been.
The Pitfalls of State-Led Capitalism
As noted in the prior section, Japanese banks have had a minimal ability to lend for much of the last 35 years. As a result of their zombielike status, a heavy onus was put on the government to promote economic growth. Accordingly, the government has played a much more significant role in managing the economy than is typical in a capitalistic economy.
A key tenet of capitalism states that when the free market sets prices based on the supply and demand for goods and services, it can most efficiently allocate resources to their most productive uses. Commonly, the most productive use of resources benefits economic growth and allows for higher wages and a broad distribution of wealth. Government interference reduces capitalism's value, because capital often will not be put to its most productive uses.
After World War II, Japan followed a path of capitalism, but it was state-led. Such was probably necessary in the decade or two after the war, as the country was physically and emotionally devastated. Japan benefited immensely from the government's push for rapid industrialization and economic development. But through loose monetary policy, financial deregulation, tax incentives, and infrastructure spending, its policies played a crucial role in inflating the real estate and stock bubbles.
After the bubble, the government was called upon to stimulate the economy. Its interference ultimately resulted in the unproductive allocation of resources, which, in the long term, likely reduced economic activity, thereby prolonging their weakness.
The U.S. form of capitalism is not as pure as it could be, but it is not nearly as dictated by the state to the same degree as Japan. The Fed and government do reduce the value of capitalism and certainly foster speculation and leverage. But they have yet to create policies that induce bubbles to the degree Japan saw in the 1980s.
The Yen vs. the World's Reserve Currency
The U.S. dollar is the world's reserve currency, and enormous rewards and complications come with it. In my article, “Our Currency, The World's Problem,” I discussed the value of the reserve currency to the U.S.:
Foreign nations accumulate and spend dollars through trade. They keep extra dollars on hand to manage their economies and limit financial shocks. These dollars, known as excess reserves, are invested primarily in U.S.-denominated investments ranging from bank deposits to U.S. Treasury securities and a wide range of other financial securities. As the global economy expanded and more trade occurred, additional dollars were required. As a result, foreign dollar reserves grew and were lent back to the U.S. economy.
Making the world even more dependent on the dollar, many foreign countries and companies issue U.S.-dollar-denominated debt to better facilitate trade and take advantage of America's liquid capital markets.
The bottom line is that the U.S. has a constant source of capital to fund our debts, support our asset markets, and buoy the economy. The Japanese yen provides no such benefits to Japan.
Demographics and Other Factors
In “Japan's Lost Decades,” I also discussed Japan's demographic challenges. To summarize, Japan has an aging population with low birth rates and a meager immigration rate. These factors and others have resulted in a declining population, which weighs on economic growth. While the United States also faces demographic headwinds that do and will negatively impact economic growth, they are not nearly as pronounced as those in Japan.
The United States has a much larger and more diverse economy. This is in part because we are rich in natural resources. The U.S. economy encompasses a wide range of industries, including technology, finance, manufacturing, agriculture, and services. In contrast, Japan's economy is primarily focused on manufacturing and exports.
Various cultural differences also shape economic policies and affect consumer and corporate behaviors. The business culture in Japan is characterized by lifetime employment contracts and close relationships between corporations and banks (keiretsu). Japan's population emphasizes consensus and harmony. In contrast, the United States has a more competitive culture centered more on the individual than the nation.
Summary
Fiscal dominance, whereby the Federal Reserve must help the Treasury fund its debts at reasonable costs, is upon us. Japan has relied on fiscal dominance for 35 years. This is one of a few clues that the U.S. is on Japan's path.
However, as we have written, our nations have significant differences. While we may be on a similar path as Japan, our paths will differ. Since we have not traveled as far on the path as Japan, we have time to learn their lessons and fix them. Will this happen?
A message from Advisor Perspectives and VettaFi: To learn more about this and other topics, check out some of our webcasts.
Read more articles by Michael Lebowitz