The Pandemic Inflation Rollercoaster – Part Three
Membership required
Membership is now required to use this feature. To learn more:
View Membership Benefits Advisor Perspectives welcomes guest contributions. The views presented here do not necessarily represent those of Advisor Perspectives.
This is part three of a four-part series. Here is Part One and here is Part Two.
Part one of this series led with a graph from Apollo Global Management implying that we are embarking on an inflation rollercoaster for the next 10 years, similar to the experience from 1965 to 1982. Parts one and two explained the causes and remedies for that prolonged inflation outbreak. Part three studies the recent pandemic inflation.
With the history lesson behind us, we move on to the recent inflation that was kicked off by the pandemic. This summary allows us to appreciate better the similarities and differences between now and 50 years ago.
Many governments, companies, and citizens reacted to the pandemic similarly. As a result, our inflation was further amplified by their actions.
We start with two graphs from the San Francisco Fed. The graphs quantify and attribute the sources of inflation to supply and demand side forces. The first graph shows the contributions year-over-year, while the second shows the monthly impacts.
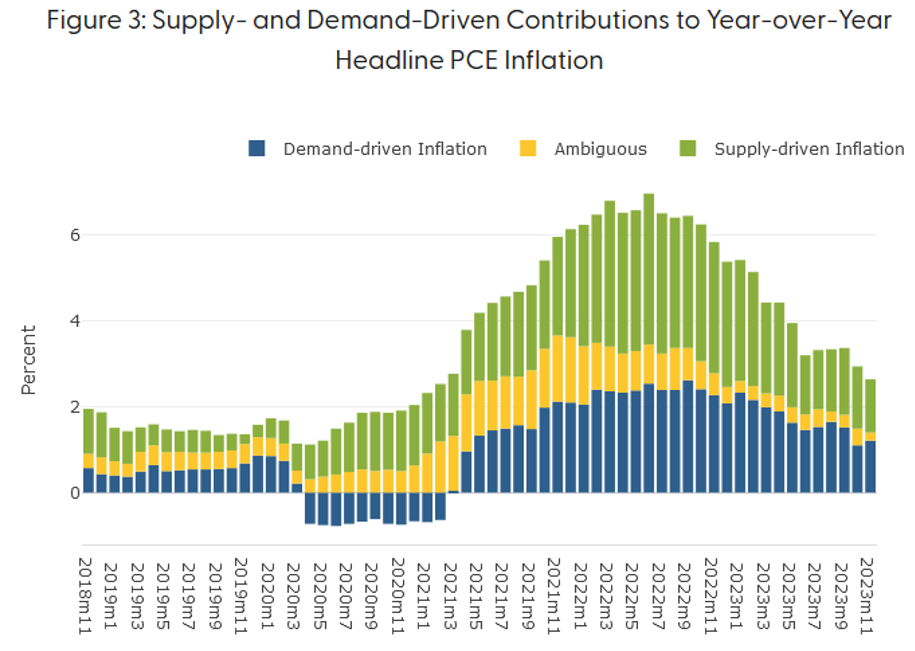
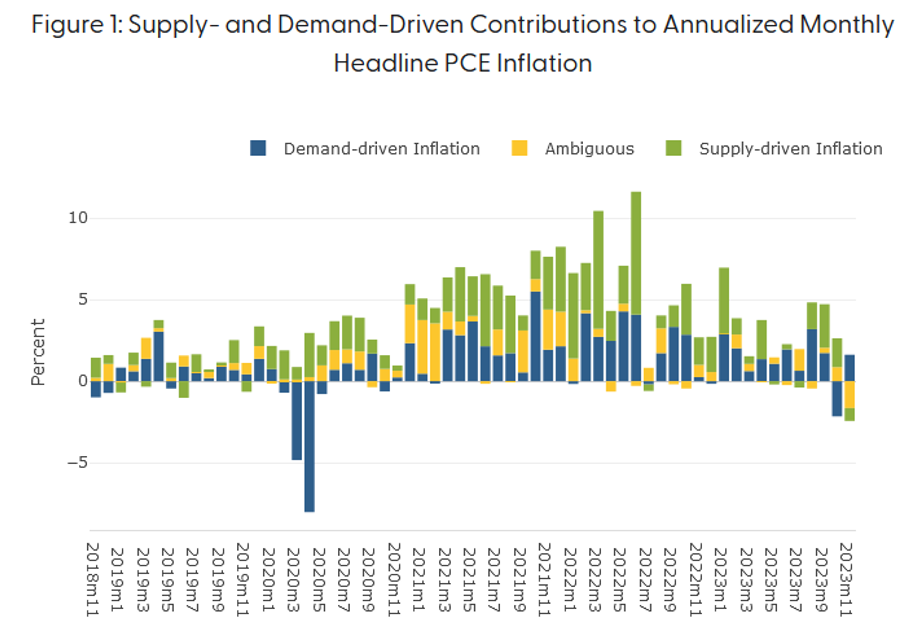
The graphs show that the contribution to inflation was both supply- and demand-driven. Let's now break down the unique supply and demand forces driving inflation.
Supply-side inflation
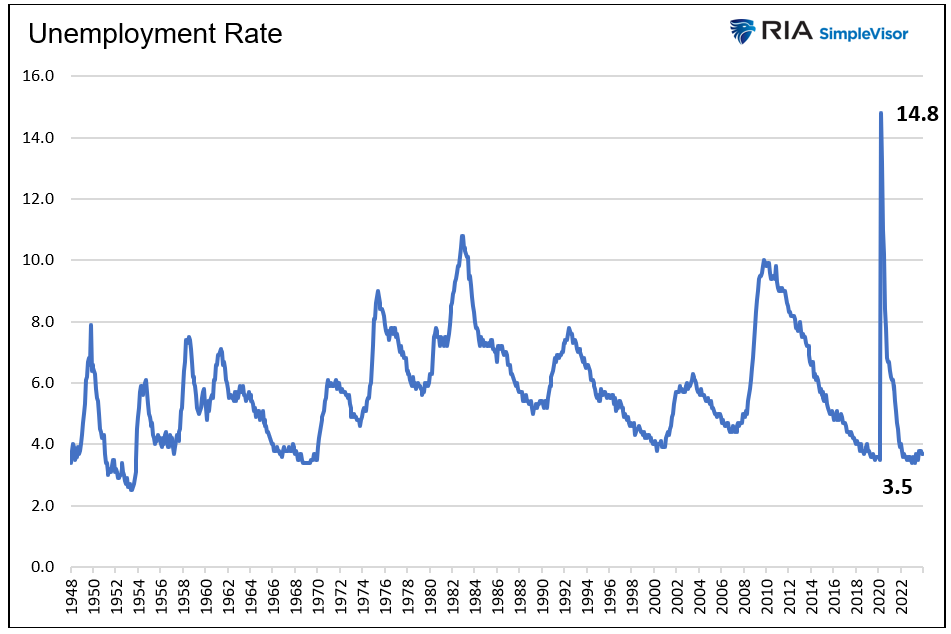
The global economy began shuttering as COVID fears spread worldwide in March 2020. Consequently, the unemployment rate rose from 3.5% in February to 14.8% in April. Not only was the unemployment rate the highest in 75 years, but the speed at which it climbed dwarfed any other period on record.
To stress that point, consider that during the Great Depression, the unemployment rate peaked at 25%, but the increase from single digits happened over four years, not two months.
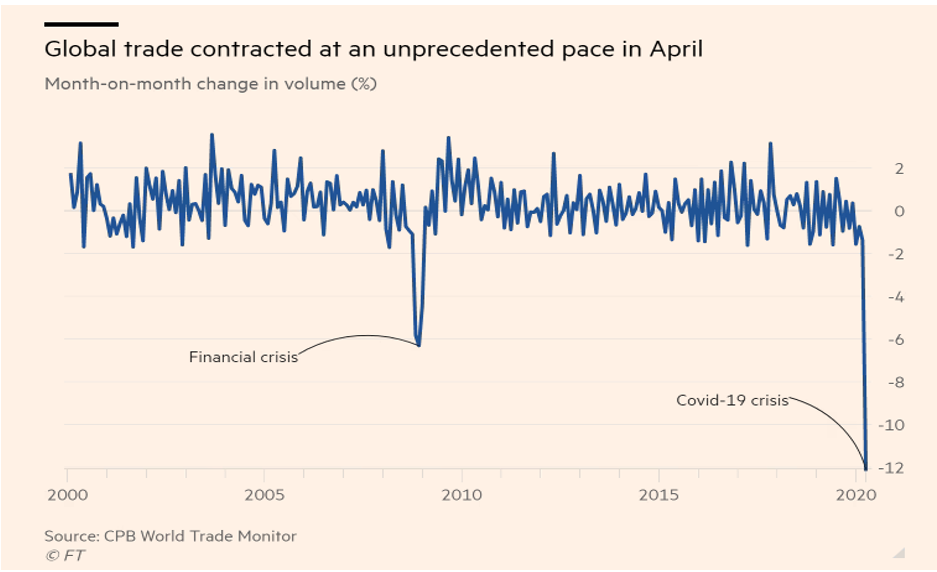
Except for some instances during the World Wars, never in recent history has the U.S. and global economy been as trade restricted. The graph below, courtesy of the Financial Times, shows the extraordinary pace at which global trade contracted.
Auto supply lines decimated
I highlight the domestic auto industry to demonstrate how a lack of production led to inflation.
In April 2020, the U.S. produced a mere 17,100 cars, as shown below. That is less than 10% of the monthly pre-pandemic average of over 200,000. Despite the pandemic, workers returned to the assembly lines relatively quickly, and production picked up rapidly.
But after the initial bounce in production, it started declining again. By mid-2021, new car production was running at half the pre-pandemic rate. This resulted from a shortage of critical chips and other vital components. Like other industries, the auto industry had to limit production due to shortfalls in other sectors.
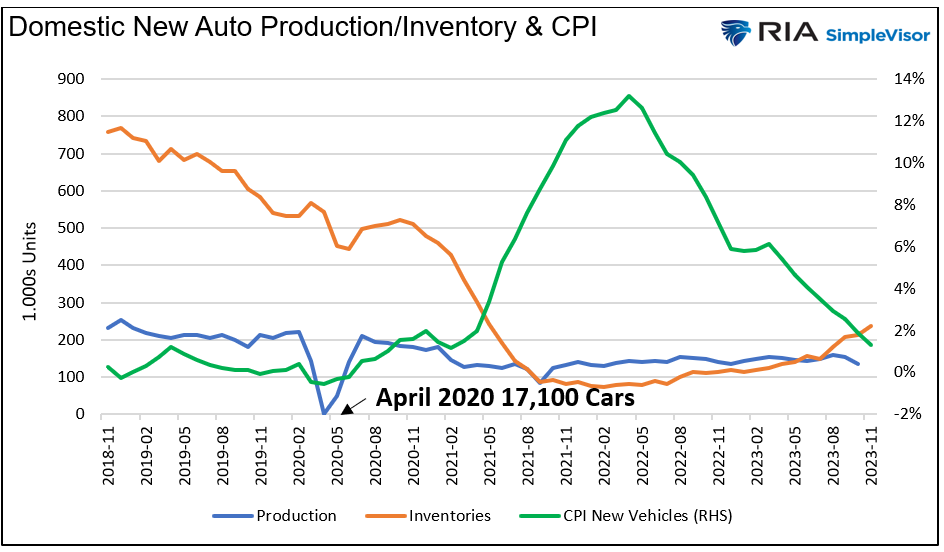
The graph above shows how lessened production severely reduced inventories, thus pushing prices significantly higher. The inventory of new cars fell by over 80% from late 2020 through 2022. To this day, inventories remain well short of pre-pandemic averages. The shortage of chips is also still a problem!
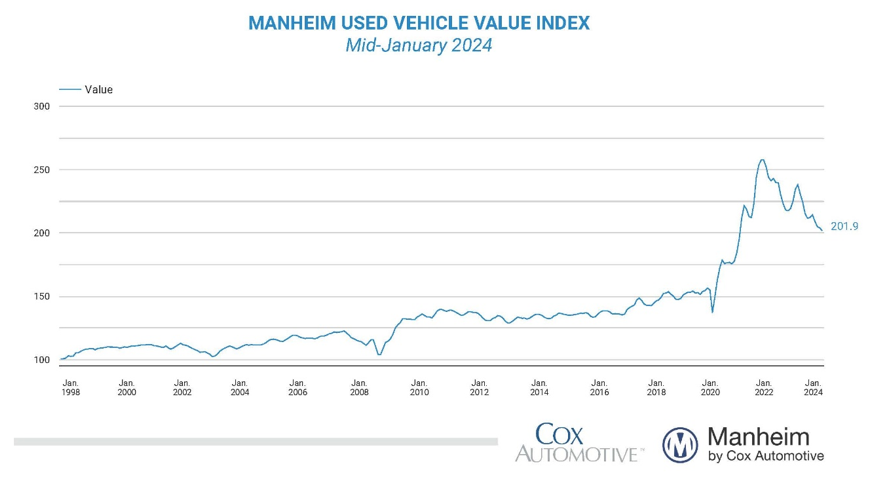
Used cars were heavily affected. With fewer new cars available, those needing a vehicle shopped the used car markets. Demand overran supply, and used car prices soared, as highlighted below. Further dampening the supply of used cars, many used car owners, despite higher prices, were not willing to sell. How would they replace their car?
The auto industry was typical of many industries that experienced severe shortages in units for sale and parts required to make new units.
Demand-side inflation – Behavioral changes
Consumers were shocked when the pandemic started, and typical consumption habits changed drastically. Some people braved going to the grocery store and stocked up on essentials. The activity was like what we often see before significant weather events. Demand for goods online soared. The rapidly changing proportion of goods going to stores versus directly to consumers further distorted supply lines.
Initially, purchases of non-essential goods and most services fell sharply. As shown below, essential goods, like toilet paper, were in high demand.
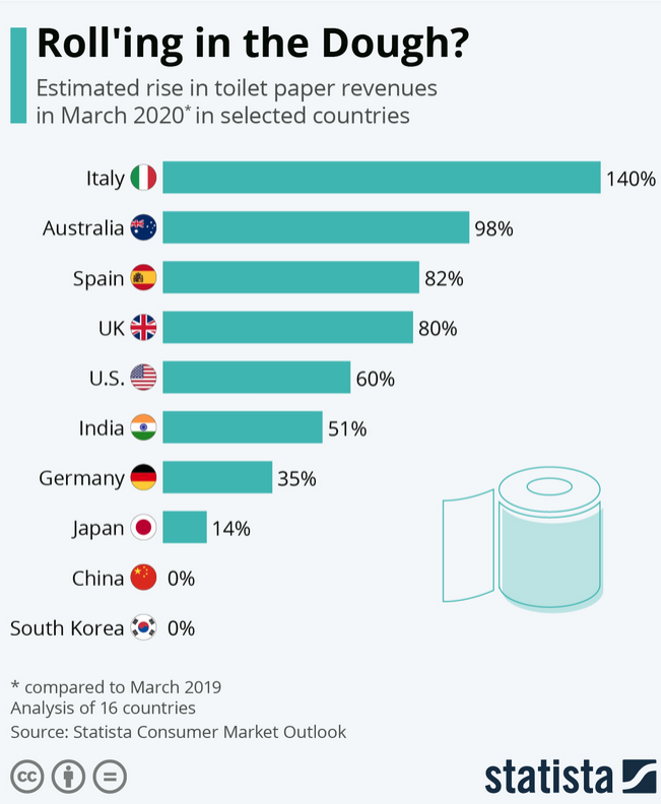
The demand surge led to toilet paper shortages. Producers could not satisfy the increased demand as the production and transportation limitations further impacted the shortage. As I shared with auto production, this is one example of many instances.
As the pandemic became the norm, consumption behaviors started to change. Some people began to consume more than was normal for them. This was driven by increased savings, as I will discuss, and a growing desire to reward ourselves for enduring a painful period.
A you only live once (YOLO) mentality thrived. Somewhat like a near-death experience, those emerging from worry started to spend and live for the day. Some people could shake the fear of covid early, while it lingered for others. Such had the effect of staggering and prolonging demand surges.
Demand-side inflation – Uncle Sam to the rescue
Behavioral changes can be impactful on consumption patterns, but they need to be accompanied by how to consume. For that, we have Uncle Sam to thank. Enhanced jobless benefits, two direct checks from the government, student loan relief, and countless other fiscal benefits supported consumer finances.
For example, consider the third of six pandemic relief packages. The $2.3 trillion CARES Act of March 27, 2020, provided monetary relief as follows:
- One-time, direct cash payment of $1,200 per person plus $500 per child
- Expansion of unemployment benefits to include furloughed people, gig workers, and freelancers
- Additional $600 of unemployment per week
- Waiver of early withdrawal penalties for 401(k)s for amounts of up to $100,000
- Mortgage forbearance and a moratorium on foreclosures on federally backed mortgages for 180 days
- $500 billion in government lending to companies affected by the pandemic
- $349 billion in loans and grants to small businesses through the PPP and the expanded Economic Injury Disaster Loan (EIDL) program
- More than $175 billion for hospitals and healthcare providers
- $150 billion in grants to state and local governments
- $30.75 billion for schools and universities
As a result of record fiscal spending, personal savings soared. Further bolstering savings for some were limitations put upon expenditures such as the closure of restaurants, movie theaters, and cruise lines. As shown below, the rise in savings and the rate at which it was saved was well beyond any prior instance.
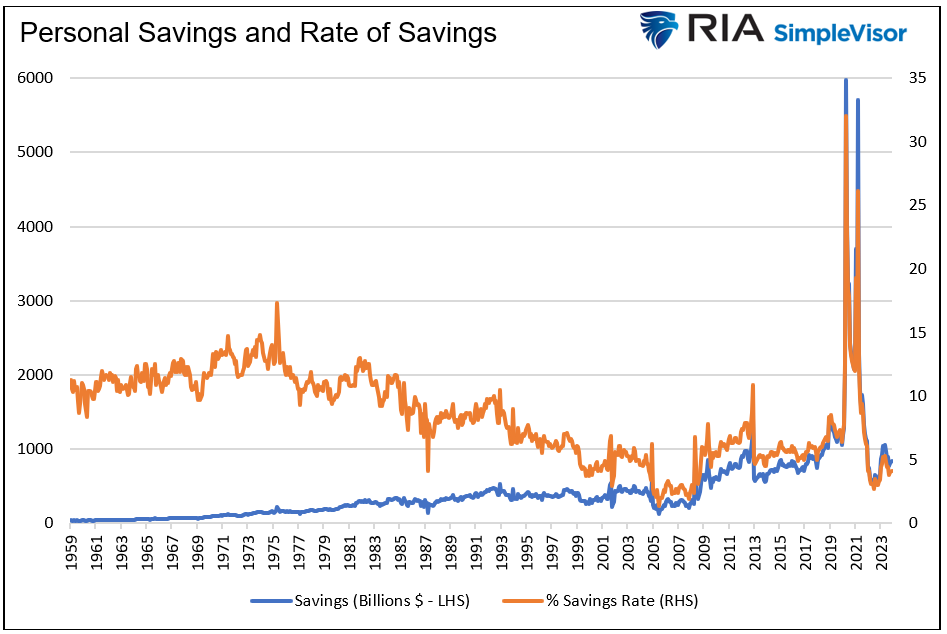
Initially, the increased savings/lower consumption kept inflation low. But shortly after, our bulging savings accounts became fodder for spending. Personal savings are now below pre-pandemic levels, indicating that a large chunk of excess savings has primarily been spent.
The Fed played its part too
Consumption is a function of wealth, financial conditions, and confidence. The following comes from an editorial by Ben Bernanke in the Washington Post:
Easier financial conditions will promote economic growth. For example, lower mortgage rates will make housing more affordable and allow more homeowners to refinance. Lower corporate bond rates will encourage investment. And higher stock prices will boost consumer wealth and help increase confidence, which can also spur spending. Increased spending will lead to higher incomes and profits that, in a virtuous circle, will further support economic expansion.
The Fed flooded liquidity into the financial markets, bringing rates to zero percent and providing ample opportunity for the Treasury to fund massive deficits at dirt-cheap interest rates.
TALF, PPPLF, PMCCF, SMCCF, MSLP, MLF, PDCF, and MMLF were just some of the many programs the Fed reopened from the 2008 financial crisis or created for the occasion. These programs bailed out investors and markets that were on the cusp of failing. Despite a weak economy and high unemployment rate, the S&P 500 hit record highs by October. Consumers had plenty of money in savings and were gaining confidence quickly.
Thank Uncle Sam and Jerome for the inflation
Like the 70s era inflation, the recent inflation outbreak resulted from the government and Fed's not-well-thought-out tactics. Initially, significant monetary and fiscal stimulus was. But blame can be placed on the Fed and government for continuing such tactics well after the economy was rapidly recovering.
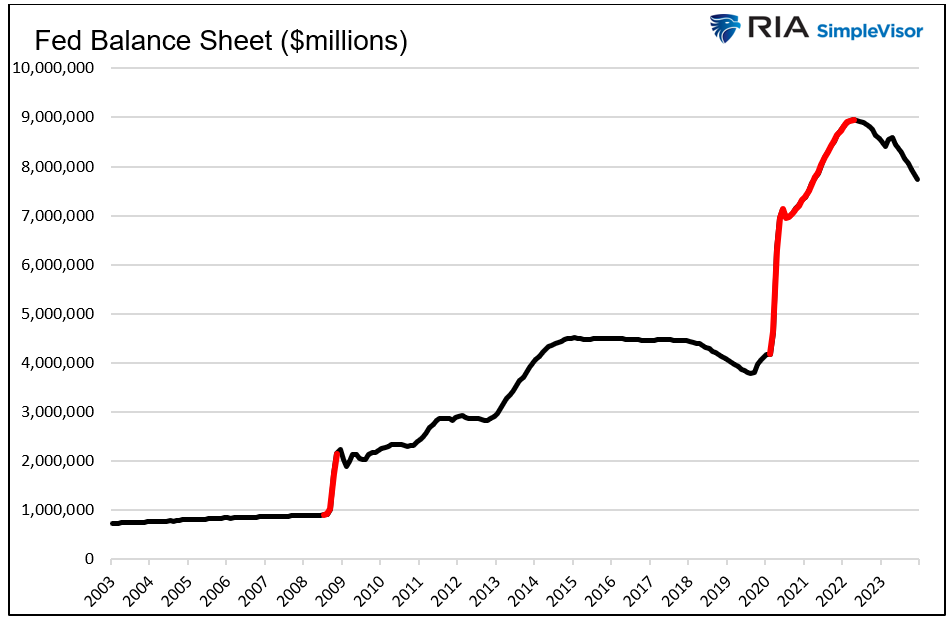
The graphs below help show the amount and duration of the monetary and fiscal stimulus.
Not only did the Fed drop rates to zero and leave them there for over two years, but it bought $5 billion in assets. Such was almost five times what it purchased when the banking system was collapsing in 2008.
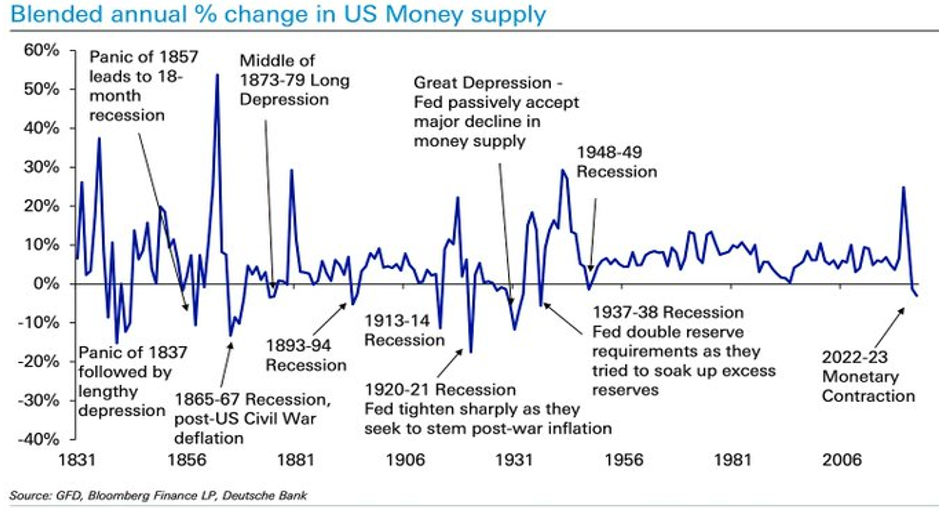
The result was a surge in the money supply, dwarfing that of the 70s.
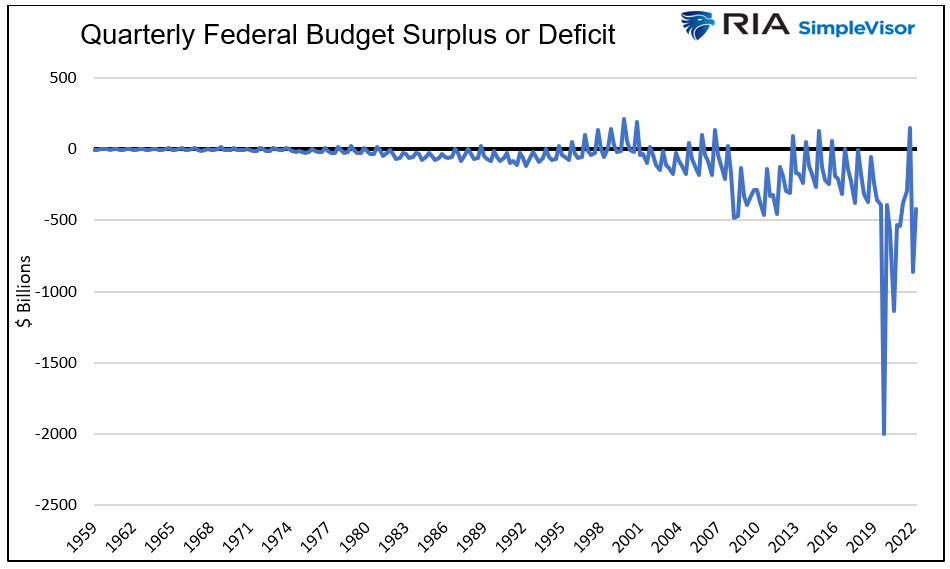
The government kept spending despite a robust economic recovery with quickly rising inflation. The graph below shows the government ran a $2 trillion deficit in just one quarter in 2020. Since then, almost every quarterly deficit has been larger than during the last recession.
Summary part three
The Fed and government turned the liquidity spigots on and were very slow to reduce their flow. The spending provided for a surge in demand. At the same time, production was limited, and supply lines were ailing.
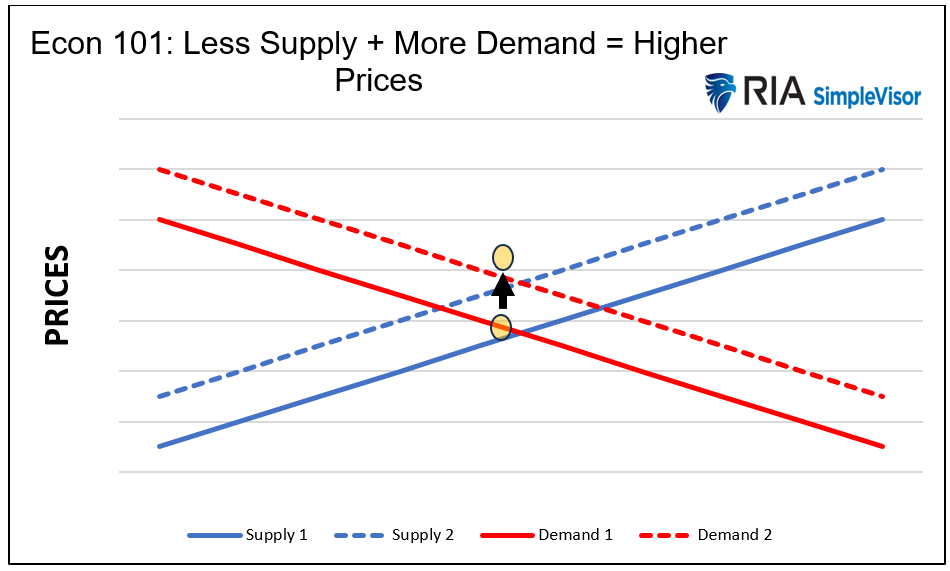
The resulting inflation was due to the Fed's and government's overstimulation and limited supply. Such is the economics 101 textbook definition of inflation.
The trillion-dollar question is how much of the changes in supply and demand were solely due to the pandemic.
With a better appreciation of the causes of inflation in the 1970s and early 2020s, we can finally draw some conclusions about whether more rounds of inflation are likely. With parts one, two, and three in the bag, stay tuned for this series' fourth and final part.
Michael Lebowitz is a portfolio manager with RIA Advisors and author for Real Investment Advice. For more information contact him at [email protected] or 301.466.1204.
A message from Advisor Perspectives and VettaFi: To learn more about this and other topics, check out our most recent white papers.
Membership required
Membership is now required to use this feature. To learn more:
View Membership Benefits