Private Credit is Having a “Golden Moment” – Buy or Sell?
Membership required
Membership is now required to use this feature. To learn more:
View Membership BenefitsAccording to Jonathan Gray, the president of Blackstone, this is a “golden moment” for the private credit asset class. After quoting Gray, the Financial Times’ Robin Wigglesworth noted that “BlackRock’s alternatives investment supremo, Edwin Conway, is ‘confident about (its) future’.1 Apollo’s Marc Rowan sees ‘a good time for the private credit product set’." Scarcely concealing his disdain, Wigglesworth closes by saying, “Another day, another asset manager jostling for a bigger slice of the investment industry’s hottest neighbourhood.”
All this excitement and hype has usually – OK, almost always – meant trouble for the asset class being discussed. I’m a generation older than Wigglesworth, so I’ve experienced golden moments for more asset classes and strategies than he has: small-cap stocks, oil stocks, real estate, gold, portfolio insurance, Japan, China, mortgage-backed securities, hedge funds, private equity, and tech circuses #1 and #2.
These booms didn’t all end in ashes, but the odds are not good. Now comes private debt, smartly rebranded as private credit (doesn’t that just sound better?) and packaged into funds aimed at retail investors, whom I define as those with $10 million or less in investable assets. These are typically people who are saving for retirement or already retired, and for whom a large drawdown would mean hardship, not just inconvenience.
The private credit boom is not ephemeral or a niche phenomenon. According to The Wall Street Journal, it is a major secular trend: “A boom in private credit has been moving a huge portion of corporate borrowing away from public view, taking it from the world of banks and the bond market and into the more opaque realm of private funds.”2 Private credit funds now manage about $1.4 trillion, which is expected to grow to $2.3 trillion by 2027.3
Those high yields – a riddle wrapped in a mystery inside an enigma
So – should retail investors partake of the very attractive yields promised by private credit fund managers?
First, let’s see if we can figure out what the yields are. Winston Churchill’s famous description of the Soviet Union in 1939 – a riddle wrapped in a mystery inside an enigma – applies here. Look at Exhibit 1, which shows data for six private credit funds.4
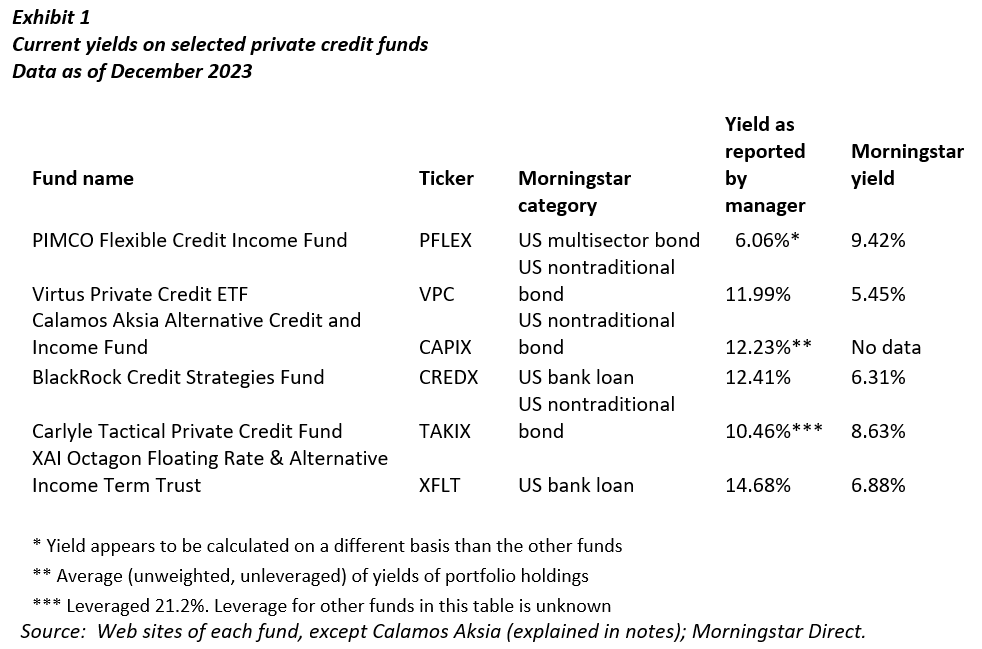
The manager-reported and Morningstar yields are completely unrelated. They are not even of the same order of magnitude. They are not rank-ordered in anything like the same way. The two sets of numbers seem to come from different planets. So, let’s dig deeper.
Yields as reported on the fund websites
The “manager-reported” yields are extraordinary and would tempt even a cynical investor like me – surely not all these large payouts will be offset by future defaults! Let’s look at the choices facing a fixed-income investor: Treasury bonds yield 4.26%, AA-rated bonds 4.94%, and high-yield bonds 8.05%.5 The average of the manager-reported yields on private credit is 11.31%, more than three percentage points higher than “junk.”
While today’s publicly traded high-yield bonds do not quite deserve the junk moniker they acquired in the 1980s, they are far riskier than any other widely held bond category.6 High-yield bond yields spiked from 5.02% before the COVID crash of 2020 to 11.38% at the bottom, causing the prices of those bonds to fall by 20.5% over that unfortunate period, compared with a 31.8% loss for the S&P 500. Worse yet, high-yield bonds fell 34.9% in the global financial crisis of 2007-2008.7
These results show that a publicly traded high-yield bond is more stock than bond when times get tough. Yet the manager-reported private credit yields shown in Exhibit 1 are, on average, more than 300 basis points higher than high-yields, almost as large a spread over high-yields as that of high-yields over Treasuries.
Thus, if risk is related to return, which it surely must be on average over time, private credit must be very risky indeed (despite the smoothing of apparent return caused by the absence of market prices). There’s no other plausible explanation for borrowers having to pay that much for money.
Okay, there’s one other possible explanation – what economists call a free lunch, a source of alpha that can be exploited for a long time before market participants arbitrage it away. A mispricing. That appears to be the sales pitch for private credit: Those managers, and other comparable managers, can identify borrowers who can pay the loans back but who have to pay interest rates ordinarily charged to borrowers who probably can’t.
Morningstar yields
The yields as reported by Morningstar, in comparison, are much more down-to-earth – so much so that three of the five funds for which we have Morningstar data have yields below that of the high-yield bond index. The other two are just above it. I am not tempted by these very ordinary-looking yields. Are you? I’d rather buy liquid bonds or bond funds.
Manager-reported and Morningstar yields compared
Which set of yields is correct? They probably both are. (No one is questioning the managers’ or Morningstar’s honesty or competence.) It’s just that they represent very different conceptions of “yield.” They have to, considering the size of the numerical differences.
Morningstar calculates yields on funds as one would calculate the dividend yield on a stock: “Annual income (interest or dividends) divided by the current price of the security. This...represents the return an investor would expect if he or she purchased the [security] and held it for a year [if the security price did not change].” Asked about private credit funds, a Morningstar representative added, “We calculate current yield at a fund level by aggregating the asset-weighted current yields of the holdings of the fund.”
I do not know how the manager-reported yields were calculated, but one way to get numbers in this much higher range is to divide distributions (not interest or dividends) by the security price. Distributions are the sum of all cash flows from the fund to the investor, including interest, proceeds from loan maturations that are not reinvested in the fund, and capital gains if an asset (in this case a loan) is sold before maturity. These last two items, plus any that I might have left out, are not part of the economic rate of return to the investor because they are not a return on capital, but a return of capital.
A fund that returns the originally invested capital to its investors over time through distributions is doing nothing wrong. But this practice will cause the fund to decline in value over time and eventually disappear.
My guess is that return of capital is the reason for the very high manager-reported yields. If this is true, investors should not rely on manager-reported yields in making their allocation decisions. If it’s not true, please tell me and I’ll run a correction. But then I would like to know where Morningstar is getting their low yields.
Ambiguity and opacity in private credit fund yield data
To sum up my concerns about private credit fund yields:
- There are many ways a fund can provide cash flow to an investor, and they are not all economic profit. (Interest paid by a borrower to the fund and then passed through to the investor is a good proxy for economic profit, because such interest payments are intrinsically net of defaults.)
- But cash flow to the investor can represent economic profit. This is the case with the current yield on an ordinary bond.8 In the stock market, cash flow to the investor (dividends plus share buybacks) usually sum to less than the issuer’s economic profit, because the company retains some earnings.
- So, private credit funds have the potential to be like Forrest Gump’s box of chocolates – you never know what you are going to get.
An advisor looking to invest a client’s assets in one of these funds would need to contact the issuer and have them explain the difference between the yields. The advisor should ask whether the yield stated on the manager’s website includes any return of capital and whether it is representative of the expected income return (the return that would transpire if the share price or NAV did not change). One would also need to ask whether the stated yield includes any income from loans that subsequently defaulted.
This ambiguity and lack of transparency is one of the hurdles a prospective investor will face if they include one or more private credit funds in their portfolio. This is not an issue with 1940 Act (mutual) funds and most ETFs.
Fees
How high are the fees? How high is the moon? (I’ll defend the fee structures in a moment.) Look at Exhibit 2, which shows two kinds of expense ratios for the same funds as in Exhibit 1.
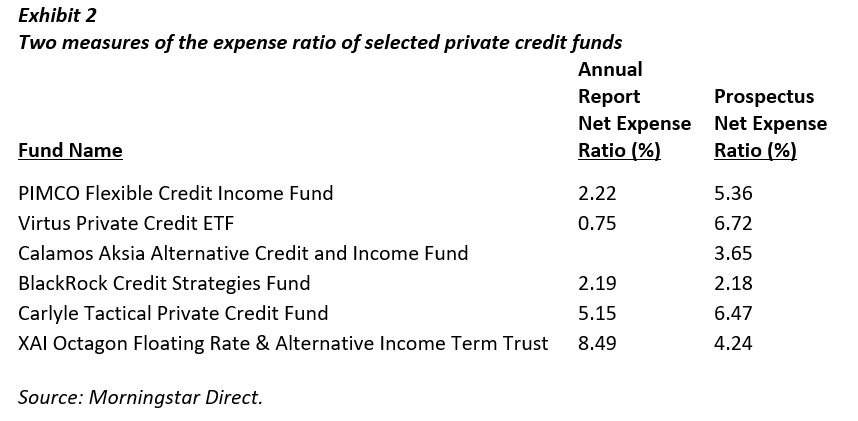
Once again, we have a puzzle to solve. Morningstar writes, “Annual-report expense ratios reflect the actual fees [and expenses] charged during a particular fiscal year, while prospectus expense ratios reflect material changes to the expense structure for the current period.”9
Got that? The first part of the sentence is perfectly clear, but the second part says (to a layman) nothing about how the number is calculated. Because actual fees charged reflect actual experience in the past year, let’s focus on that metric – although the much higher prospectus expense ratios10 suggest the level of fees and expenses that might be charged to the fund in the future.
Investors accustomed to public stock and bond market fee structures may blanch when they see Exhibit 2. But those fees are not necessarily excessive. Direct lending and other lines of business pursued by private credit managers require a lot of in-house expertise. Many high-risk businesses want to borrow the investors’ money; few deserve it. So a team of highly paid experts on lending to risky firms is justified.
Still, the range of expense ratios in Exhibit 2 is large – more than 11 to one! Taking out Virtus’s ETF, which has a low expense ratio because it is an index fund, the range is almost four to one. (The Virtus portfolio holdings are other lenders, so it is best understood as a fund-of-funds with another layer of fees and expenses included in the second column but not the first.)
High fees are part of the alternative-investment landscape, no matter what flavor of alternatives you choose. It’s just the price of admission to the game. At least the private credit funds shown here do not have a performance fee in addition to the “flat” (percentage of AUM) fee.
Performance and risk
Any assessment of an asset class should include historical performance data if such information can be obtained. I was able to obtain total return data for two funds, too small a sample for meaningful analysis. Performance of the two funds was positive over the periods measured. One fund gave a smooth ride upward – if you believe the “marks” – at a compound rate of about 17% per year over the 20 months ending in October 2023; the other had a much more modest return and a bumpier ride, earning just under 4% per year over the 56 months through October 2023. (Note the short track records.)
If you believe the marks. The valuation of private debt, like private equity, relies on appraisal techniques, not market prices. Wigglesworth writes,
If you’re making 12-13 per cent from something, it is very definitely not almost risk-free... Goldman Sachs estimated earlier this year that the reported volatility-adjusted returns of direct lending – the biggest and fastest-growing component of the private credit universe – have averaged 10 per cent annually from 2010 [to] 2022 – and there was not a single down year over that period. That is, if you believe the valuation marks. And it seems that at least some investors are taking them with a pinch of salt.
If we can find private credit funds that trade continuously in the stock market, we can see what the market thinks of the marks and thus of the claim that the funds have very little risk. Fortunately, there’s a sub-asset class, called business development corporations or BDCs, in which all the funds trade publicly. According to Wigglesworth, the reported NAVs (reflecting the valuations or marks) of a sample of 47 BDCs over 2009-2022 had an astronomical Sharpe ratio of 1.73, but he warns that it’s “silly... to use [that measure] in private markets with quarterly marks.”
How silly? The BDCs’ Sharpe ratio was “not far off what Renaissance’s fabled Medallion fund is said to generate.” But the publicly traded shares of BDCs produced a much more modest and believable Sharpe ratio of 0.38 – “significantly lower,” Wigglesworth warns, “than for junk bonds and leveraged loans.”
That ought to give you an idea of the gulf between what private credit investments appear to generate, based on valuations, and what they end up generating for the investor.
Conclusion
Lending to businesses with uncertain ability to pay the loan back is a legitimate business activity. Skilled lenders are likely to find it very profitable and, by setting up a fund and diversifying across different borrowers, may be able to earn returns that justify their high expenses and fees. It is also a natural part of that business to package such funds – what we now call private credit funds – so that people of ordinary means can buy them. Thus, there is nothing structurally wrong with private credit as an asset class. Its returns should be competitive with other asset classes of comparable risk, on average, over time.
There’s the rub – on average, over time. The glory days of any new asset class tend to be early in its evolution. Once a lot of money has poured into the asset class, valuations become stretched and expected returns decrease. That is what has happened with private credit.
I’ve avoided discussing timing because I have long argued that you can’t time the market, except perhaps at extreme (high or low) levels of valuation. But in asset classes with limited capacity and even more limited liquidity, timing based on funds flows has a chance of working. This “golden moment” for private credit does not seem like an opportune time to invest in it. It became golden because of its past returns. With trillions now invested in private credit, its future returns may be much more modest.
Buyer beware.
Laurence B. Siegel is the Gary P. Brinson director of research at the CFA Institute Research Foundation, economist and futurist at Vintage Quants LLC, and an independent consultant, writer, and speaker. His books, Fewer, Richer, Greener and Unknown Knowns, explore ideas in economics, investing, environmentalism, and human progress. His website is http://www.larrysiegel.org. He may be reached at [email protected].
1 https://www.ft.com/content/42297b43-7918-4734-b6d5-623c6d6fa00f
2 https://www.wsj.com/finance/how-risky-is-private-credit-analysts-are-piecing-together-clues-79762038
3 https://www.morganstanley.com/ideas/private-credit-outlook-considerations
4 These are funds for which we were able to obtain data. They are not necessarily representative of the asset class, or the biggest or “best” funds, or anything other than an anecdotal sample. We’d note, however, that two of the private credit funds with the biggest AUM, those managed by PIMCO and Carlyle, are in our list.
5 10-year U.S. Treasury bond; ICE BofA AA-rated corporate bond index; ICE BofA high-yield bond index. Data are as of December 8, 2023 and are from the U.S. Treasury and FRED (Federal Reserve).
6 “Publicly traded” means something different in the bond market than in the stock market. In the stock market it means “traded on an exchange.” In the bond market there are no exchanges to speak of; “publicly traded” simply means that the bonds are SEC-registered and bond dealers report market (transaction) prices on a daily or close to daily basis. Anyone can buy one. Private credit funds and their portfolio holdings need not be SEC-registered, and their individual portfolio holdings cannot be accessed directly by the public. Some market participants avoid using the term “publicly traded bond” in this sense, believing that it is misleading.
7 The -34.9% number is a total return. The period of decline was long (May 2007 to December 2008), so income returns (yields) were a large component of the index total return. Thus the capital loss was much larger than 34.9%.
8 This is precisely true only for a bond selling at par; if the bond price differs from par, then the yield to maturity (which includes expected capital gains or losses from reversion of the price toward par over time) is the right measure of the economic profit an investor earns from holding the bond over a given period.
10 Compared to the annual report expense ratios, the prospectus expense ratios are higher for five funds, and lower for one fund (XAI Octagon).
A message from Advisor Perspectives and VettaFi: The crypto landscape is on the brink of a revolution. Are you prepared for what's coming in 2024? Dive into expert insights on the future of crypto and its influence on next year's market. Join us at the Crypto Symposium on January 12th at 11am ET. Click here to register.
Membership required
Membership is now required to use this feature. To learn more:
View Membership BenefitsSponsored Content
Upcoming Virtual Events View All


