While nonbank loan channels have always coexisted with traditional banking, those channels were historically small niches in the overall economy. That changed after the great recession when new regulations limited the ability of banks to make traditional loans to U.S. middle-market businesses (generally defined as companies with EBITDA, or earnings before interest, taxes, depreciation and amortization, of between $10 million and $100 million and which are considered by many too small to access capital in the broadly syndicated market in a cost-efficient manner). “Shadow banking” emerged with independent asset managers funded by capital from institutional investors, replacing banks as providers of secured, first lien commercial loans.
The growth in direct, middle-market loans originated by asset managers is partly explained by the growth in middle-market private equity. Those loans are referred to as “sponsor-backed.” Private equity sponsors often prefer to borrow from asset managers rather than traditional banks because asset managers offer faster speed, certainty of execution and greater financing flexibility.
Performance update
Each quarter, Cliffwater provides an update on the performance of private loans in its “Report on U.S. Direct Lending.” Its performance analysis relies upon the Cliffwater Direct Lending Index, or CDLI, an asset-weighted index of approximately 13,000 directly originated middle-market loans totaling $284 billion as of June 30, 2023. The CDLI is used globally by institutional investors and asset managers as the index of choice for understanding the return and risk characteristics of U.S. middle-market debt. Launched in 2015, the CDLI was reconstructed back to 2004 using publicly available quarterly SEC filings required of business development companies whose primary asset holdings are U.S. middle-market corporate loans. Importantly, SEC filing and transparency requirements eliminate common biases of survivorship and self-selection found in other industry universe and index benchmarks.
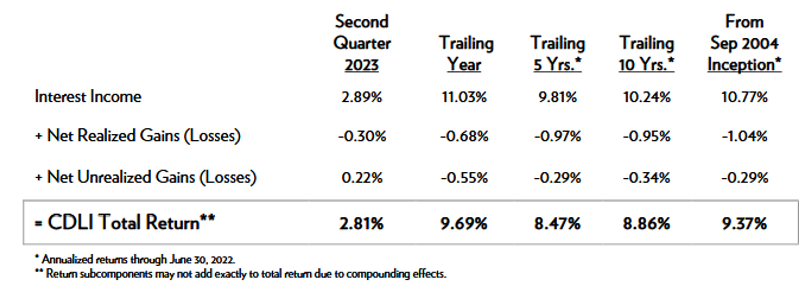
The following table provides performance data for the second quarter of 2023 as well as historical returns:
The CDLI produced a 2.81% total return in the second quarter, bringing the trailing four-quarter total return to 9.69%. Interest income rose to 2.89%, which was somewhat offset by 0.30% in realized losses for the quarter. For the trailing one-, three- and five years, the total return was 9.69%, 8.47% and 8.86%, respectively. And since inception in September 2004, the CDLI produced an annualized total return, unlevered and gross of fees, of 9.37%.
Yield to maturity/current yield
While most direct loans in the CDLI have a five- to seven-year stated maturity, refinancing and corporate actions reduce their average life to approximately three years. The CDLI three-year takeout yield rose from 11.54% on March 31, 2023, to 12.07% on June 30, 2023, due to continued increases in SOFR and modest middle market spread widening. Over the same period, the yield to maturity on the Morningstar LSTA US Leveraged Loan 100 Index rose from 9.48% to 9.68%, and the yield to maturity on the Bloomberg High Yield Bond Index declined from 8.52% to 8.50%.
Credit risk
Second quarter realized and unrealized losses totaled just -0.08%. For the trailing one-, five- and 10-year periods, the total losses were 1.23%, 1.26% and 1.29%, respectively, close to the since-inception loss of 1.33%.
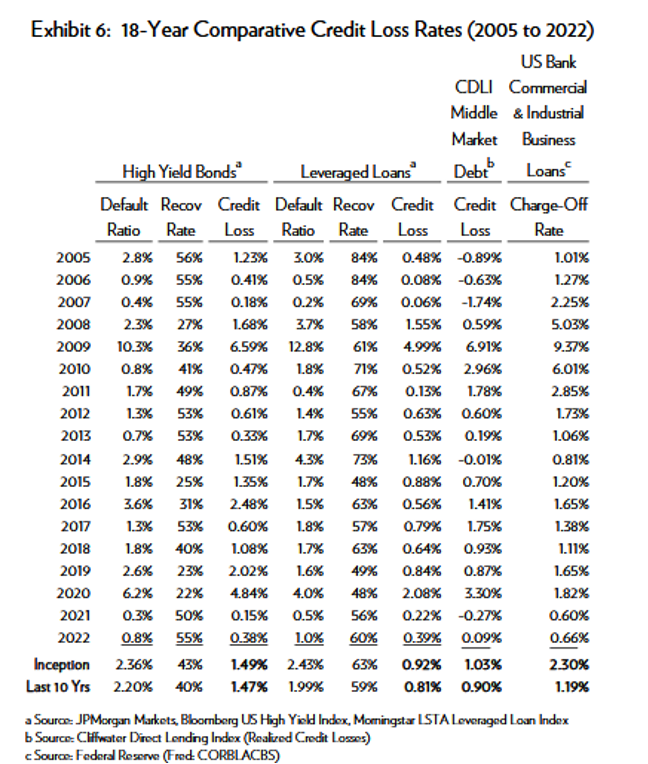
The following table shows the 18-year history of credit losses for the CDLI compared to high-yield bonds, leveraged loans and U.S. bank commercial and industrial business loans:
The exhibit shows that average annual realized credit losses for middle market loans (1.03%), represented by the CDLI, were slightly higher compared to leveraged loans (0.92%) but well below credit losses for high-yield bonds (1.49%) and bank C&I loans (2.30%).
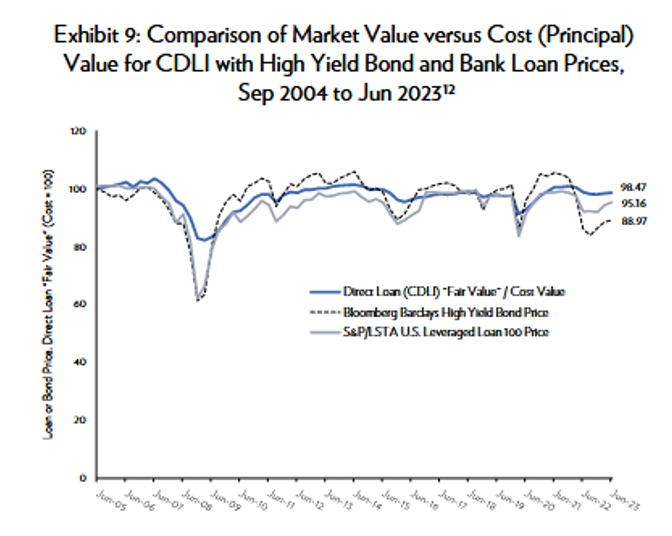
Valuations
The direct loans in the CDLI are valued quarterly using “fair value” accounting rules, while high-yield bonds and bank loan prices are market determined. Despite differing sources for price, the exhibit below shows that direct loan valuation follows the high-yield bond and bank loan markets, though with somewhat less volatility.
Historical returns to the CDLI
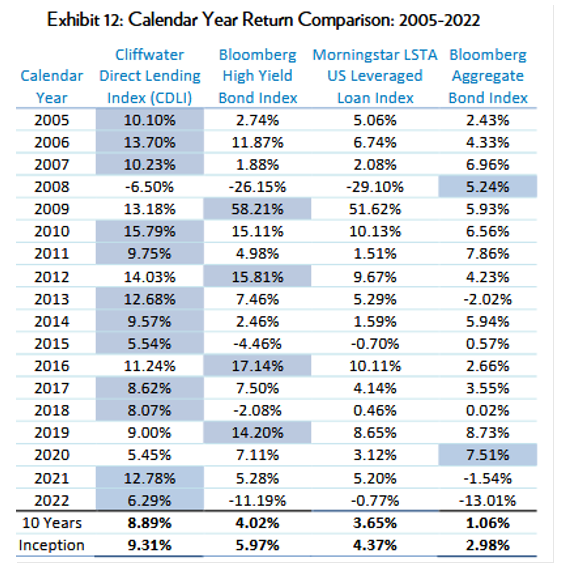
The following exhibit compares CDLI calendar year returns to high-yield bonds, syndicated loans and investment-grade bonds. The asset class with the highest calendar year return is highlighted.
In addition to having the highest return over the last 10 years as well as the entire 18-year period, in 12 of the 18 years the CDLI was the highest performing index.
Senior-only direct loans (CDLI-S)
The CDLI-S is comprised of only senior loans within the CDLI. It was created in 2017 to address the comparative performance of senior middle market loans and the entire universe of middle market loans represented by CDLI. CDLI-S follows the same construction methodology as CDLI but includes only loans held by managers of business development companies that have an investment style that Cliffwater has determined clearly focuses on senior secured loans. Cliffwater generates the same quarterly performance and portfolio data for CDLI-S that is available for CDLI, except that the beginning date is September 30, 2010, for CDLI-S compared to September 30, 2004, for CDLI. The shorter historical series for CDLI-S is attributable to the post-2008 introduction of most senior-only direct lending strategies. As with the CDLI, CDLI-S should not suffer from biases (backfill and survivorship) found in other databases because all source data comes from required SEC filings.
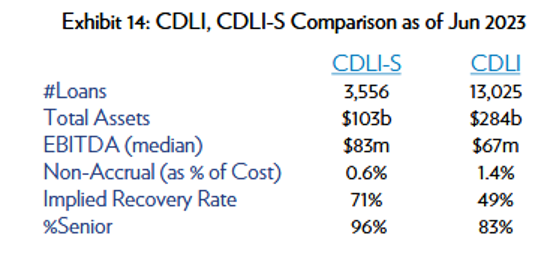
As seen in the table below, loans in the CDLI-S are generally represented by larger, sponsored borrowers with a track record of lower realized losses and a lower rate of nonaccrual status.
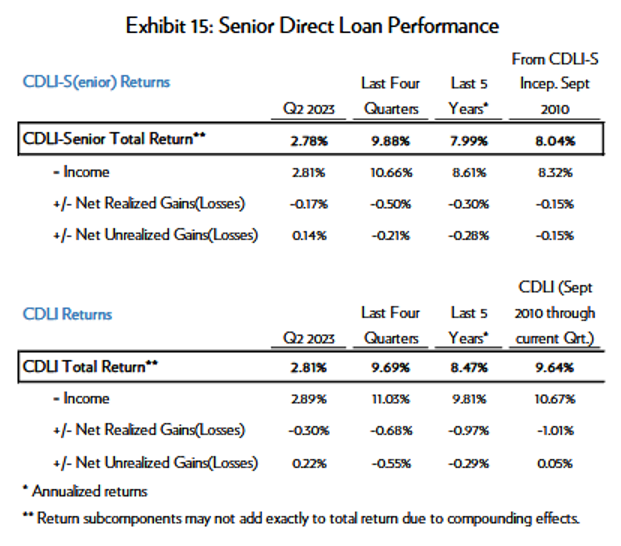
The following tables compares the performance of the CDLI and CDLI-S from the inception of the CDLI-S in September 2010. As you would expect, while the CDLI-S provided attractive returns (8.04%) despite the much lower credit losses, its performance was below that of the CDLI (9.64%), as risk and the ex-post return were related.
Fees
In its 2023 fee survey for investment management services for middle market corporate lending covering 58 of the largest direct lending firms managing $924 billion in direct lending assets, Cliffwater found:
- Management fees and administrative expenses for direct lending private funds averaged 3.94%, up from 3.56% in their 2022 study.
- The 3.94% average of fees and expenses was composed of 1.96% in management fees, 1.50% in carried interest (performance fee) and 0.48% in administrative expenses.
- The 0.38% year-over-year increase in the cost of direct lending was principally due to a rise in reference interest rates and wider credit spreads boosting carried interest charges. Management fees and carried-interest schedules remained relatively unchanged year-over-year.
- The 58-firm study group used 1.12x average leverage, held 87% first lien loans and loaned to borrowers that were 82% sponsor-backed with $74 million in average EBITDA.
- Manager use of portfolio leverage and greater exposure to lower middle market or non-sponsor borrowers were associated with higher fees, while greater exposure to first lien sponsor-backed loans was associated with lower fees.
- Fees (excluding administrative expenses) as a percent of net assets varied considerably across managers, ranging from 2.64% (10th percentile) to 4.32% (90th percentile).
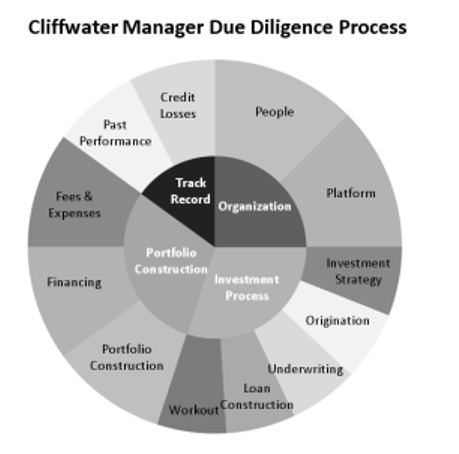
To access the asset class, consider the Cliffwater Corporate Lending Fund (CCLFX) because it compares favorably to the high industry fees. Its expenses are well below those of the average fund, it charges on net (not gross) assets, and it does not charge any incentive fees. Other reasons include a very strong due-diligence process in its manager selection (see chart below), its high credit standards (focusing on senior secured loans backed by private equity firms) and broad diversification across managers with long track records in specific industries.
Performance of CCLFX
From July 2019 through July 2023, the fund returned 8.55% per annum. By comparison, liquid loans, as represented by the SPDR Blackstone Senior Loan ETF (SRLN), the largest fund of its kind with assets under management (AUM) of $4.4 billion, returned 2.90% per annum; the index fund focusing on senior secured floating rate bank loans, Invesco Senior Loan ETF (BKLN) with $3.7 billion in AUM, returned 2.72%; and investment-grade bonds, as represented by the iShares Core U.S. Aggregate Bond ETF (AGG) with $90 billion in AUM, returned -0.96% per annum.
For investors who don’t need liquidity for at least some portion of their portfolio (which is true of most investors), this is a very worthwhile trade – while not exactly a free lunch, it is at least a free stop at the dessert tray. For example, consider the retiree who is taking no more than their required minimum distribution (RMD) from their IRA account. Even at age 90, the RMD is not even 10%, and interval funds are required to meet liquidity demands of at least 5% every quarter. For such an investor, the illiquidity premium is worth considering.
Investor takeaway
Investors seeking higher yields and relatively low risk, and are willing to sacrifice liquidity, will find attractive opportunities in interval funds that invest in senior-secured, sponsored middle-market loans.
Larry Swedroe is head of financial and economic research for Buckingham Strategic Wealth, LLC and Buckingham Strategic Partners, LLC (collectively Buckingham Wealth Partners).
For informational and educational purposes only and should not be construed as specific investment, accounting, legal, or tax advice. Certain information is based on third party data and may become outdated or otherwise superseded without notice. Third party information is deemed to be reliable, but its accuracy and completeness cannot be guaranteed. The mentions of specific securities should not be construed as specific recommendations and time frames are shown with the inception of the CCFLX fund. Indices are not available for direct investment. Their performance does not reflect the expenses associated with the management of an actual portfolio nor do indices represent results of actual trading. Information from sources deemed reliable, but its accuracy cannot be guaranteed. Performance is historical and does not guarantee future results. All investments involve risk, including loss of principal. Neither the Securities and Exchange Commission (SEC) nor any other federal or state agency have approved, determined the accuracy, or confirmed the adequacy of this information. LSR-23-547
A message from Advisor Perspectives and VettaFi: To learn more about this and other topics, check out our most recent white papers.
Read more articles by Larry Swedroe
 While nonbank loan channels have always coexisted with traditional banking, those channels were historically small niches in the overall economy. That changed after the great recession when new regulations limited the ability of banks to make traditional loans to U.S. middle-market businesses (generally defined as companies with EBITDA, or earnings before interest, taxes, depreciation and amortization, of between $10 million and $100 million and which are considered by many too small to access capital in the broadly syndicated market in a cost-efficient manner). “Shadow banking” emerged with independent asset managers funded by capital from institutional investors, replacing banks as providers of secured, first lien commercial loans.