Check the Handicaps of the Morningstar-Rated Funds
Membership required
Membership is now required to use this feature. To learn more:
View Membership Benefits Advisor Perspectives welcomes guest contributions. The views presented here do not necessarily represent those of Advisor Perspectives.
You may be able to add up to 200 basis points of excess returni when a fund’s handicaps are applied as supplemental assessment to Morningstar gold-rated funds.
Fund selection is a complex process. Beyond the suitability aspectsii, there are hundreds of proposed performance measures, third-party metrics, analytical process and due diligence discussions to assess funds. Among them, Morningstar ratings are quite popular as an analytical metric. Given Morningstar’s reputation, even if we assume that they look at all the traditional and some proprietary measures in rating mutual funds, we are still left with more than a handful of similarly rated funds for each asset class. For example, if we use the forward-looking medalist ratings, there are several gold-rated funds from which to choose. If Morningstar ratings are a filtering criterion, how do you incrementally assess all the gold-rated funds?
We propose fund Handicaps as a supplemental assessment datapoint.
As background, in our May 22nd Advisor Perspectives article, we introduced the Advisor Assessment Framework with its three-core metrics:
- Score – shorter-period performance path profile relative to the benchmark, as a risk attitude trend measure;
- Handicap – average longer-period performance path profile relative to the benchmark, as a stable risk attitude measure; and
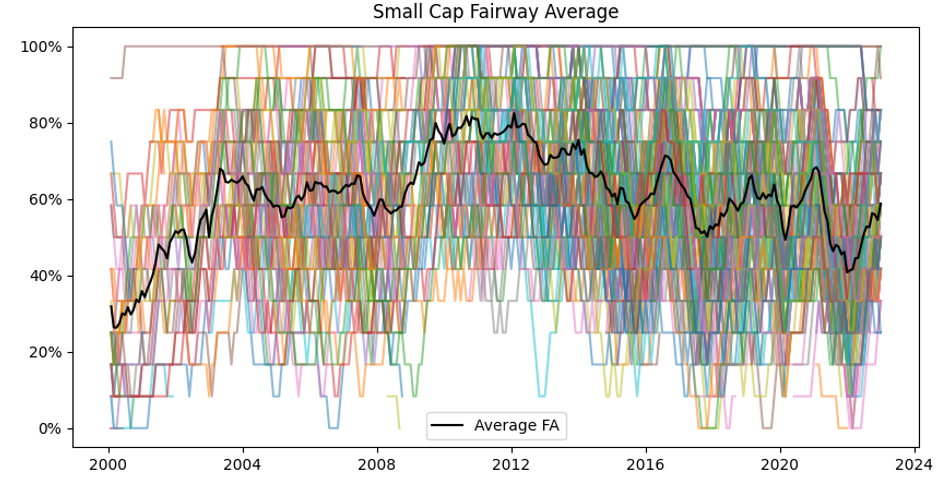
- Fairway average – propensity to take risk relative to the benchmark, as a risk attitude beta measure.
Collectively they provide insights around the asset’s (or advisor-recommended portfolio’s) risk taking as it navigates a benchmark. While the Advisor Assessment measures are meant to complement each other, the final weighting for a measure can depend on the objective.
Morningstar gold-rated funds
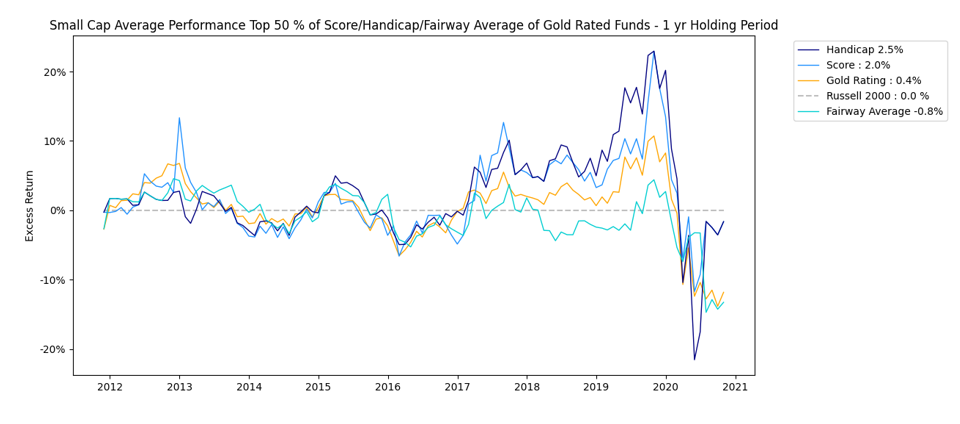
We construct a very simple test and demonstrate results for three equity asset classes – small-, mid- and large-cap mutual funds. Since the allocation to a fund can be made at any time, we evaluate the selection performance on a rolling basis. Every month we take all the funds rated gold by Morningstar and assess their excess performance (versus the relative index) at the end of the investment period (or 1, 2- or 3-years forward). Similarly, we take the same gold-rated funds and apply a filter of the funds that also were in the top 50% of the Advisor Assessment measures for that month and asset class. Then we evaluate their excess performance (versus the benchmark) at the end of the investment period (or 1, 2- or 3-years forward). Our results are based on the averages of all selected funds, where extensions can be applied.
Small-cap mutual funds
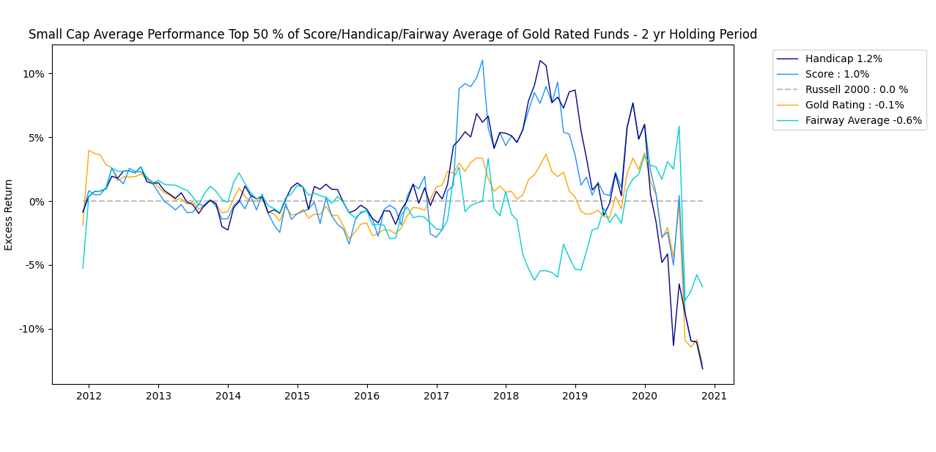
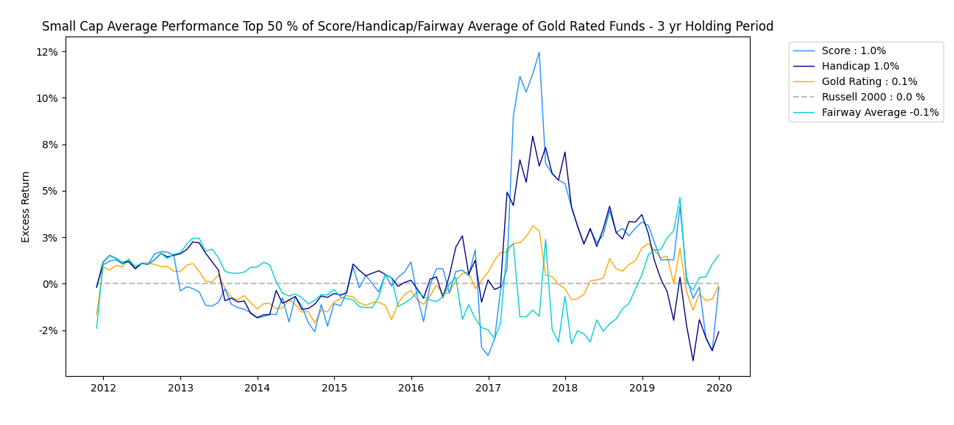
Over the past decade, an assessment of the gold-rated funds shows that the supplemental application of the Advisor Assessment Framework could have added up to 210 bps of excess performance (versus the Russell 2000 as the benchmark) to the unfiltered gold-rated small-cap funds. The illustrations look at the 1-2-3 year holding periods of the funds.
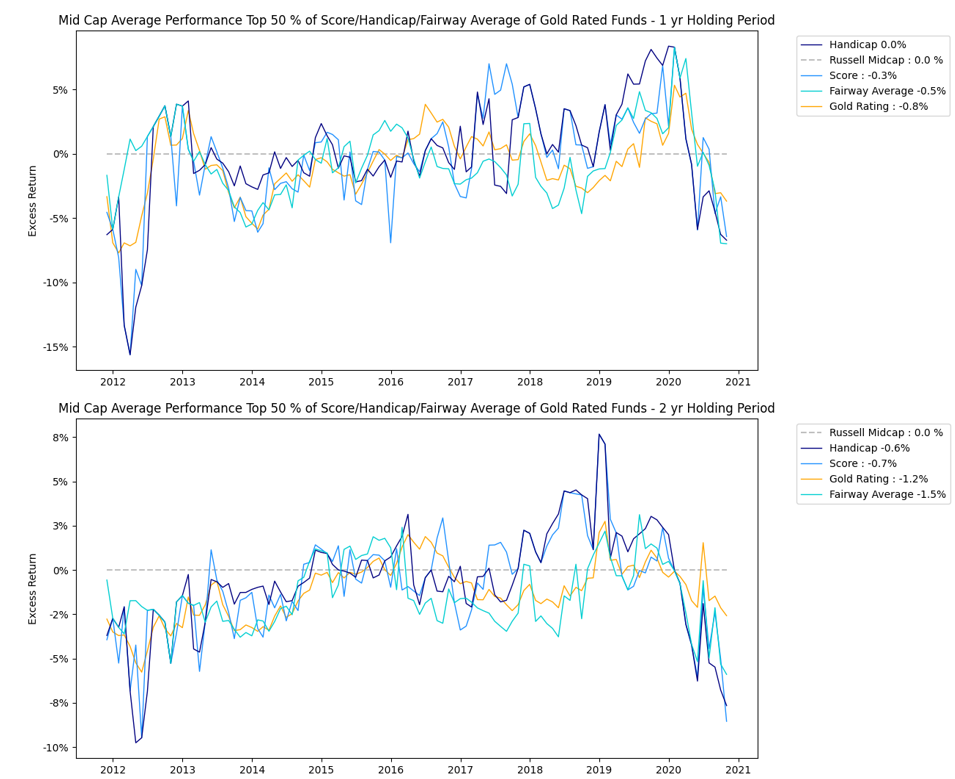
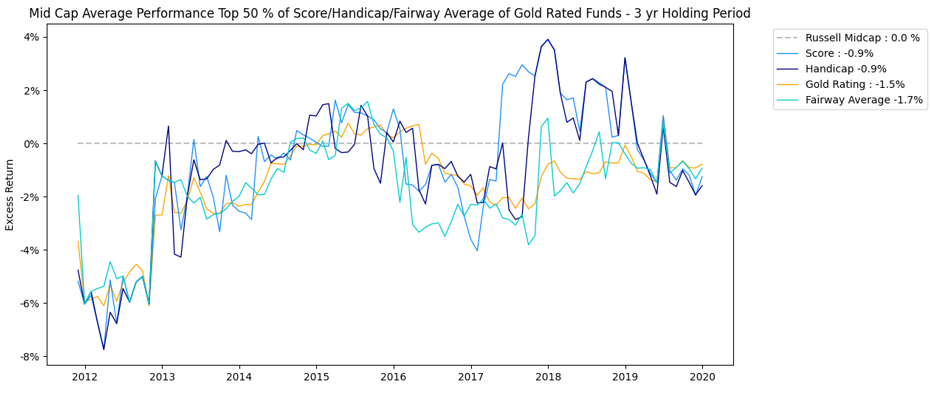
Mid-cap mutual funds
While we demonstrated in our insights piece that for the mid-cap market the index generally outperforms the funds, there are many reasons why a fund may be preferred. Therein, for fund selection, an assessment of the gold-rated funds shows that this application of the Advisor Assessment Framework could have added up to 70 basis points to an unfiltered selection. The illustrations look at the 1-2-3 year holding periods of the funds.
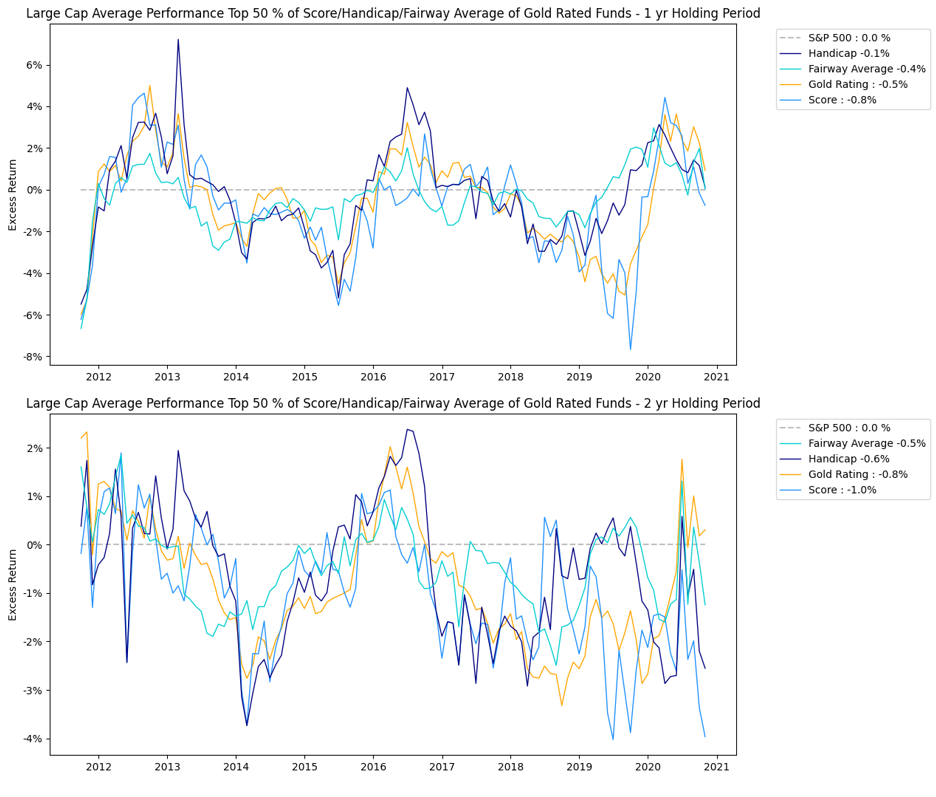
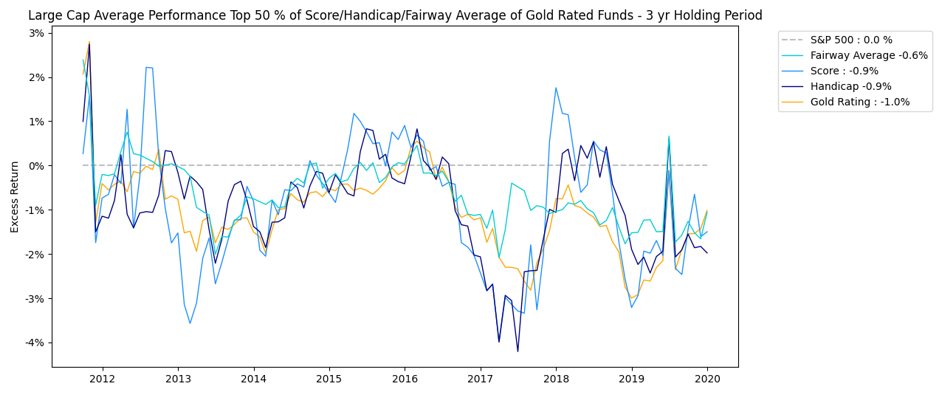
Large-cap mutual funds
While we demonstrated in our insights piece that, for the large-cap market, the index generally outperforms the funds, there are many reasons why a fund may be preferred. Therein, for fund selection, an assessment of the gold-rated funds shows that this Advisor Assessment Framework could have added up to 50 basis points over the unfiltered pool. The illustrations look at the 1-2-3 year holding periods of the funds.
All funds
The Advisor Assessment framework can work as an extension of any asset or portfolio assessment methodology. The illustrations in this section look at how all the mutual funds iii behaved via the Assessment framework lens,
- Point-in-time analysis or simply how did the fund do versus its peers for a particular period. We illustrate results for December 31, 2021 to December 31, 2022.
- Trend analysis or how did the fund do versus its peers over a period of time. We illustrate results for December 31, 2000 to December 31, 2022. Essentially the point in time analysis is conducted on a monthly basis.
We know that not all markets or funds are constructed the same, so the uniform application of the framework across the markets with their respective benchmarks’ levels the playing field. This reveals some very interesting insights into the ability of the funds individually and as a group to navigate their benchmarks. The results are impacted by the years assessed, size of the market, the participants, regimes or the benchmarks. Overall, the results emphasize the importance of fund selection and ability of the framework to profile the risk-taking attitudes of the fund managers.
Market – point in time
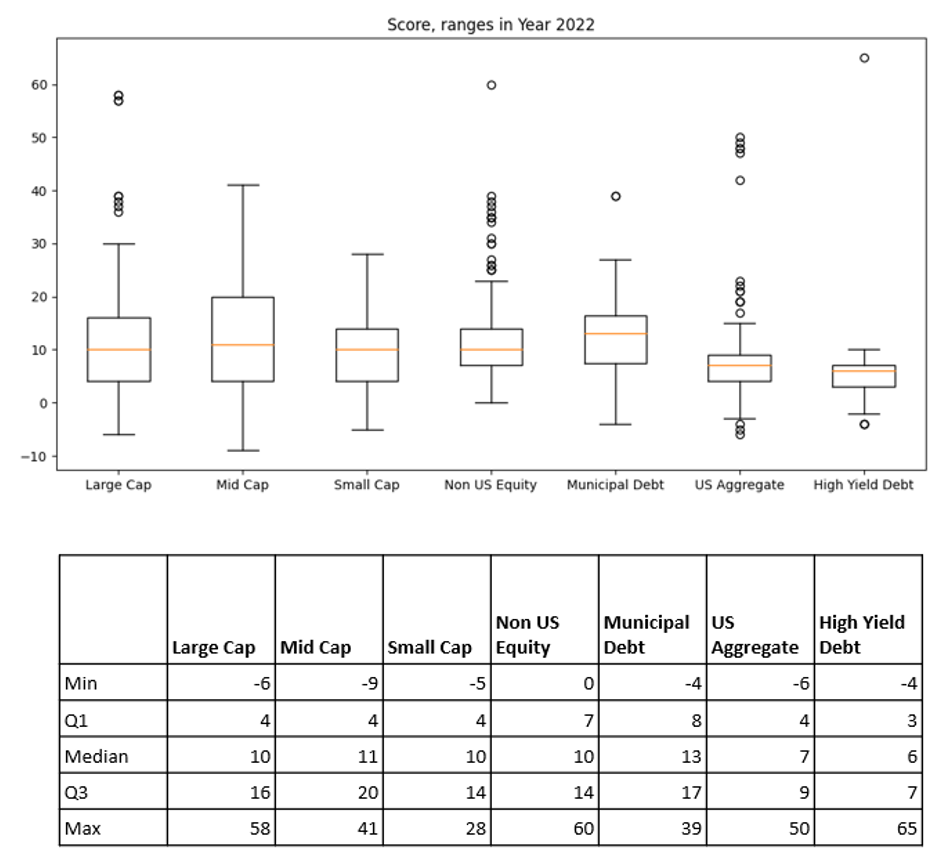
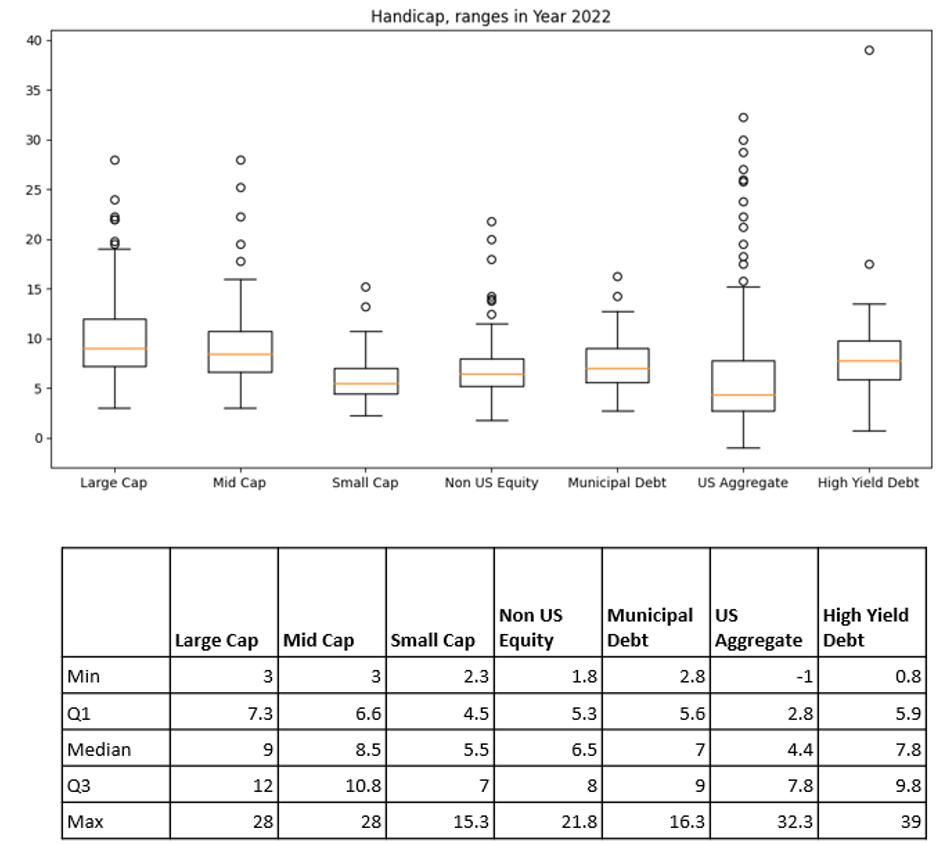
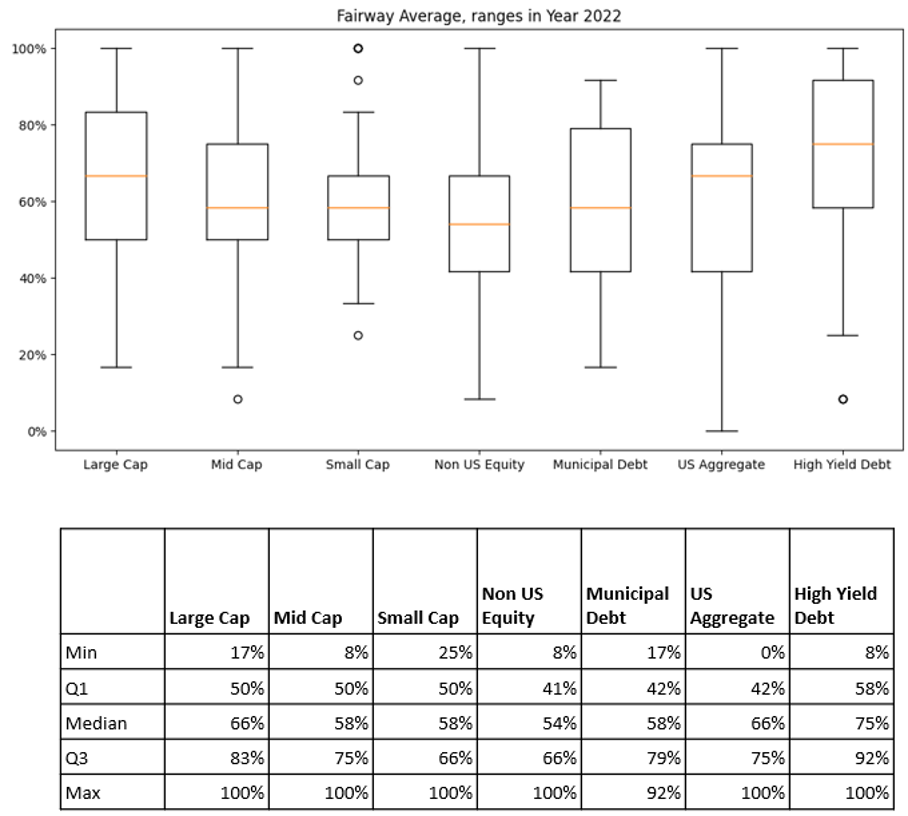
The 2022 point-in-time assessments highlight a wide range of the results for the funds within each of the Asset classes.
Score. This is the 12-month performance assessment and, as with golf, the lower the Score for the fund the better. Given the shorter assessment period, it can be looked at as a risk attitude trend measure. For the year 2022 the Score ranges of the funds across all Asset Classes were quite wide. Additionally, only a few funds performed well when compared with their benchmarks. Looking at the quartiles, the performance range of funds in the equity markets showed the weakest results versus their benchmarks implying that poor manager selection would have been the costliest in Equities.
Handicap. This is the assessment of the fund over a 5 year period as an average of the 2 best and the 2 worst periods so, a stable risk attitude measure. As with golf, the lower the Handicap for the fund the better. Over the assessment period, within the equity markets, the small-cap participants are better handicappers (and thus are better performers versus their benchmarks). Similarly, while the average U.S. aggregate participants are good handicappers, the outliers are also extreme, putting a greater emphasis on fund selection.
Fairway averages. This is a measure of a fund taking more or less risk as also exhibited by greater variability of returns versus the benchmark so, a risk attitude beta measure. For example, a near 100% fairway average would be expected from index trackers. The difficulty in generating alpha in 2022 may highlight why the market participants had relatively high fairway averages.
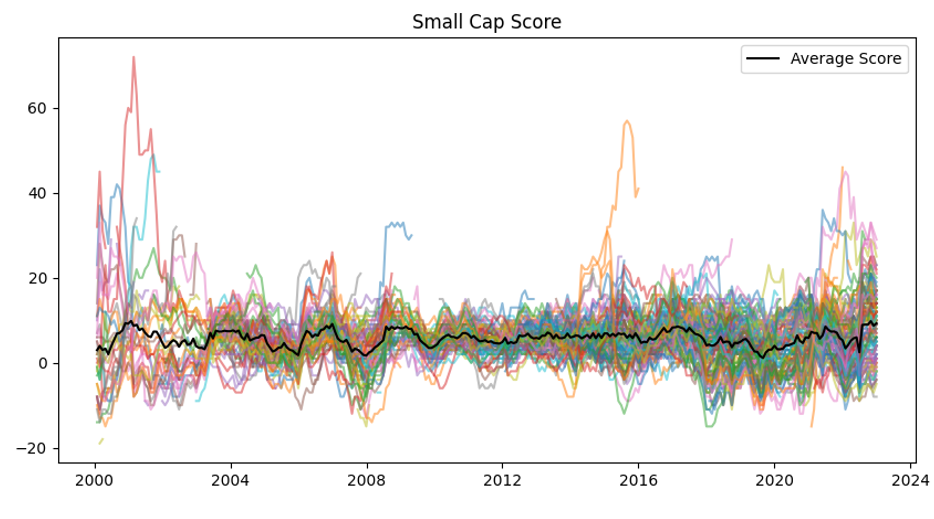
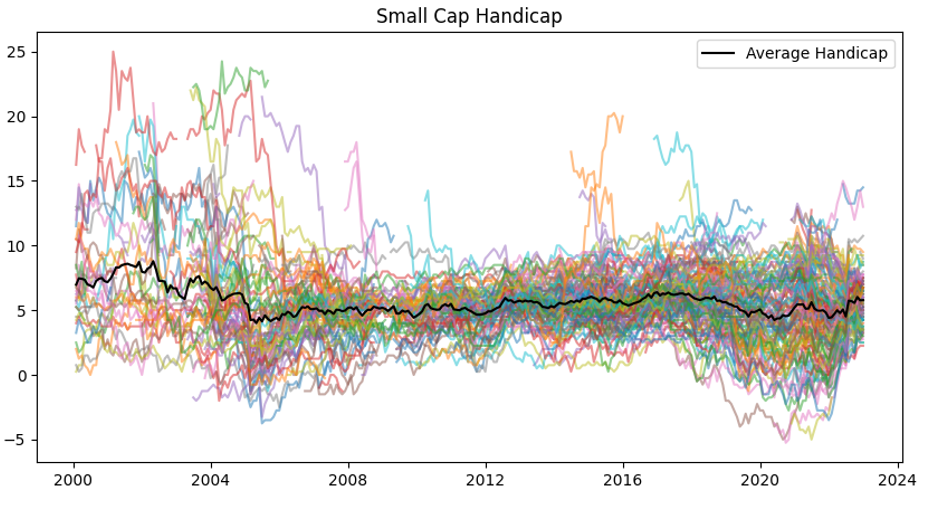
Market – trend
To assess the trends of the measures, we conducted the aforementioned analysis on a rolling basis using monthly data from December 2000 to December 2022. As an example, the assessment of U.S. small-cap mutual funds shows wide ranges for the Scores, Handicaps and Fairway Averages highlighting the relative difficulty of navigating the Index. While the average Score and Handicaps across the funds are somewhat range bound, the Fairway Average shows more pronounced regime or period impacts. Not surprisingly, as the Scores and Handicaps start to trend up the funds stop existing. The relative trends of the Scores, Handicaps and Fairway Averages of the funds give great insights into the path profile (or the over or under) performance of the individual funds versus all the funds within the sector. The relative performance and drifts around fund averages also amplify the risk-taking attitudes of individual funds.
Conclusion
If an index is an all-weather barometer, then from a relative fund-selection perspective, which is most important to you – consistent performance, high alpha, lower volatility, high beta, or positioning during regimes? The Advisor Assessment framework answers this question by generating the performance path profiles and giving you insights into the funds’ ability to navigate the index at comparative points in time. Assessing the Scores, Handicaps and Fairway Averages helps profile the risk attitude of the fund manager as a value-add datapoint for your selection process. For example, the supplemental application of the framework to the Morningstar gold-rated funds added incremental basis points to selection performance.
Handicaps matter. Be careful who you partner with!
Dr. Ali Hirsa is a professor at Columbia University and Satyan Malhotra is the CEO of ASK2.AI, a FL-based research and technology company. In the technical paper iv, we provide detailed financial engineering and mathematical nuances for setting up the framework and give numerical examples for all mutual funds, ETFs and sample portfolios.
i Disclosure: there is no guarantee that the Morningstar ratings or Advisor Assessment framework would pick the appropriate funds and past performance may not be an accurate predictor of future performance. Readers should do their own diligence.
ii We assume that the other elements of Risk Management, Compliance and other suitability concerns/restrictions have been processed.
iii Evaluation Period from 1994-12-31 to 2022-12-31. Evaluated funds that were at least 3 years old and had over $1bn+ AUM as of 2021-12-31, which results in 455 large cap funds, 136 mid cap funds, 139 small cap funds, 176 Non-US equity funds, 184 US Agg funds, 63 Municipal Debt, and 50 US high-yield debt funds . Benchmarks: S&P 500 for US large Cap, Russell Mid Cap for mid cap, Russell 2000 for small cap, MSCI EAFE for Non-US equity, Bloomberg US Agg Bond Index for US Agg the Asset, Bloomberg Municipal for municipal debt, BBG US Corporate HY for US High-yield Debt
iv For the technical paper and study, please refer to https://ssrn.com/abstract=4436113
Membership required
Membership is now required to use this feature. To learn more:
View Membership BenefitsSponsored Content
Upcoming Virtual Events View All


