Are Tech Stocks in a Bubble?
Membership required
Membership is now required to use this feature. To learn more:
View Membership Benefits Advisor Perspectives welcomes guest contributions. The views presented here do not necessarily represent those of Advisor Perspectives.
Tech stocks are not in a bubble for two reasons. Not all stock price booms result in busts, and fundamentals and valuations do not suggest a tech bust is imminent.
This is part I of an analysis of whether tech stocks are in a bubble. Here I discuss whether large price run-ups in stocks are necessarily followed by large declines. (They are not.) In part II (to appear next week), I will look at the fundamentals and valuations of the tech sector as of mid-2023 to see whether a rational evaluation of the evidence suggests U.S. tech stocks are in a bubble. (It does not.)
Setting the stage
After a rough 2022, technology stocks have had a heck of run in 2023, leading to the inevitable speculation about whether we’re headed for a new stock market bubble in tech. Some have gone from speculating to asserting that the bubble is already here. Let’s define a “bubble” as a large but unjustified increase in the price of an asset, like a stock (or a tulip). To detect bubbles before they burst, we therefore need to identify cases of large price increases or booms (easy) and then determine that they are unjustified (hard).
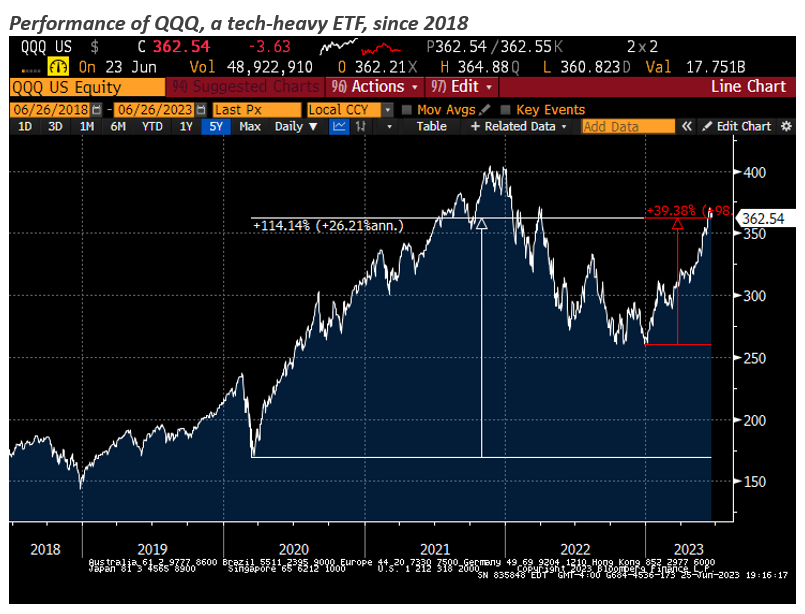
The above chart shows the performance of the QQQ exchange traded fund, a very liquid ETF which tracks the performance of the tech-heavy Nasdaq 100 index. Past work on bubbles (more on this below) identified booms as cases of price run-ups that were above 100% over the span of a few years. Based on this criterion, the tech stocks rally of 2023 does not qualify because the price increase has only been 39%. If we look back to the depths of the COVID-19 stock market lows of 2020, and begin counting at that point, then QQQ is up 114% over three years, which does satisfy the 100% run-up rule.
The bubble argument requires us to start at a clearly depressed market valuation, but let’s give the bubble forecasters the benefit of the doubt, and start our analysis in March of 2020, the low-point of the stock market during COVID-19. We next need to address two questions:
1. What is the historical association between large price increases and futurestock returns?
2. Is the current price run-up in tech stocks unjustified? For example, can anticipated earnings growth justify the price increase? Or are stock valuations at such extreme levels to justify bearish forecasts?
To address the former, I rely on some excellent academic work that has tackled this question. For the latter, I rely on work done by my firm, QuantStreet Capital, which models how anticipated stock returns depend on past price trends and industry and macro fundamentals. (This will appear in part II of this analysis.)
Price run-ups and future returns
Will Goetzmann of Yale University wrote a paper a few years back where he analyzed the impact of stock-price booms at the level of individual countries’ stock markets. His data covered the returns of 21 global stock markets starting in 1900 and going through 2014. One definition of a stock-price boom in his paper was if a country’s stock market went up by 100% or more over a three-year period. Given the price action in QQQ since 2020, this is an apropos definition. The next table, taken from his paper, summarizes the behavior of country-level stock returns in the year following a boom (i.e., a three-year period in which the stock market doubled).
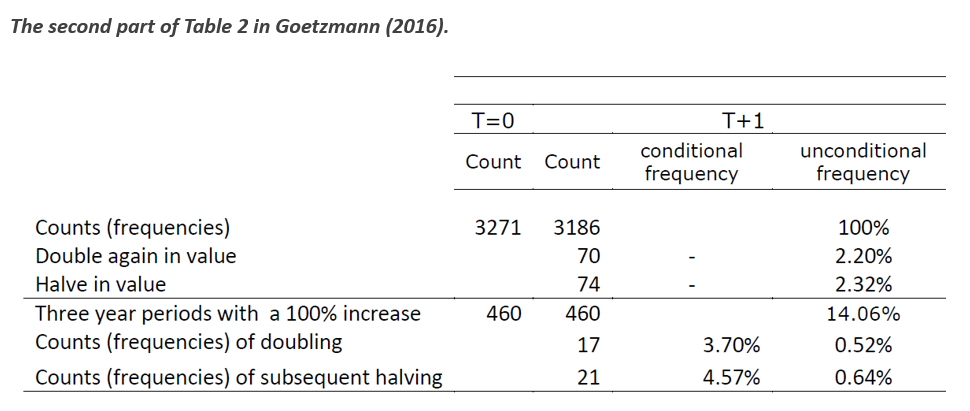
The first part of the table shows that there were 3,271 three-year periods of observed country-level stock returns. Among these 3,271 events, 70 were followed by a year in which that country’s stock market doubled. And 74 of these events were followed by a one-year period in which the country’s stock market was cut in half. This means that, regardless of the stock market performance of a country over the prior three years, there is roughly a 2% chance that any given country’s stock market will either double or be cut in half over the course of any given year.
Of interest to us, 460 of the 3,271 three-year return observations were cases where there was a doubling in a country’s stock market value. This happened 14.06% of the time (460/3,271). Of these cases of doubling, the stock market went on to double again in the next year 17 times; it went on to fall in value by 50% or more 21 times (these 21 are the after-the-fact bubbles). Of the 460 cases of stock-price booms, 3.70% were followed by another doubling in the next year, while 4.57% were followed by a price drop of 50% or more, i.e., a bubble bursting. In the remaining 422 cases, the stock market neither went up by more than 100% nor fell by more than 50%.
The takeaway is that past booms are not necessarily followed by busts. In fact, only 4.57% of past booms went bust. The majority did not. As Goetzmann wrote: “In simple terms, bubbles are booms that went bad. Not all booms are bad.”
While the Goetzmann analysis looks at country-level returns, my interest is more at the industry (i.e., tech stocks) level. I look at the industry-level evidence next.
The evidence at the industry level
A detailed empirical analysis of stock-price bubbles at the industry level can be found in a paper by Robin Greenwood and Andrei Shleifer of Harvard University, and Yang You from the University of Hong Kong. They defined a price boom as an industry stock price increase of 100% or more over two years (and at least a 50% return over the prior five years). Using the returns of 48 US industries from 1926 to 2014 they identified 40 such boom episodes.
The average returns of an industry in the 48 months after it experienced a boom (the line marked “average” in the figure below) is roughly in line with the overall stock market’s return over the same time period. The presence of a boom in a given industry does not, in and of itself, forecast lower future returns for the industry.
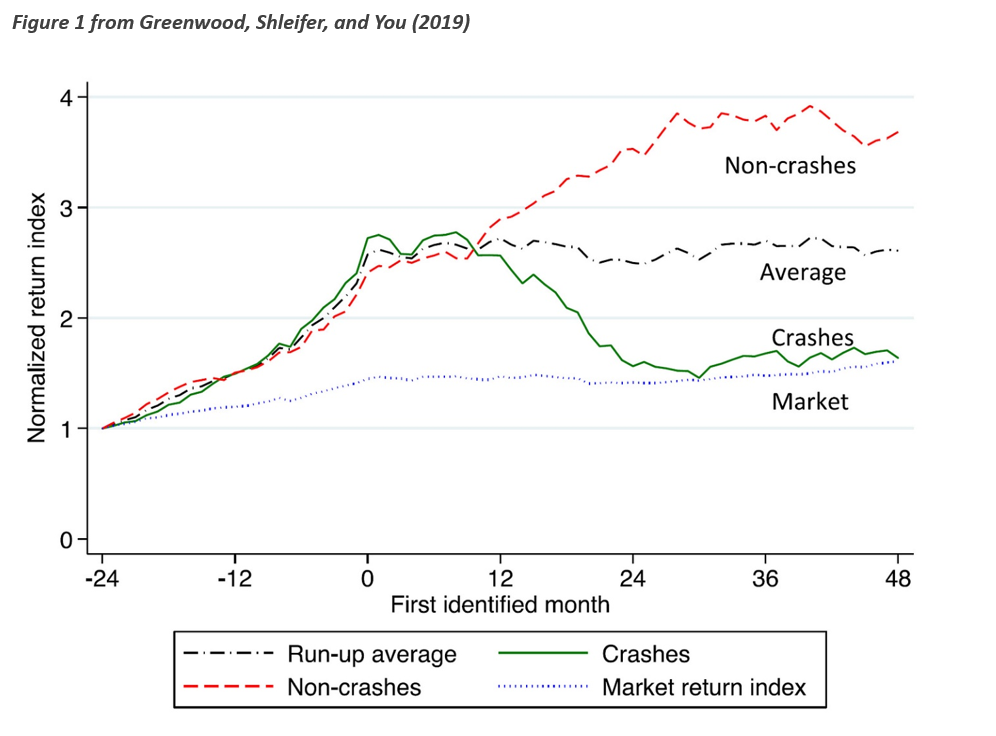
What is more striking is when they divided booms into those that were followed by a crash (a drawdown of 40% or more within two years of the boom) and those that were not. Of the 40 booms, 21 were followed by a crash, while 19 were not. The industries that experienced price booms that were not followed by a crash (19/40 times) had remarkable four-year ahead performance. On the other hand, industries that crashed following the boom, i.e., the after-the-fact bubbles, greatly underperformed the overall market over the subsequent four years.
The story, largely consistent with the country-level analysis in Goetzmann (2016), is more about a high degree of volatility following booms rather than of a low average return. Greenwood et al. summarized their findings as follows:
(1) [A] sharp price increase of an industry portfolio does not, on average, predict unusually low returns going forward; (2) such sharp price increases predict a substantially heightened probability of a crash but not of a further price boom; (3) attributes of the price run-up, including volatility, turnover, issuance, and the price path of the run-up, help forecast an eventual crash; and (4) these attributes also help forecast future returns.
One could, in fact, take small issue with claim (2), because while sharp increases did seem to increase the chances of having very low returns, they also increased the chance of seeing very good future performance, though not rising to the level of a boom (i.e., a doubling in stock prices).
Turning back to tech stocks in 2023
The argument that tech stocks should do poorly going forward because they have gone up a lot over the last few years is not consistent with academic research in this area. Large stock-price increases have not necessarily been subsequently reversed. In fact, stocks that have gone up a lot have gone up or down a lot subsequently. Not all booms turned into busts, and many (perhaps most) did not.
In addition to looking at price behavior, it is therefore important to also look at valuations and fundamentals. I will do this in part II of this analysis, which will come out next week.
In the meantime, investors should make sure to tailor their portfolios to their individual risk tolerances and liquidity needs. Those unsure about how to invest should consult with a financial advisor.
Harry Mamaysky is a professor at Columbia Business School and a partner at QuantStreet Capital.
Membership required
Membership is now required to use this feature. To learn more:
View Membership BenefitsSponsored Content
Upcoming Virtual Events View All


