Long Live the 60/40 Portfolio
Membership required
Membership is now required to use this feature. To learn more:
View Membership Benefits Advisor Perspectives welcomes guest contributions. The views presented here do not necessarily represent those of Advisor Perspectives.
Many pundits have declared the death of the 60/40 portfolio1 in recent years, reflecting the microscopic scrutiny of multi-asset strategies in 2022 amid jarring global events. The 60/40 portfolio promotes the potential for attractive risk-adjusted returns by investing in a mix of stocks and bonds. And in spite of the ongoing global challenges, my firm’s empirical research suggests that bonds should continue to play a supporting role in well-balanced portfolios.
From our perspective, the 60/40 portfolio – and diversification in general – is alive and well.
The death of the 60/40 portfolio?
Is the 60/40 portfolio dead, as many pundits have declared? The near-zero global interest rates in the decade following the great recession, and, more recently, the dreadful performance of both stocks and bonds in 2022, have been cited by some as the death knell of the 60/40 portfolio. This investment approach promotes the promise of attractive risk-adjusted returns by including a mix of 60% stocks and 40% bonds, offering diversification and risk factors thought to be uncorrelated.
Within a diversified portfolio, bonds offer relatively predictable coupon payments and a potential counterbalance and stability to equities and other risk assets. Bonds often rally when equities sell off, as shifting underlying risk factors tend to fuel so-called flight-to-safety capital flows into bonds. Empirically, industry participants often cite observed low or negative correlations between stocks and bonds as justification for a balanced portfolio.
Questions arise regarding conventional wisdom
However, the conventional wisdom of employing a balanced portfolio of stocks and bonds come under scrutiny over the past decade. Equity dividends were often competitive with fixed income yields, and stock and bond prices often moved in conjunction, sometimes sharply lower. Have bonds and the merits of a balanced portfolio failed? Exhibit 1 provides context to help answer this question.
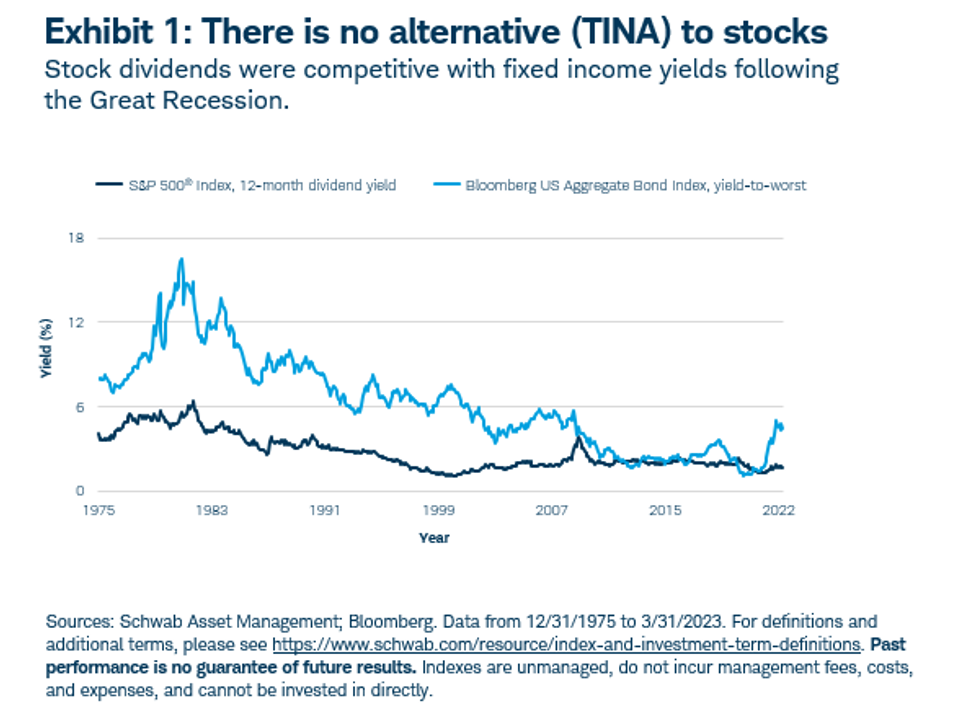
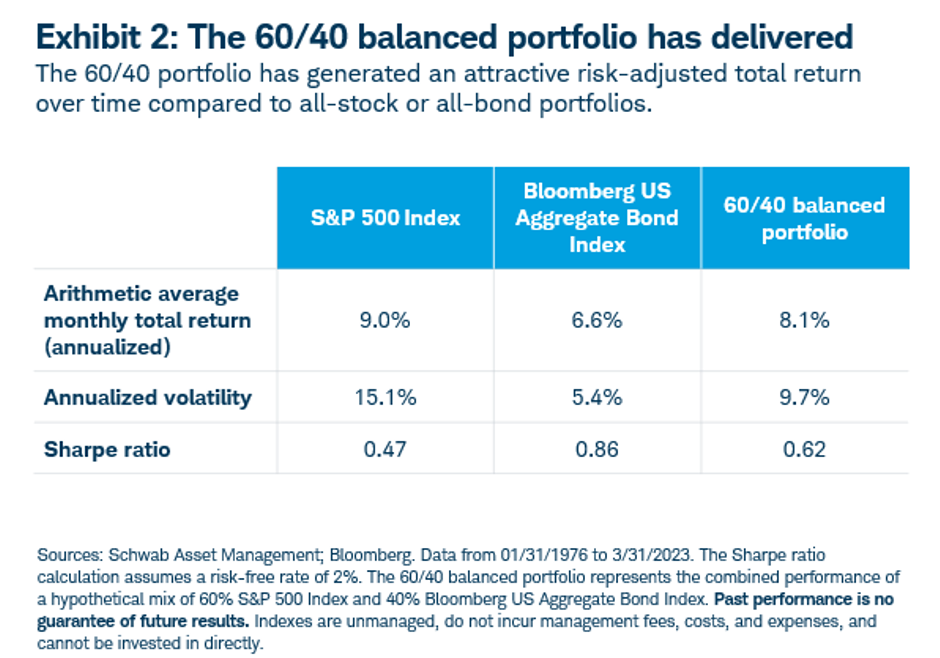
Surprisingly, despite low bond yields in the era following the great recession, 60/40 and similarly balanced portfolio performance has been remarkably resilient, primarily due to a prolonged equity bull market. Bonds may have taken a back seat during a macro environment that favored equities. Yet fixed income bolstered portfolio performance during volatile stock market drawdowns, such as the start of the global pandemic and ensuing 2020 recession. Exhibit 2 illustrates those results.
Empirical evidence about correlations and performance
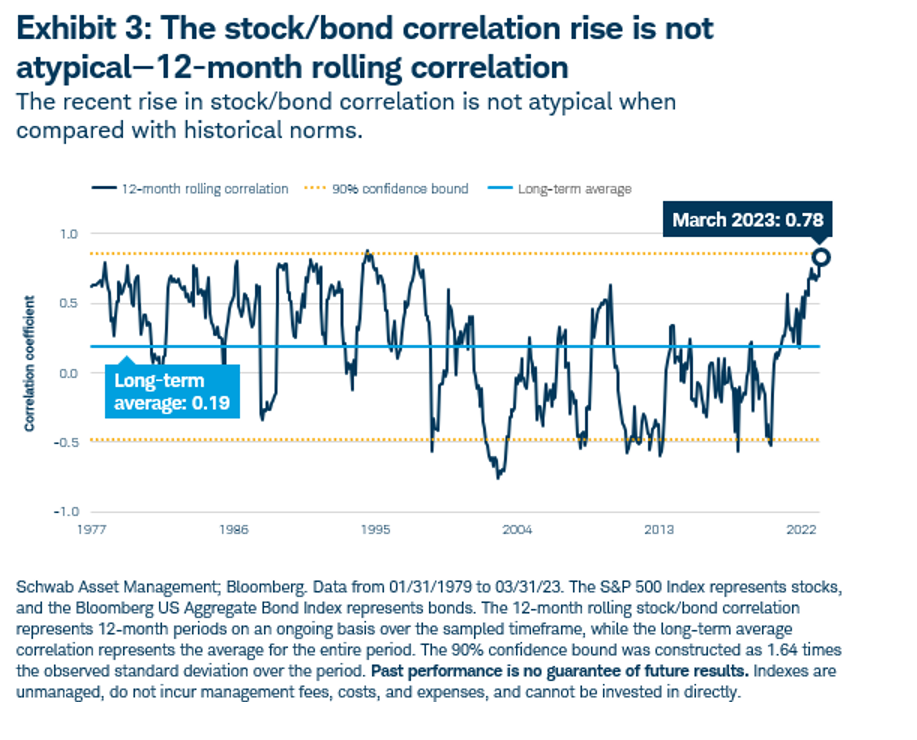
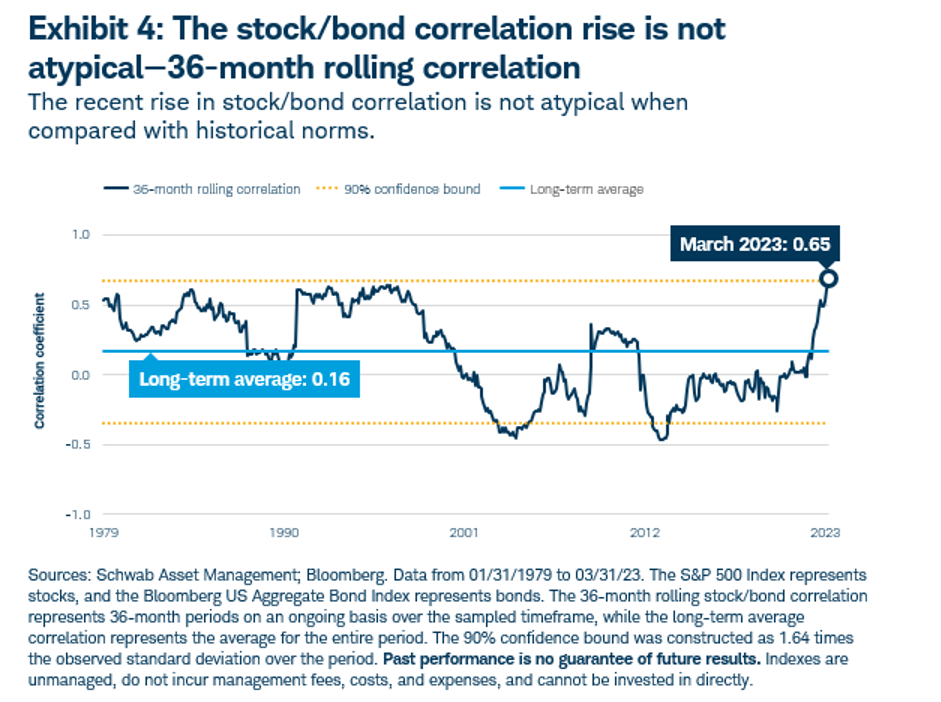
The recent rise in stock/bond correlations during 2022 and into the first quarter of 2023 has some investment experts questioning the merits of diversification and balanced portfolios. However, as Exhibits 3 and 4 help to demonstrate, while the long-term historical average correlation between stocks and bonds has been near-zero or negative depending on the observation period, observed correlations can vary meaningfully.
History lessons about correlation extremes
What does history teach us about 60/40 portfolio performance in the wake of high- or low-correlation extremes? Exhibit 5 helps answer this question, illustrating the historical relationship between the 12-month rolling correlation of stocks and bonds, and the performance of a 60/40 portfolio over the subsequent 12-month period.
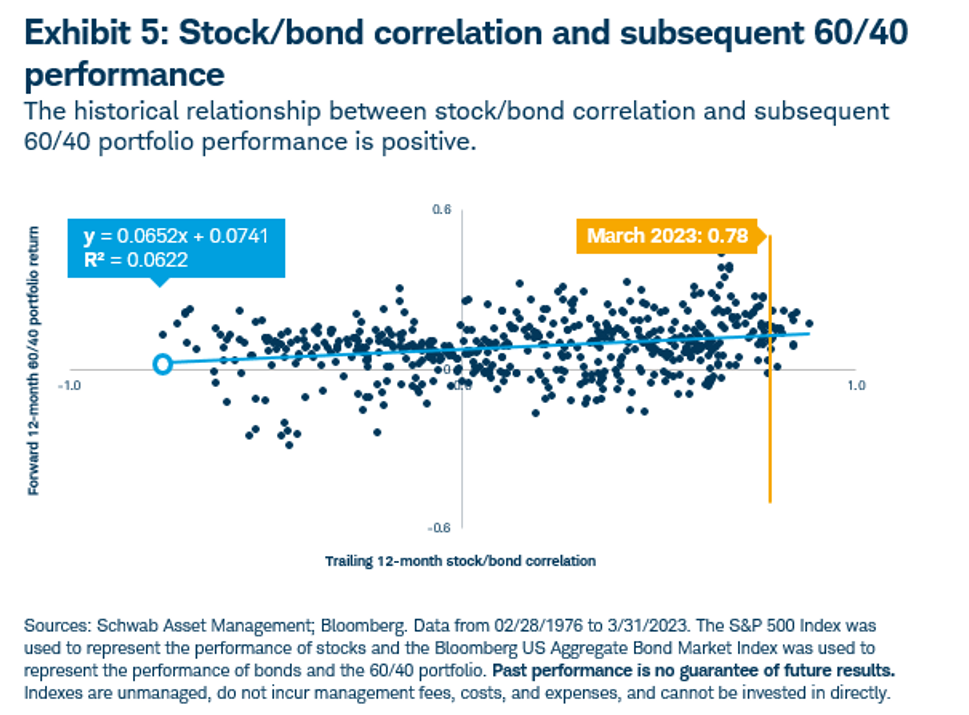
The observed relationship between correlation and forward return in the Exhibit 5 scatter plot chart is positive, meaning that the 60/40 portfolio performance was persistent despite increased correlation. Said differently, when correlation was elevated (like in early 2023), 60/40 performance has historically been positive and higher. At a minimum, we can say that a high observed correlation does not necessarily predict poor subsequent 12-month performance, a critique purported by some pundits.2
An atypical year that generated painful results
Stocks and bonds suffered painful losses in 2022 – the S&P 500 Index finished the year 19% lower and the Bloomberg US Aggregate Bond Index – one of the most widely watched bond market indexes – fell 13%. Indeed, 2022 was the worst performing calendar year in the bond index’s history.3
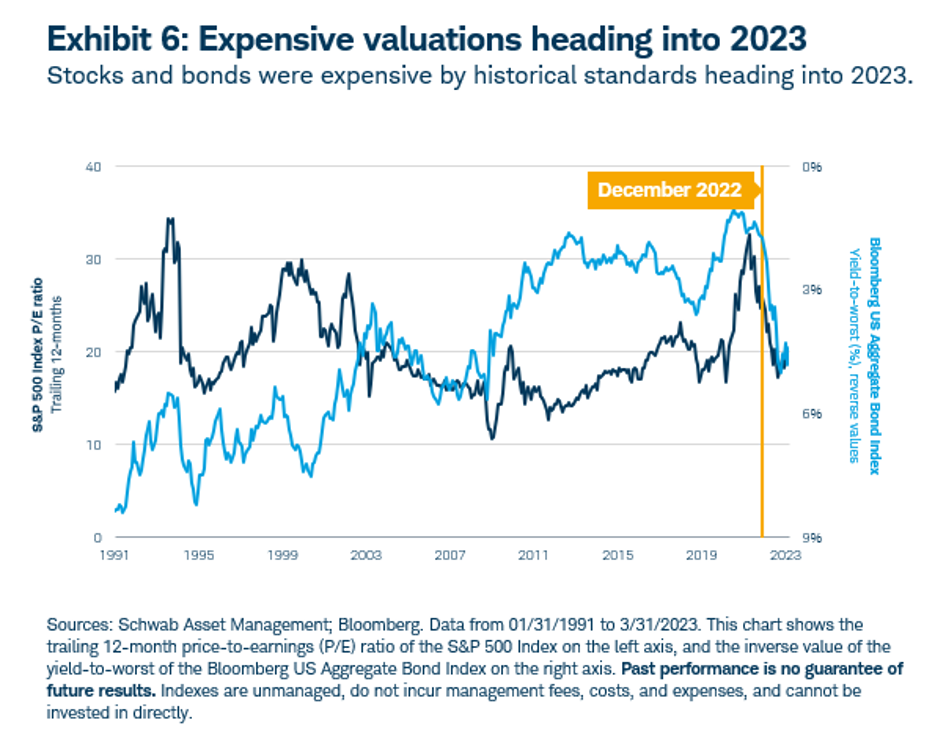
In the leadup to 2022, both equities and fixed income had become increasingly expensive, with the trailing 12-month price-to-earnings, or “P/E,” ratio of the S&P 500 Index at 25.76 and yield to worst on the Bloomberg US Aggregate Bond Index at 1.75% as of the end of 2021. For equities, the P/E ratio indicates how expensive a company’s share price is relative to its earnings per share, and, for fixed income, lower yields may indicate higher bond prices. As Exhibit 6 shows, stocks and bonds have not usually had such unfavorable valuations at the same time.
Invasion roils an optimistic outlook
While the mood early in 2022 may have been optimistic as COVID-19 vaccines rolled out and economies and societies around the world began to emerge from quarantine, Russia shocked the world and roiled financial markets by invading Ukraine in late February 2022. Geopolitical disruptions, coupled with lingering supply chain issues resulting from pent-up demand and locked down economies, pushed prices for goods and commodities higher, prompting unprecedented monetary policy tightening by global central banks in an attempt to quash inflation that had risen to levels not seen in 40 years.
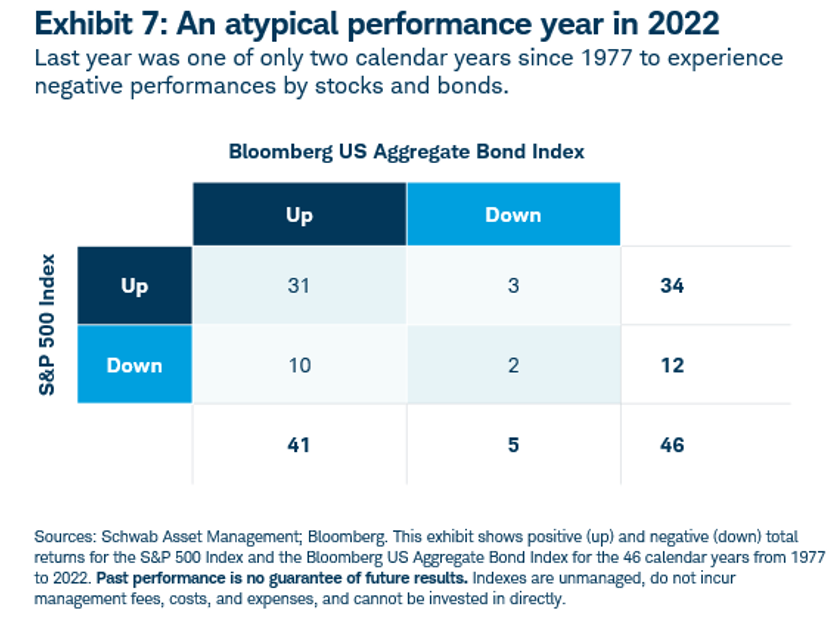
The unfavorable starting valuations for stocks and bonds coming into 2022 compounded the previously mentioned challenges, collectively forming somewhat of a perfect performance storm for 60/40 and balanced portfolios last year. Since 1977, there have only been two calendar years when both the S&P 500 Index and the Bloomberg US Aggregate Bond Index finished negative (2022 and 1994). Exhibit 7 demonstrates this point.
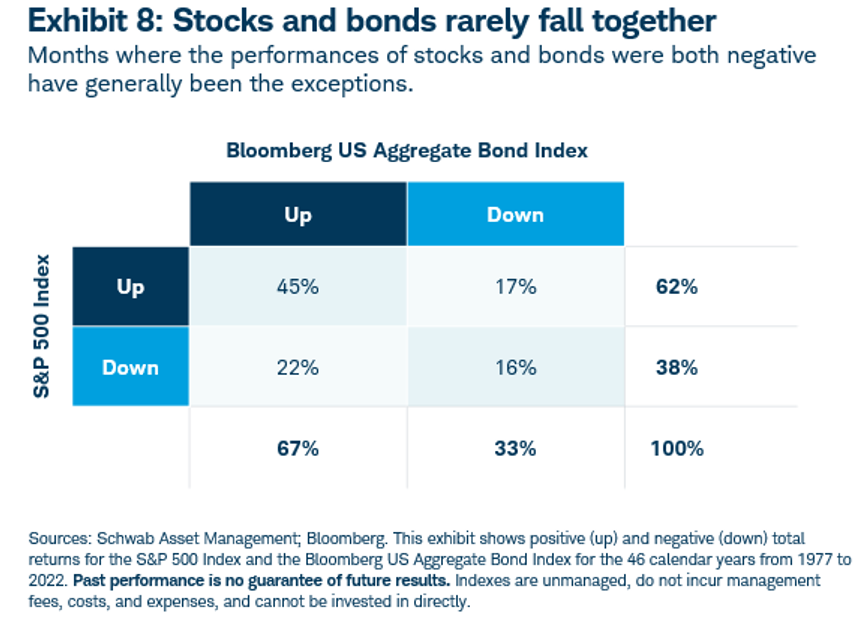
If we look at monthly instead of calendar-year returns over the same period, stocks and bonds experienced a negative return in only 16% of the months. In almost 40% of the months, stocks and bonds moved in opposite directions, providing evidence of diversification. Exhibit 8 shows the incidence of positive vs negative stock and bond returns for monthly intervals.
Given these yearly and monthly empirical findings, added to the comparatively favorable starting point for stocks and bonds in 2023, the historically poor performance of the 60/40 portfolio in 2022 seems unlikely to repeat in 2023.
Where do we go from here?
Any investors feeling jittery coming into 2023 were likely in good company. Many, if not all, macro and geopolitical risks that surfaced during 2022 remained in place through 2023’s first quarter, including the war in Ukraine. Moreover, while inflation may have peaked, it remains elevated and will take time to subside to more historically neutral levels. A deeply divided Congress will need to find a bipartisan solution to the debt ceiling, and, as of the end of the first quarter of 2023, the precipitous rise in interest rates has materially impacted bank balance sheets and left depositors skittish, as evidenced by the collapse of Silicon Valley Bank and Signature Bank. The debates of a soft versus hard landing for the U.S. economy are ongoing, though, at the time of writing, most market participants believed that a U.S recession is inevitable.4 So, what does history tell us about stock and bond correlations during periods of high inflation or leading up to or after recessions?
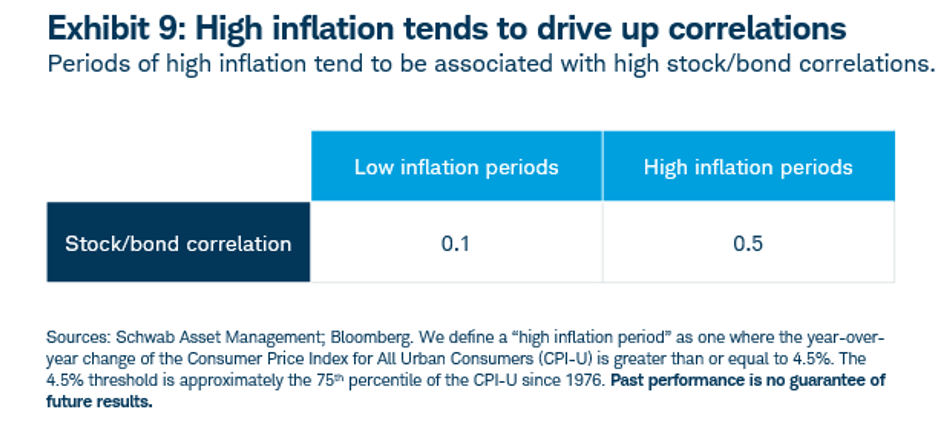
Empirically, we find that periods of high inflation tend to be associated with high stock/bond correlations, a result that is quantified in Exhibit 9. History therefore suggests that correlations may remain elevated throughout 2023, although we have already illustrated that correlation is not necessarily indicative of forward performance.
Looking at the historical pattern of stock and bond correlations leading up to and after official recessions (as designated by the National Bureau of Economic Research), we cannot make any strong conclusions and elevated correlations have historically been neither predictive nor indicative of a recession. Correlations have tended to normalize after recessions have officially ended, although this has not always been the case.
Long live the 60/40 portfolio!
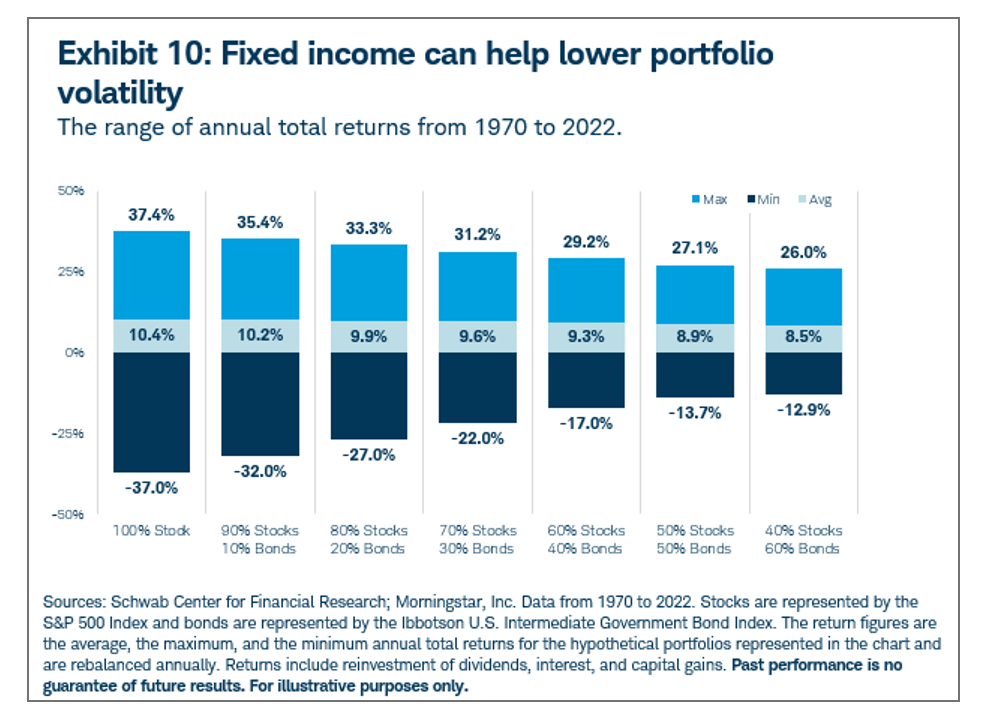
While the events of the past few years have certainly been jarring, there is no empirical evidence to suggest that there have been structural changes to the historical relationship between stocks and bonds. As a result, we believe that the 60/40 portfolio heuristic is remains relevant. Moreover, the importance of including a range of fixed income allocations within a well-diversified portfolio is just as relevant for investors today as ever. With recent bond yields at levels not seen in the past decade,5 we believe bonds will play a large role in balanced portfolios, providing substantial income and continuing to support portfolio performance with stability and lower risk than equities. This relationship is demonstrated in Exhibit 10, which reveals the risk-related benefits that have been available when including a range of fixed-income allocations in a well-diversified portfolio of stocks and bonds.
Investing in both stocks and bonds provides exposure to different risk factors, and investors can benefit from this diversification – even during periods of elevated correlations. A balanced portfolio approach has helped investors weather myriad storms over recent decades, while enhancing risk-adjusted returns amid high inflation, recession, and market turmoil – obstacles that may remain relevant for investors.
Omar Aguilar, PhD, is chief executive officer and chief investment officer of Schwab Asset Management™
1 The 60/40 portfolio – also referred to in this paper as the 60/40 balanced portfolio – represents a hypothetical mix of 60% stocks and 40% bonds. This investment approach promotes the potential for attractive risk-adjusted returns by investing in a mix of asset classes thought to be largely uncorrelated, meaning that they are expected to perform independently of one another. In our exhibits, we have primarily used the S&P 500 Index to represent stocks and the Bloomberg US Aggregate Bond Index to represent bonds. However, it is important to remember that Indexes are unmanaged, do not incur management fees, costs, and expenses, and cannot be invested in directly.
2 Each dot in the scatter plot chart represents a month from February 1976 to March 2022, where the value plotted on the horizontal axis is the observed stock/bond correlation over the previous 12 months, and the value plotted on the vertical axis is the performance of a 60/40 portfolio over the subsequent 12 months. A negative relationship between these variables – indicating that a high stock/bond correlation is predictive of poor 60/40 performance – would be visually represented by the dots trending from top left (low correlation, good performance) to bottom right (high correlation, poor performance). The linear relationship between these two variables is estimated by the equation in the gray box, where the slope of the coefficient (0.065) is slightly positive. R-squared, or R2, is a measure of the strength of this relationship or how well the linear equation can explain the observed data. In this case, an R-squared of 0.062 indicates a poor model fit, with the interpretation that variations in stock/bond correlation can only explain 6.2% of the variation in subsequent 60/40 portfolio performance.
3 Based on Bloomberg the total return history of the Bloomberg US Aggregate Bond Index from 1976 to 2022.
4 U.S. recession probability forecast of 65% (median), based on Bloomberg data as of 4/3/2023.
5 The Bloomberg US Aggregate Bond Index yield-to-worst was 4.4% as of 03/31/2023.
Membership required
Membership is now required to use this feature. To learn more:
View Membership BenefitsSponsored Content
Upcoming Virtual Events View All


