A correction was made to this article on April 11, 2023 at 10:40am ET. In the fourth paragraph, the word "lower" was changed to "higher" in this sentence: "While excluded (low ESG-scoring) stocks have produced higher returns..."
Sustainable investing continues to gain in popularity, with investors worldwide frequently attracted not only by ethical concerns but also by the lure of superior returns. Unfortunately, new research focused on global stocks showed that they did not get what they were sold.
Economic theory suggests that if a large enough proportion of investors choose to favor companies with high sustainability ratings (green businesses) and avoid those with low sustainability ratings (brown, or sin, businesses), the favored companies’ share prices will be elevated, and the excluded shares will be depressed. Thus, in equilibrium, the screening out of certain assets based on investors’ preferences/tastes should lead to a return premium on those assets.
As Sam Adams and I explained in our new book, Your Essential Guide to Sustainable Investing, the evidence has generally been consistent with economic theory. For example, Erika Berle, Wangwei He and Bernt Ødegaard, authors of the April 2022 study, “The Expected Returns of ESG Excluded Stocks. The Case of Exclusions from Norway's Oil Fund,” analyzed the consequences of widespread environmental, social and governance (ESG)-based portfolio exclusions on the expected returns of firms subject to exclusion and found that exclusion portfolios (low ESG-scoring firms) had significant superior performance (alpha) relative to a Fama-French five-factor model. For example, the equally weighted portfolio of all excluded stocks had a statistically significant annual alpha of almost 5%. As another example, a 2017 study found that exclusions had reduced the return to the Norway fund by 1.1% over the prior 11 years.
While excluded (low ESG-scoring) stocks have produced higher returns, the picture is not all one-sided, as the excluded stocks are likely to be subject to greater risk because companies with high sustainability scores have better risk management and better compliance standards. Their stronger controls lead to fewer extreme events such as environmental disasters, fraud, corruption and litigation (and their negative consequences). The result is a reduction in tail risk in high-scoring firms relative to the lowest-scoring firms. The greater tail risk creates the “sin” premium.
New evidence
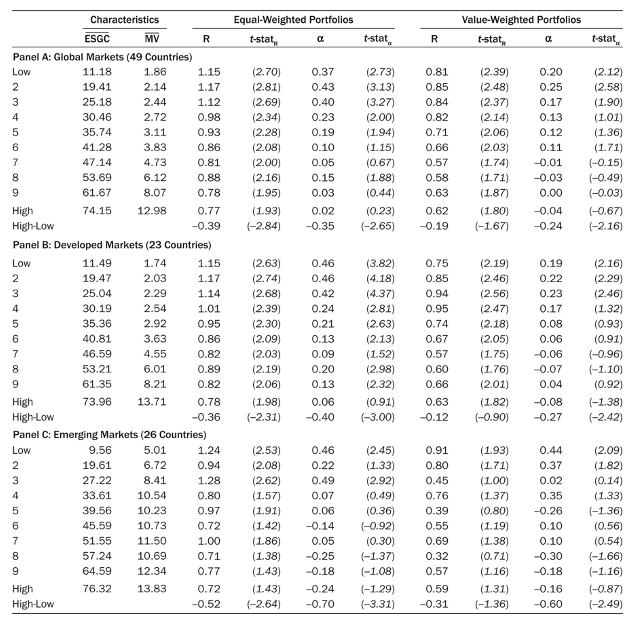
Nusret Cakici and Adam Zaremba, authors of the study, “Responsible Investing: ESG Ratings and the Cross Section of International Stock Returns,” published in the fall 2022 issue of The Journal of Impact & ESG Investing, investigated the impact of ESG ratings on stock returns in 49 countries (23 developed and 26 emerging markets) over the period 2005-2020. The U.S. accounted for 33% of the sample, other developed markets 51%, and emerging markets 16%. They sorted global stocks into deciles based on the aggregate Refinitiv environmental, social and governance scores with the controversies overlay (ESGC). The Refinitiv ESG scores offer one of the most comprehensive social responsibility rating systems, covering over 70% of the global equity market. The control variables from asset pricing studies included the Fama-French five factors (beta, size, value, profitability and investment), momentum, idiosyncratic volatility (IVOL), illiquidity and skewness. Following is a summary of their findings:
- ESGC ratings negatively predicted future stock returns – the cross-sectional return pattern was statistically significant and held in developed and emerging markets alike. For the value-weighted long-short portfolios, the average monthly return was -0.19%, although not statistically significant at the 5% confidence level (t-stat = -1.67), and the alpha was -0.24% (t-stat = -2.16), statistically significant at the 5% level.
- The underperformance of the high ESGC stocks was marginally stronger in emerging markets than in developed ones.
- Due to the substantial persistence in the ESGC measure, the abnormal returns endured up to 12 months following portfolio formation – a total of 72% of stocks from the bottom ESGC decile remained in the same category after one year, and the rest typically migrated to the closest decile.
- ESG investments tended to exhibit substantial size factor exposure, as big firms are typically higher ESG rated. The low-rated companies, which historically produced higher returns, were concentrated in smallest stocks. The low-rated companies also tended to exhibit substantial exposure to IVOL (as do small stocks).
- Profitability did not play a major role in the cross-section of returns once the size effect was accounted for.
- There were substantial differences across markets. While some countries exhibited sizable negative abnormal returns – for example, Sweden and Colombia – in others, such as Portugal, Italy, and the United Arab Emirates, the premium was positive. Notably, the significant negative returns that contributed substantially to the global sample were typically recorded in large markets (including the U.S., the U.K. and China).
- The importance of different ESG dimensions was not identical – governance ratings were particularly powerful predictors of stock returns, especially in developed markets, while the effect of social ratings was visibly weaker.
NOTES: This exhibit reports the performance of decile portfolios from sorts on the composite environmental, social, and governance score with the controversy overlay (ESGC). High and Low indicate portfolios with the highest and lowest ESGC, respectively, and High-Low is the spread portfolio that buys (sells) the High (Low) decile. The portfolios are equal- or value-weighted and are rebalanced monthly. R is the mean monthly return, and α denotes the alpha from the six-factor model of Fama and French (2018) – both expressed in percentage. The values in parentheses are t-statistics adjusted for autocorrelation and heteroscedasticity using the Newey–West (1987) method. Furthermore, the table reports the average ESGC scores Embedded Image, and firm size (Embedded Image, in USD billion) within the ESGC deciles. The study period is from January 2005 to December 2020. Panel A presents the results for the full sample of global markets (49), and Panels B and C, for the subsets of developed (23) and emerging (26) markets. The average number of stocks in a decile portfolio in Panels A, B, and C equals 425, 363, and 71 stocks – respectively.
Their findings led Cakici and Zaremba to conclude: “Investors’ hopes of the superior performance of responsible companies are futile. By buying ESG companies, investors typically take substantial exposure to big companies. Therefore, they sacrifice the small-cap premium that otherwise could be earned. To implement successful ESG strategies, investors should control the size structure and exposure of their portfolios. Isolating the firm size influence would potentially allow incorporating the ESG criteria in portfolio construction without harming its profitability. Doing well (or at least decently) while doing good would still be possible.” They did add, however, that once they isolated the role of firm size, they did not observe any detrimental impact of corporate social responsibility. Offering words of hope, they concluded: “Being good, in this case, does not prove to be costly.” Even better, the high-scoring stocks are less risky.
Words of caution
As Sam Adams and I explained in Your Essential Guide to Sustainable Investing, the huge increase in cash flows from sustainable investors created conflicting forces, as investor preferences led to different short- and long-term impacts on asset prices and returns. Firms with high sustainable investing scores earned rising portfolio weights, leading to short-term capital gains for their stocks – realized returns rose temporarily. However, the long-term effect is that higher valuations reduced expected long-term returns. The result could be an increase in green asset returns even though brown assets earned higher expected returns. In other words, there can be an ambiguous relationship between carbon risk and returns in the short term. For example, the authors of the 2022 study “Dynamic ESG Equilibrium” found that despite investor preferences for sustainable investments creating a brown premium of about 1% per year, over the period 2018-2020 the increased demand for sustainable investments led to a green portfolio outperforming by about 7 percentage points a year (14% versus 7%). However, the long-term effect was that the higher valuations reduced expected long-term returns.
Those conflicting forces could have produced the results that led Cakici and Zaremba to conclude that with the exception of small stocks, sustainable investors, while not earning higher returns, were at least not paying any significant price for doing good. Thus, the takeaway is that sustainable investment strategies should be expected to produce portfolios that have less risk and thus, logically, they should also be expected to produce lower returns in the long run (in equilibrium). With that said, in the short run, the continued popularity of sustainable strategies could create sufficient cash flows to offset the risk premium in the lower-scoring stocks, at least until an equilibrium is reached.
Larry Swedroe is the head of financial and economic research at Buckingham Wealth Partners.
For informational and educational purposes only and should not be construed as specific investment, accounting, legal, or tax advice. Neither the Securities and Exchange Commission (SEC) nor any other federal or state agency have approved, determined the accuracy, or confirmed adequacy of this article. Information may be based on third party data which may become outdated or otherwise superseded without notice. Third party information is deemed to be reliable, but its accuracy and completeness cannot be guaranteed. By clicking on any of the links above, you acknowledge that they are solely for your convenience, and do not necessarily imply any affiliations, sponsorships, endorsements or representations whatsoever by us regarding third-party websites. We are not responsible for the content, availability or privacy policies of these sites, and shall not be responsible or liable for any information, opinions, advice, products or services available on or through them. All investments involve risk, including loss of principal. The opinions expressed here are their own and may not accurately reflect those of Buckingham Strategic Wealth® or Buckingham Strategic Partners®, collectively Buckingham Wealth Partners. LSR-22-206
Read more articles by Larry Swedroe
 A correction was made to this article on April 11, 2023 at 10:40am ET. In the fourth paragraph, the word "lower" was changed to "higher" in this sentence: "While excluded (low ESG-scoring) stocks have produced higher returns..."