First Quarter 2023 Economic Review and Forecast
Membership required
Membership is now required to use this feature. To learn more:
View Membership Benefits The year 2022 was challenging for investors, as both the S&P 500 and long-term bonds declined by double digits, the first time in the modern era. The economic signals and a host of geopolitical risks confronting investors suggest that 2023 could be similarly challenging for both stocks and bonds. The markets were hit with a shock to the financial system when Silicon Valley Bank (the 16th largest, with more than $200 billion in assets) and then Signature Bank (with more than $100 billion in assets) failed and had to be taken over by the FDIC. Their failures, and the fears of a run on banks, had a major impact on bond markets.
The heightened risks to the financial system impacted the Fed’s actions in its fight to contain inflation. It was expected to increase rates by 0.5% on March 23. However, its concerns about financial fragility in the banking system led the Fed to raise rates by 0.25%. In addition, while noting that some additional policy firming might be appropriate, it omitted prior language forecasting “ongoing increases.” The “dot plot” of rate forecasts showed a 5.1% median estimate for the Fed funds rate at year’s end, unchanged from the last update in December. The Fed also slightly lowered its forecast for economic growth in 2023 from 0.5% to 0.4%; and next year growth is forecasted at 1.2%, down from 1.6%. With these facts in mind, we’ll examine what led to the second largest banking failure in U.S. history.
Silicon Valley Bank (SVB) failure
The failure of SVB had its origins in the fiscal and monetary responses to the COVID crisis. The massive fiscal stimulus, combined with the Fed’s dramatic increase in its balance sheet through its program of quantitative easing (buying bonds) and financial repression (driving interest rates to zero and holding them there), led to an unprecedented growth in deposits at U.S. banks. And the policies that led to locking down much of the economy meant that consumers could not spend those increased deposits. Even in good times, it takes time for banks to originate loans. With the weak economy, banks used the deposits to buy “safe” Treasury and mortgage-backed securities. Some banks bought shorter-term securities, others longer-term bonds, turning those safe assets into risky (from a duration-risk standpoint) assets. For banks that created the duration mismatch (borrowing short and lending long), that strategy worked until it didn’t. Having to fight the inflation created by stimulative fiscal and monetary policies, the Fed not only raised interest rates at one of the fastest paces in history, raising its benchmark rate from a range of 0.00%-0.25% at the start of 2022 to a current target of 4.75%-5.0%, but it also began to shrink its balance sheet. The result was an unprecedented drop in the money supply. As interest rates rose, bonds declined in price, leading to unrealized losses on banks’ securities portfolios. With depositors able to earn higher yields in other places, deposit growth at banks turned negative. In the case of SVB, the unrealized losses were so large that they effectively wiped out the bank’s capital. And when deposits began to shrink, they had to sell those longer-term bonds, realizing the losses.
The problem for the Fed is that SVB is not the only bank to have losses in its securities portfolios; many banks are in a similar situation. As John Cochrane noted: “The U.S. banking system’s market value of assets is $2 trillion lower than suggested by their book value of assets accounting for loan portfolios held to maturity. Marked-to-market bank assets have declined by an average of 10% across all the banks, with the bottom 5th percentile experiencing a decline of 20%. … 10% of banks have larger unrecognized losses than those at SVB. Nor was SVB the worst capitalized bank, with 10% of banks [having] lower capitalization than SVB. On the other hand, SVB had a disproportional share of uninsured funding: only 1% of banks had higher uninsured leverage. Even if only half of uninsured depositors decide to withdraw, almost 190 banks are at a potential risk of impairment to insured depositors, with potentially $300 billion of insured deposits at risk. These calculations suggest that recent declines in bank asset values very significantly increased the fragility of the US banking system to uninsured depositor runs. … Fortunately, most did not make the size of the duration bet made by SVB. However, the Fed has to be concerned about the potential for other banks facing the prospect of bank runs that reduce their deposit funding base and force them to realize these losses.”
Adding to the problem, the drop in the stock prices experienced by the regional banks since the failure of SVB has greatly reduced their ability to raise capital through equity issues. To minimize the risk of a run on the banks, the Fed created a backstop lending program, providing the banks with the funding they need to avoid having to sell bonds and realize the losses (providing loans at the face value of the collateral, not the market value). And by guaranteeing all deposits, not just those within the FDIC limits, the Fed hopes to avoid a broader run.
Crisis avoided, but Fed’s task is complicated
While a financial crisis has been avoided, at least for now, the Fed’s task of fighting inflation has been made more difficult. If it continues to raise interest rates, it could cause more financial distress. On the other hand, if it does not, inflation may become more difficult to subdue. The view that the Fed would be more constrained in raising interest rates led to a dramatic rally in the bond market (with the benefit of significantly reducing the unrealized losses on bank balance sheets). For example, the yield on the two-year Treasury note fell from 5.05% on March 8th, before SVB’s failure, to about 3.9% after the Fed announcement on March 22nd. And the yield on the 10-year note had fallen from 3.98% to 3.45%.
Another significant problem was created by the failure of SVB – the bank was an important provider of working capital lines of credit to many venture capital-backed startups. Those lines are gone and will have to be replaced, which takes time. Valuations of VC-backed companies are way down, and credit conditions have tightened. That could make it difficult for some to get funding. In addition, the general tightening of financial conditions also increases the downside risk to the economy because the regional banks impacted are large lenders to smaller businesses and the commercial real estate and industrial loan markets – banks smaller than the largest 25 account for around 38% of all outstanding loans and 67% of commercial real estate lending.
Monetary policy works with long and variable lags
The largest combined monetary and fiscal stimulus experiment in the history of the U.S., which led to the sharp rise in inflation, ended just a year ago. The Federal Reserve ended its program of quantitative easing (QE, buying bonds) in March 2022 and began a program of quantitative tightening (QT, selling bonds or allowing bonds to mature without rolling them over into new purchases) three months later, in June. It is currently shrinking its balance sheet by about $100 billion a month. The Fed has only attempted QT once before: October 2017-September 2019. A recent study by economists at the Federal Reserve Board of Governors estimated that reducing the balance sheet by its current pace would be roughly equivalent to raising the Fed’s policy rate by half a percentage point. However, the authors stressed that their estimate was “associated with considerable uncertainty.” And the Fed has already raised the Fed funds rate by 4.75% since the start of 2022.
As seen in the chart below, the tightening of monetary policy has led to a decline in the M2 money supply over the past year.
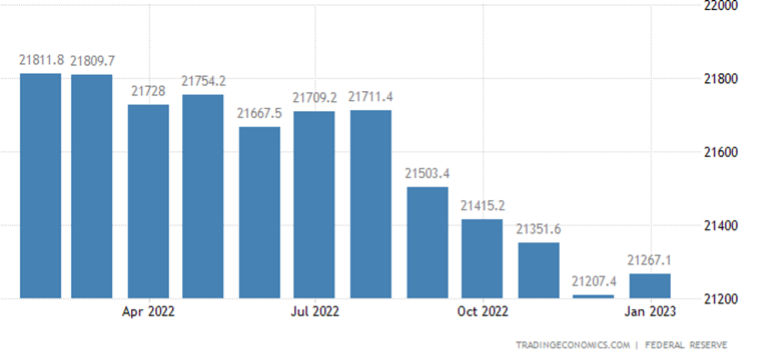
Changes in monetary policy on inflation and economic growth take effect with a lag of typically 6-18 months. The good news is we are seeing signs that the rate of inflation, particularly in goods prices, has fallen. On the other hand, there are some signs that inflation appears to be leveling off at an unacceptably high level.
Inflation
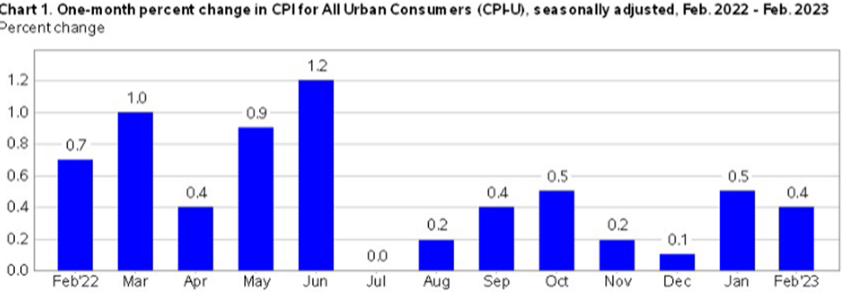
Unfortunately, especially in light of the SVB collapse, while inflation has eased, it remains stubbornly high. The U.S. Bureau of Labor Statistics reported that in February the Consumer Price Index for All Urban Consumers increased at a seasonally adjusted 0.4% and rose 6.0% over the last 12 months. The core CPI (less food and energy) increased 0.5% in February, up 5.5% over the year.
That puts inflation still well above the Fed’s 2% goal, indicating a need for further tightening. For monetary policy to be considered restrictive (tight), the Fed funds rate needs be well above the inflation rate. With the Fed funds rate at 4.75%-5%, it is not even at the year-over-year level of inflation. Thus, the risks still appear to indicate that more tightening is possible, but given the banking situation, that will likely be highly dependent on financial conditions as well as inflation.
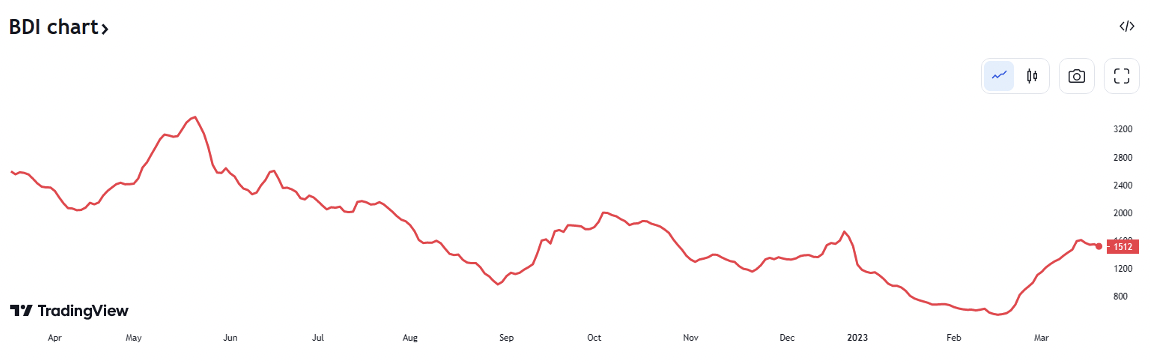
Another indicator that while inflation has come down it might be leveling off at an unacceptable level (well above the Fed’s 2% target) is that the Baltic Dry Index (BDI), a measure of the cost of shipping goods, bottomed out and has begun to increase. As seen in the following chart, while supply chain disruptions led to a dramatic increase in shipping costs, they have begun to rise again as the Chinese economy has reopened and developed nations’ economies have begun recoveries.
Another negative in the outlook for inflation relates to the tightening of monetary policy being only a necessary, not a sufficient, condition for success in fighting inflation. To increase the likelihood of success in bringing inflation to the Fed’s 2% target, fiscal policy should be supportive of monetary policy (move in the same direction). In his new book, The Fiscal Theory of the Price Level, John Cochrane explained that while monetary policy can be a source of inflation, fiscal policy plays a role as well – deficits can drive inflation. (For those interested in this subject, I highly recommend this video). Unfortunately, there is still a massive fiscal deficit – the Congressional Budget Office projects a federal budget deficit of $1.4 trillion for 2023 (5.3% of GDP) at a time of full employment (when we should be running primary surpluses). And the deficits are projected to keep increasing. Fiscal deficits are stimulatory in terms of demand. Thus, they are working against the Fed’s goal of bringing inflation down to its target.
Economic outlook
There are some positive signs for the economy:
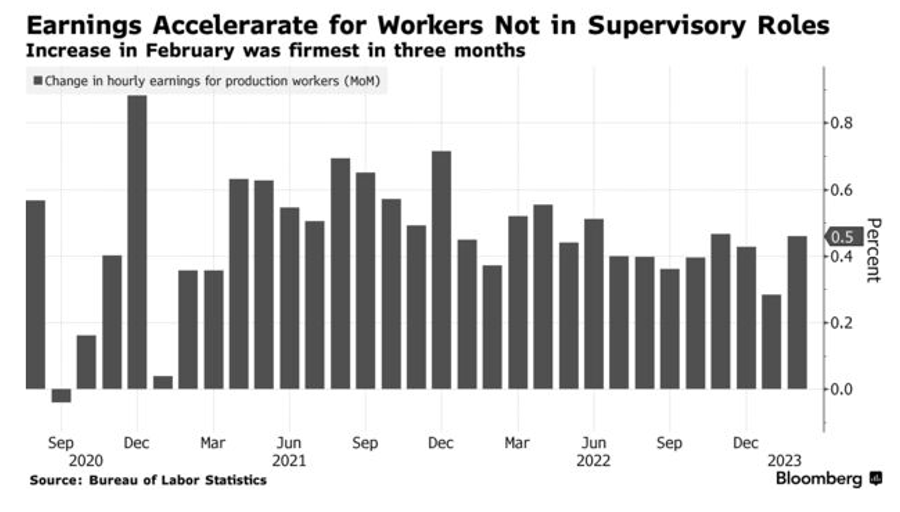
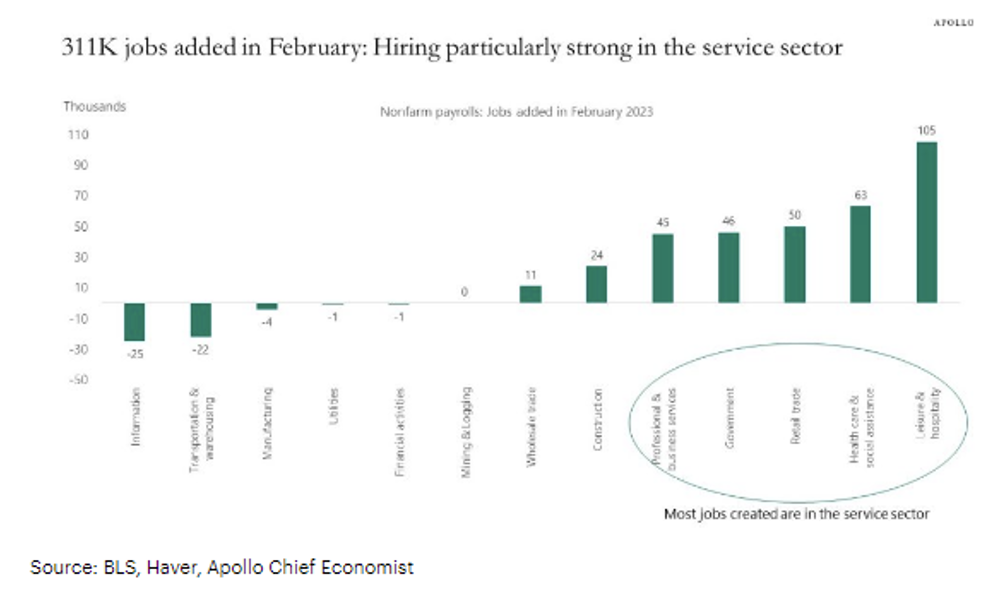
- Strong labor market. While the unemployment rate ticked up to 3.6% (due to an increase in the labor force) from January’s 54-year low of 3.4%, February nonfarm payrolls again surprised on the upside, increasing 311,000 after a 504,000 advance in January. And while the 0.2% change in hourly earnings (up 4.6% year-over-year) was the smallest in years, that might not be a signal that wage demands are moderating. Instead, it could be the result of a change in the composition of the workforce, with large increases in employment in lower wage sectors (such as hospitality). For example, wages for production and nonsupervisory workers – which make up the majority of U.S. workers and aren’t in management positions – advanced 0.5%, the biggest gain in three months.
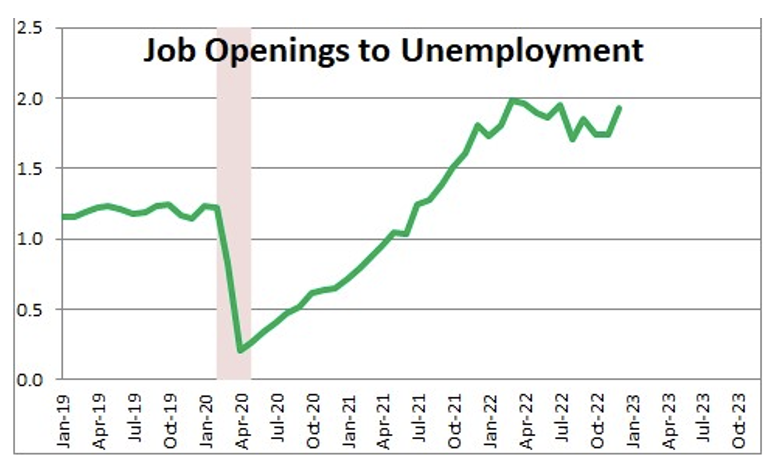
Despite the headlines about tech companies laying off workers by the thousands, the overall U.S. labor market is about the tightest it has ever been, with the number of available positions at 10.8 million in January, about 1.9 jobs posted for every unemployed person.
When reading those headlines, keep in mind that the unemployment rate among tech workers is below 2%. That is basically considered full employment – everyone who wants a job has one. While Meta and Twitter may be laying off tech people, those same people are finding jobs in other sectors of the economy. As examples, among the old economy firms that have been leaders in hiring tech workers are JPMorgan, General Motors, Walmart, United Healthcare, General Dynamics, Wells Fargo, Caterpillar, CVS Health, Abbott Laboratories, Emerson Electric, Pepsi and Boeing.
There are now severe shortages in many occupations, such as welders, pilots, nurses and teachers. Exacerbating the problem of a tight labor market is that the COVID crisis led to the early retirement of many workers. Demographic trends will exacerbate the problem as the baby boomer generation retires and the next generations are smaller. In addition, the move to onshore jobs (to reduce the risks of global supply chains) will further tighten the labor market. Tight labor markets, while good for wages and the economy (consumer spending accounts for about two-thirds of GDP), have the reverse effect on corporate profits. Thus, we could see a margin squeeze (a negative for the stock market) as the negotiating power shifts from employer to employee. In addition, tight labor markets mean that wage growth is likely to continue to be stronger than the Fed would like, and inflation may be harder to bring down to the target. In addition, the tight labor markets could make corporations reluctant to reduce their workforce even if demand were to slow. While hurting corporate profits, that would reduce the risk of a recession, which means the Fed might have to keep rates higher for longer than the market is currently forecasting – a negative for both the stock and bond markets. Finally, while the unemployment rate is very low, it is a lagging indicator, tending to fall only after the economic growth turns negative.
- State finances in strong position. Thanks to a number of factors – including increased tax revenue, lingering pandemic stimulus funds and, at least in oil- and gas-rich states, boom times for the energy sector – 49 out of 50 states collected more revenue than they projected. Their strong surpluses put them in much better shape to deal with a possible recession. The median state had an estimated 42 days of spending in its rainy day fund at the end of 2022, or a total $135.5 billion. The numbers imply that a typical state could weather a roughly 12% drop in revenue over the course of a year, as opposed to only a 5% drop in 2001 and 2008, without cutting spending. On top of that, state and local governments still have between $150 billion and $200 billion in pandemic relief funds that have been allocated (mostly to education) but not yet spent. Their improved fiscal situation has led to 22 states cutting their income tax rates since 2021. However, the fact that states are in stronger fiscal situations and cutting taxes, while good for the economy, could make it more difficult for the Fed to achieve its goal of slowing demand in order to slow inflation.
- Monetary policy not yet truly restrictive. While the Fed has been raising rates, there are still negative real rates of interest on nominal bonds – rates are below both the annual rate of increase in the CPI and the core CPI. There is also much fiscal stimulus (just not as much as in 2020 and 2021), and corporate balance sheets remain quite strong. Not only have corporate profits been high, but corporations took advantage of historically low rates to refinance debt and lengthen maturities. And bank balance sheets are strong. Thus, systemic risks to the financial system are not here like they were in 2007. And there is no housing bubble.
- China has reopened. Following public protests of stringent COVID restrictions, China has begun to reopen its economy, the second largest in the world. Expectations are now for growth of about 5%, improving growth prospects around the globe, particularly for Asian and emerging market countries. However, an improving Chinese economy will increase demand for energy and other commodities, making it more difficult for the Federal Reserve to achieve its inflation objective.
The list of concerns regarding the economic outlook is unfortunately far longer than the list of positives. Having noted that the unemployment rate is a lagging economic indicator, we will look at three leading indicators.
Concerns for the economic outlook
- The LEI. The Conference Board Leading Economic Index®(LEI) for the U.S. fell again by 0.3% in February 2023, to 110.0 (2016 = 100) after also declining by 0.3% in January. It was down 3.6% over the six-month period between August 2022 and February 2023 – a steeper rate of decline than its 3.0% contraction over the previous six months (February-August 2022).
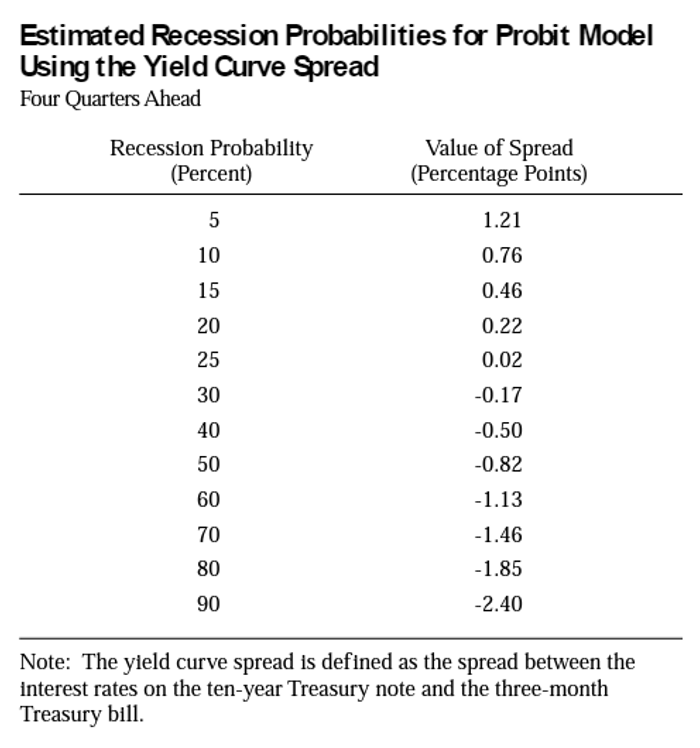
- Inverted yield curve. The yield curve has remained inverted at historically high levels. The authors of the Federal Reserve of New York’s study, “The Yield Curve as a Predictor of U.S. Recessions,” concluded: “The yield curve – specifically, the spread between the interest rates on the 10-year Treasury note and the three-month Treasury bill – is a valuable forecasting tool. It is simple to use and significantly outperforms other financial and macroeconomic indicators in predicting recessions two to six quarters ahead.” The reason for the relationship is that monetary policy has a significant influence on the yield curve spread and hence on real activity over the next several quarters. A rise in the short rate tends to flatten the yield curve as well as slow real growth in the near term, and expectations of future inflation and real interest rates contained in the yield curve spread play an important role in the prediction of economic activity. The following chart shows the probability of a recession depending on the slope of the yield curve. As of March 22nd, the spread between the three-month bill and the 10-year note had widened to 1.21%, indicating a probability of recession of more than 60%.
However, monetary policy is not yet truly restrictive, as the Fed funds rate is still below the year-over-year inflation rate. Thus, it seems likely the Fed will have to raise rates further and keep them higher for longer – a further tightening of monetary policy and increasing the risk of a recession. It could also increase the steepness of the curve, increasing the likelihood of a recession. However, the failure of SVB may constrain its actions.
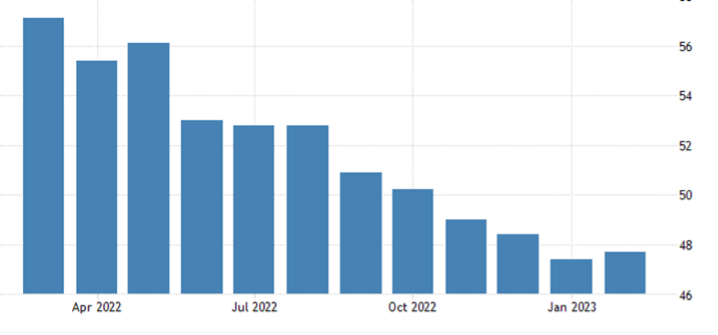
- Purchasing Manager’s Index (PMI). The manufacturing PMI measures the activity level of purchasing managers in the manufacturing sector and is a leading economic indicator. A reading above 50 indicates expansion in the sector; below 50 indicates contraction. As seen in the chart below, it has been giving negative signals since November.
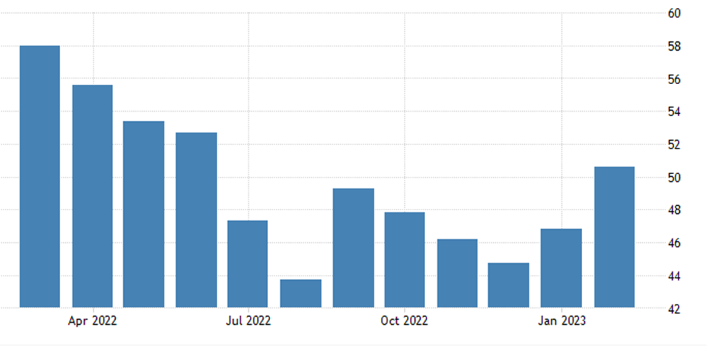
Similarly, the services sector PMI was below 50 for the seven months from July 2022 to January 2023 before rising to just over 50 in February. Thus, both the services and manufacturing sectors are sending warning signals about the risks of a recession.
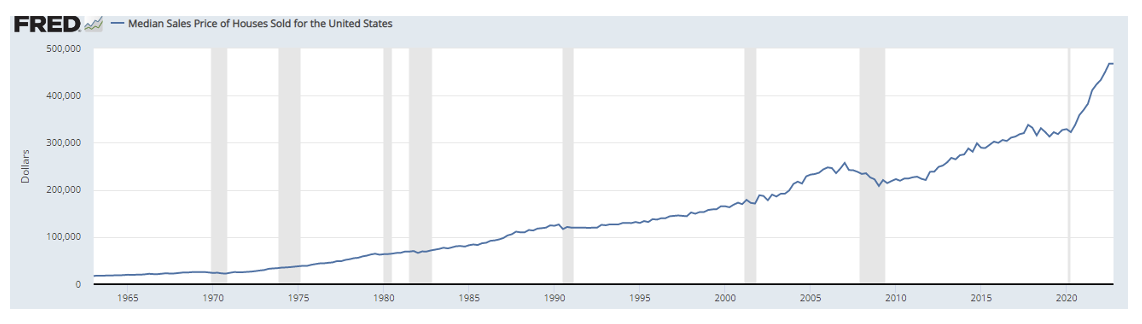
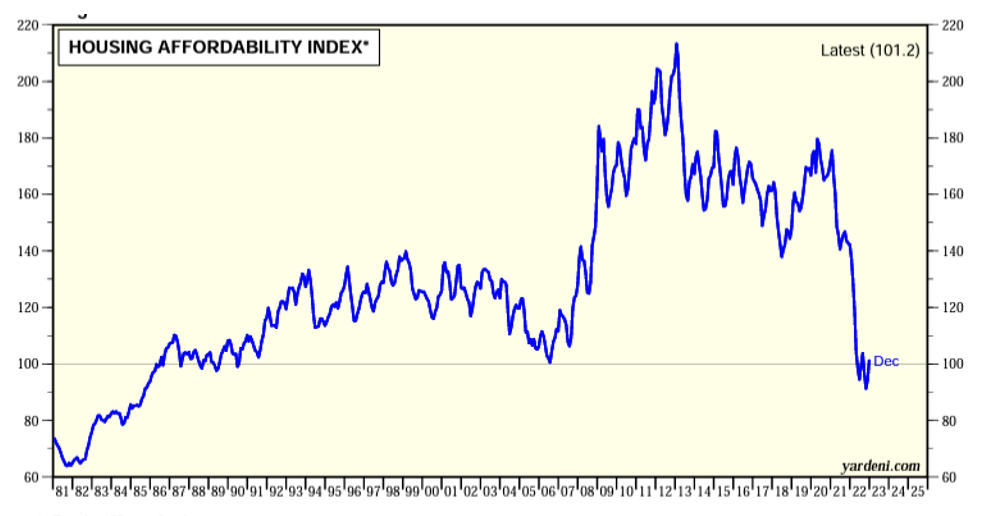
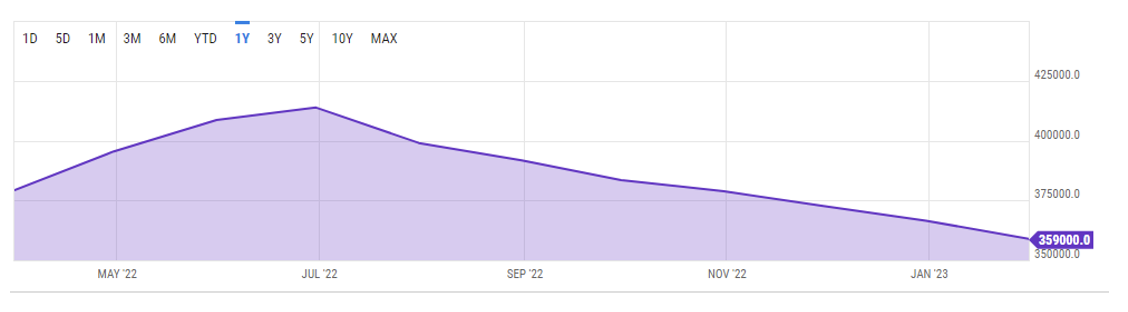
- Housing. The sharp rise in interest rates dramatically impacted the important housing sector of the economy – U.S. home purchases are at a 28-year low, and home sales posted a 12th straight monthly drop in January. Sales did pick up in February (rising 14.5%), though they were still down 22.6% from a year earlier. However, the national median existing-home sale price fell 0.2% in February from a year earlier, the first year-over-year decline since February 2012. The post-COVID increase in home prices, along with the rise in interest rates, pushed the Housing Affordability Index to the lowest levels in almost 40 years.
However, housing will benefit from the fall in longer-term interest rates that occurred when SVB failed. That drop will lead to an improvement in the affordability index.
While housing demand is weak, the good news is that it seems unlikely there will be a significant decline in housing prices like there was during the great recession of 2008 because the U.S. faces an estimated shortage of about 4 million homes. After the great recession, new home construction slowed dramatically, with fewer new homes built in the 10 years ending 2018 than in any decade since the 1960s. That helps explain why home prices were rising at dramatic rates (through mid-year 2022, the year-over-year increase in home prices was 18%) until the runup in mortgage rates from about 3% to about 7%.
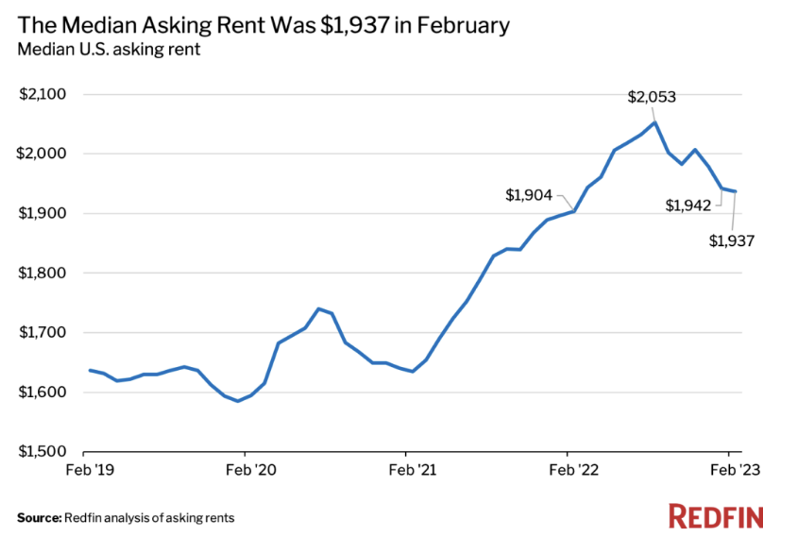
The shortage, and regulations that helped create the shortage (NIMBY, or “not in my backyard”), are why rents have been rising so dramatically. But that too has slowed. In January 2022, the national median rent had increased by 15.6% year over year. That increase led to a jump in supply – a result of a boom in apartment construction – which contributed to the slowdown in rent growth. The number of apartments under construction is up 24.9% year over year to 943,000, the highest level since 1974. The result is that rents were up just 1.7% in the 12 months ending February 2023, the smallest yearly change in nearly two years. Still, the median asking rent remained 21.4% higher than it was in February 2020, the month before the coronavirus was declared a pandemic. The increase in the Fed funds rate from 0% to 4.75%-5% led to a dramatic slowdown in new construction.
- Deglobalization. The pandemic exposed the risks of global supply chains, which had the benefit of holding down inflation. The replication of supply chains, and in particular the energy transition, is clearly inflationary because it is necessary to build out all the wind and solar power. Additionally, backup thermal capacity must be built and maintained, all during a period of tight labor markets without supporting infrastructure (e.g., roads, bridges, electric power) due to decades of underinvestment. Here’s an example. TSMC is a leading producer of semiconductors. It has begun the process of building one of its factories in Arizona. It has much higher operating costs, a lack of trained personnel and construction snags, all of which may result in U.S. chips costing 50% more to produce than the same chips in Taiwan. While deglobalization might be good for many workers, and for national security, it has negative implications for the fight against inflation.
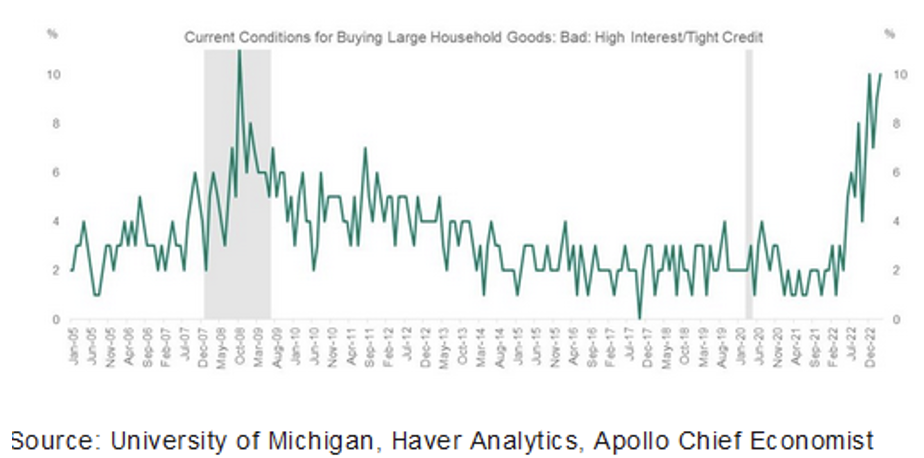
- Defaults increasing. Credit card debt is soaring, setting records, as consumers struggle to keep up with inflation. The average savings rate in the five years pre-pandemic was 7%. It has now fallen to 4.7%. At the same time, defaults have increased. The share of credit card users making payments that were at least 30 days late (early delinquencies) rose in the fourth quarter to 5.9% from 5.2% in the prior quarter. The share of payments that were 90 or more days late (serious delinquencies) rose to 4% last quarter from 3.7% in the prior quarter. These are early warning signs. Banks and direct lenders (such as Lending Tree) have responded by raising rates and tightening credit standards. The chart below from the University of Michigan survey shows that even before the SVB failure, credit conditions had tightened to levels last seen in 2008.
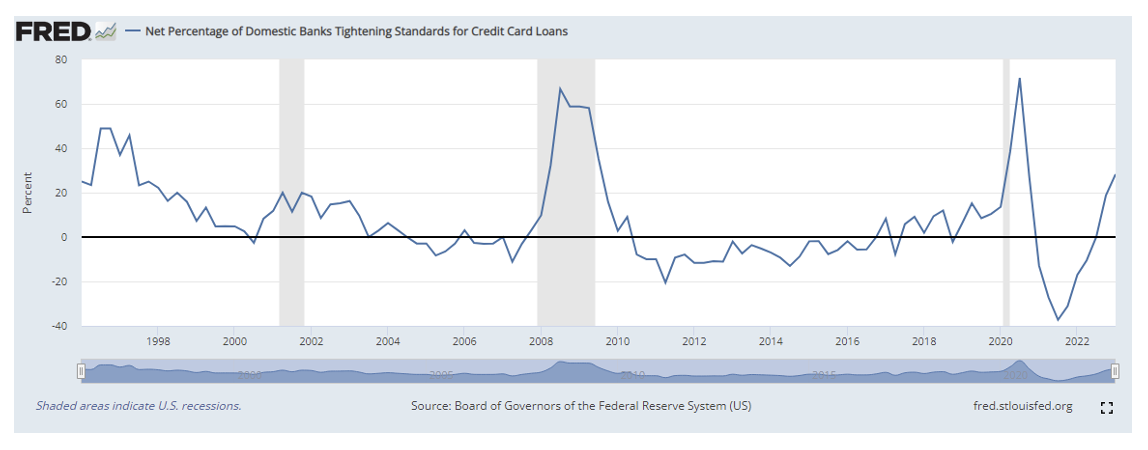
A wave of defaults also is hitting commercial real estate loans to office buildings due to rising rates and the shift to working at home. In response to the heightened risks, banks have tightened credit standards, making it less available and more expensive. Both are negatives for the economy. Similar problems have emerged with financing of leveraged buyouts, as credit has tightened and borrowing costs have risen dramatically. The result is that some banks are stuck holding on to loans they committed to but cannot bring to market. A good example is the loans committed to fund the privatization of Twitter. That has the potential to lead to significant stresses in financial markets, a negative for both the economy and markets.
- Declining labor productivity. The U.S. Bureau of Labor Statistics reported that annual average productivity decreased 1.7% from 2021 to 2022 – the largest annual decline in the measure since 1974, when productivity also decreased 1.7%. Unit labor costs increased 6.3% in 2022, though that slowed to 3.2% in the fourth quarter. Tight labor markets are likely to keep upward pressure on wages. Even with a slowdown in the economy, employers might be reluctant to let workers go because of the overall shortage of trained staff.
- Decreased role of manufacturing. Seventy years ago, almost one-third of the work force was engaged in the manufacturing sector of the economy, a cyclical sector that is much more vulnerable to increases in interest rates than the service sector (which accounts for more than 75% of the GDP).
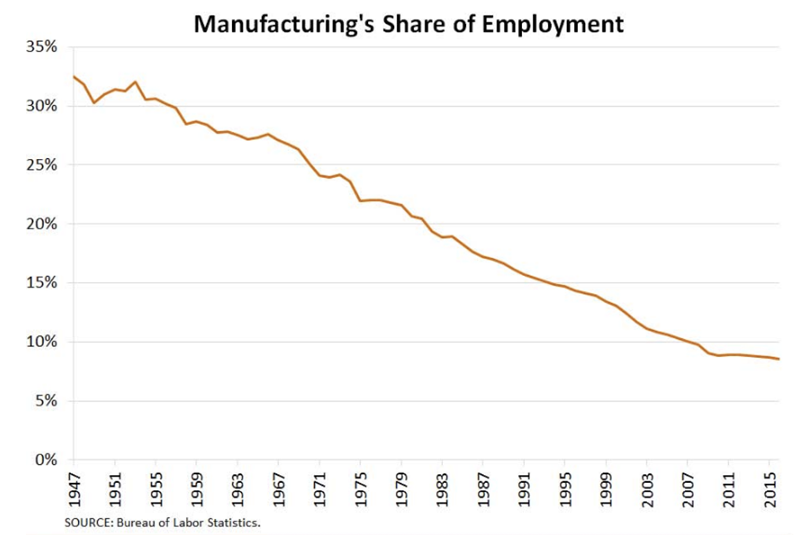
Today only 8% of the workforce is engaged in manufacturing. That shift could make it more difficult for the Fed to contain inflation, as it might have to raise interest rates more than currently expected to achieve a sufficient slowdown in total demand. That can be seen in the chart below, which shows continuing strong employment growth in the services sector.
Instead of the Fed funds rate peaking at perhaps 5%-5.25%, it might have to go to 6% or even higher. That would not be good for either stocks or bonds.
- Increases in corporate tax rates. Businesses are getting hit in 2023 with a variety of tax increases even as the risk of recession rises along with interest rates. The tax hikes are arriving for two reasons: provisions of the 2017 tax reform that are phasing out, and increases passed as part of the Inflation Reduction Act. (1) The 2017 tax reform spurred investment by letting businesses immediately deduct the full cost of hardware, like trucks and machines. The maximum early deduction drops this year to 80%, and it will continue to decrease each year until it disappears in 2026. (2) January 2022 marked the end of full expensing for corporate research and development. Companies could previously deduct R&D spending from their next tax bill but now must spread the deduction over several years (five years for domestic spending, 15 for international). (3) The cap on the business interest deduction dropped last year when the formula changed to exclude amortization. This is good tax policy, as the tax code should not subsidize debt over equity. However, it comes at a bad time due to the combination of rising interest rates and risk of recession. (4) The Inflation Reduction Act created a new corporate minimum tax, a 15% levy that hits large U.S. firms earning more than $1 billion in book income annually. The tax will fall heavily on industries like real estate and mining that currently benefit from Congressional carve-outs. (5) A 1% stock buyback tax is applied to repurchases of stock by publicly traded companies, which is an alternative way of taxing dividends. These increases will not only negatively impact corporate earnings, but the more you tax investment, the less investment you get, negatively impacting the economy as well.
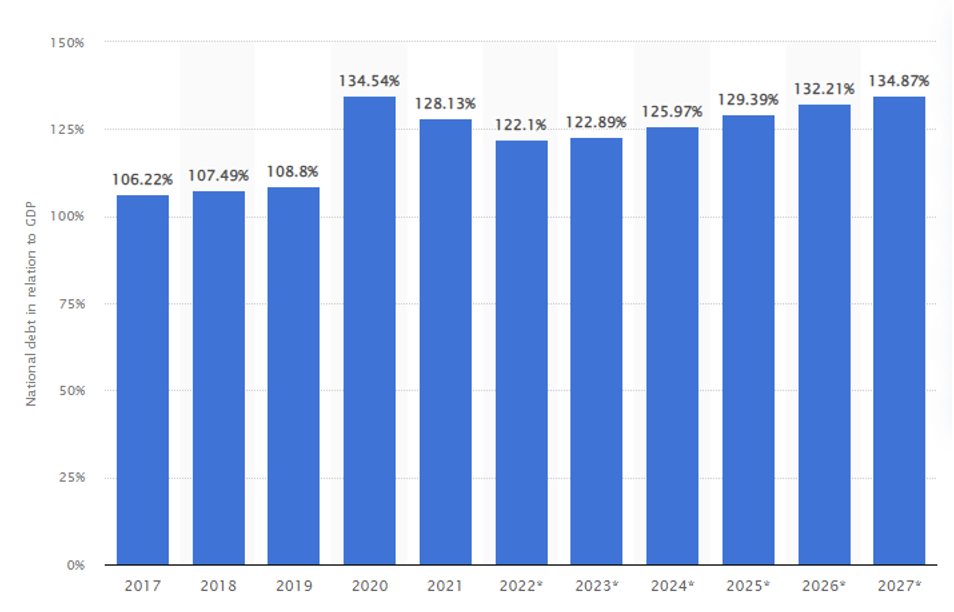
- Debt-to-GDP ratio rising. The Congressional Budget Office projects a federal budget deficit of $1.4 trillion for 2023, with the deficits rising in future years. For example, the debt will swell to 6.1% of GDP in 2024 and 2025 and will reach 6.9% by 2033. Rising interest rates, required to fight inflation, only worsen the problem. The concern for the markets is that high levels of debt-to-GDP can adversely impact medium- and long-run economic growth for the following reasons:
- High public debt can negatively affect capital stock accumulation and economic growth via heightened long-term interest rates, higher distortionary tax rates and inflation, and by placing future restraints on countercyclical fiscal policies that will be needed to fight the next recession (which may lead to increased volatility and lower growth rates).
- Large increases in the debt-to-GDP ratio could lead to not only much higher taxes, and thus lower future incomes, but also intergenerational inequity.
- Increased government borrowing competes for funds in capital markets, crowding out private investment by raising interest rates. Higher rates, along with higher taxes, increase the cost of capital and thus stifle innovation and productivity, reducing economic growth.
- If the government’s debt trajectory spirals upward persistently, investors may start to question the government’s ability to repay debt and therefore demand even higher interest rates.
- Growing interest payments consume an increasing portion of the federal budget, leaving lesser amounts of public investment for research and development, infrastructure and education.
The empirical evidence supports theory. Reviews of the literature, including studies such as the 2020 paper, “Debt and Growth: A Decade of Studies,” and the 2021 paper, “The Impact of Public Debt on Economic Growth,” have found that at low debt levels, increases in the debt ratio provided positive economic stimulus in line with conventional Keynesian multipliers. However, once the debt ratio reached higher levels (between 75% and 100% of GDP), further increases in the debt level as a percentage of GDP had a negative impact on economic growth. As a specific example, the authors of the 2013 study, “Does High Public Debt Consistently Stifle Economic Growth?” examined the relationship between public debt and GDP growth among 20 advanced economies in the post-war period. They found a negative relationship between debt-to-GDP and economic growth: Growth in countries with a debt-to-GDP ratio between 60% and 90% was 3.2%, but was 2.4% for countries with a ratio between 90% and 120%, and fell to just 1.6% for countries with a ratio between 120% and 150%. The problem for the U.S. is that we are now well within that danger zone.
Given the empirical findings, investors’ financial plans should at least consider the prospect of a negative impact on economic growth caused by rising debt and that it could lead to lower future equity returns.
Having reviewed the positives and the concerns, and keeping in mind that everything reviewed is well known by the markets (and thus incorporated into prices), what do professional economists forecast for the economy? The consensus forecast should be considered “the wisdom of crowds.”
Philly Fed’s First Quarter 2023 Survey of Professional Forecasters
The first quarter 2023 survey released in February (pre-SVB’s failure) looks somewhat better now than it did in the prior survey. On an annual-average over annual-average basis, the forecasters expect real GDP to increase 1.3% in 2023, up from the projection of 0.7% in the survey of three months ago. The third quarter is the only one with a forecast of negative growth, a fall of just -0.1% in the GDP. So no recession but, rather, a “soft landing.” They also forecast that economic growth will remain weak over the next few years: 1.4% in 2024, 2.2% in 2025 and 1.5% in 2026. The forecasters predict the unemployment rate will increase from its current rate of 3.4% to 4.1% in the fourth quarter of 2023. On an annual-average basis, they expect the unemployment rate to be 3.8% this year. In terms of inflation, the consensus forecast is for the CPI to fall to 3.1% in 2023, 2.5% in 2024 and 2.4% in 2025.
The following chart shows the mean probabilities of real GDP growth in 2023. The consensus is that the risk of recession in 2023 has decreased.
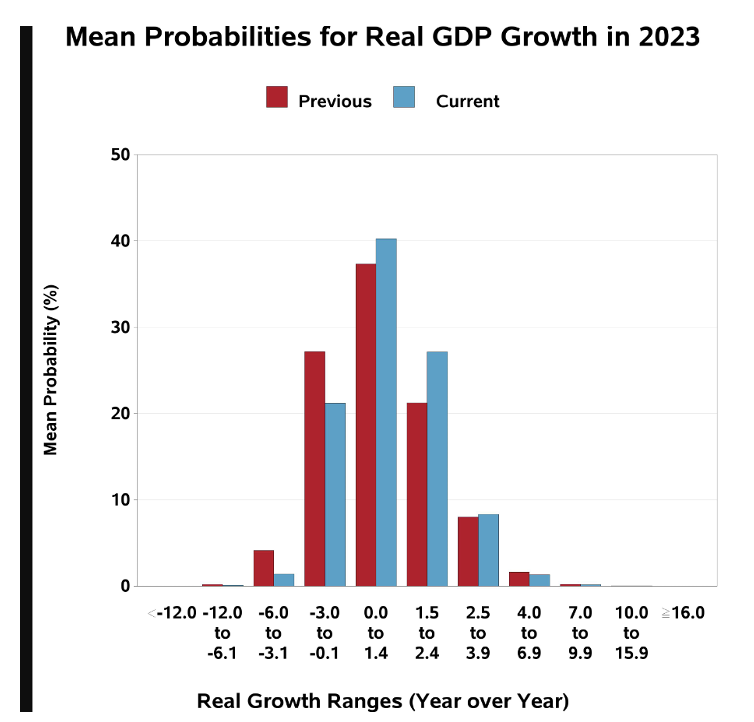
As the chart implies, the future is unknowable. Thus, investors should treat the mean forecast of 1.3% growth in 2023 in a probabilistic, not deterministic, way. Another way to think about it is that the forecasts put the odds of a negative quarter of economic growth at 40% in the first quarter, 42% in the second quarter, 45% in the third quarter and 41% in the fourth quarter. The view is that there is some significant risk of a recession.
The consensus forecast also calls for moderating inflation, though not sufficient to reach the Fed’s objective of 2%. The forecast for the CPI in 2023 increased slightly from the prior quarter’s forecast of 3.2%, to 3.4%. However, it does call for inflation to fall from a fourth quarter 2022 forecast of 4.6% to 3.7%, 3.2% and 2.8% over the following three quarters. Such a trend would likely cause the Fed to pause hiking rates, as the Fed funds rate would then be well above the CPI. However, that doesn’t mean it would pivot to cutting rates, as inflation would still be running hotter than its 2% target.
Having reviewed the consensus forecast of professional economists (the wisdom of the crowd) for the economy, there are also a host of geopolitical risks (potential black swans) that could impact the economy and markets.
Geopolitical risks
While there are always uncertainties created by geopolitics, one would be hard-pressed to think of a time, other than during a world war, when we faced so many at once. Not only is there the ongoing war in Ukraine and the risks it presents, but there is increased tension between the U.S. and China, now the world’s second largest economy. There are also regular threats from North Korea. Turning to Iran, the International Atomic Energy Agency reported it found traces of near weapons-grade enriched uranium (84%) during a January 22 inspection. Israel views this as an existential threat and feels it might be forced to act before Russia provides Iran with increased defensive capabilities that could prevent Israel from acting. And with the election of a far-right government in Israel, tensions in the West Bank and Gaza have increased.
There is also a significant risk of a clash over the U.S. debt ceiling, which could come to a head as early as June. The last time that potential crisis caused concerns was in 2011. From May through September of that year, the S&P 500 lost about 16%.
While each of these risks has a small chance of occurring, investors should make sure their portfolios are not taking more risk than they have the ability, willingness or need to take, avoiding the mistake of treating even the highly improbable as impossible.
Having reviewed the good economic news as well as the risks investors should consider, what is the outlook for the financial markets?
Markets
While investors have many reasons to be less than optimistic as central banks around the globe engage in more restrictive monetary policy to fight the unexpected surge inflation, valuations already reflect that concern. Morningstar shows that Vanguard’s U.S. Total Stock Market Fund (VTSMX) has a P/E of just 17.6, well down from last year’s level. Its Developed Markets Index Fund (VTMGX) has a P/E of about 12.6, and its Emerging Markets Stock Index Fund (VEIEX) has a P/E of less than 11.6. Value stocks are trading as if we were already in a serious recession. As live examples, Avantis’ U.S. Small-Cap Value ETF (AVUV) is trading at 8.5 times earnings; its International Small-Cap Value ETF (AVDV) is trading at a multiple of 7.8; and its Emerging Markets Value ETF (AVES) is trading at a multiple of just 7.4. As good a predictor as we have of future real returns is the earnings yield (E/P). It doesn’t matter to markets whether the news is good or bad, only whether it is better or worse than expected. At least for value stocks, the markets seem to be expecting almost the worst possible outcomes, as valuations are near levels reached at the depth of the Great Recession.
The stock market is a leading economic indicator. As such, markets tend to bottom well before economic indicators such as GDP, payrolls, earnings, housing, peak delinquencies in corporate debt and household credit. As a reminder, during the great recession, while the economy did not bottom out until the end of the second quarter of 2009 and the unemployment rate kept rising through October, the stock market bottomed out on March 9, 2009.
What will happen to corporate profits given what seems likely to be some slowdown in economic activity while labor markets remain tight? The current 2023 earnings forecast for the S&P 500 Index is about $222. With the S&P 500 at about 4,000, that’s a forward-looking P/E of about 18. That’s historically high with a Fed funds rate of 5%, and with the risk of a recession and risk to earnings. If corporate profits get squeezed because of wage pressures and a slower economy and earnings were to fall to, say, $200 (as would likely be the case even in a mild recession), equities could come under significant pressure, especially if the Fed has to raise rates much beyond 5% to subdue inflation.
What should investors do?
Be prepared for more volatility, not only because of the potential risks but also because the dramatic increase in the market share of passive investing has negatively impacted liquidity. And because of the regulatory changes made after the great recession (the Volcker rule), banks can no longer hold significant trading assets on their balance sheets. The result is that they no longer act as significant providers of liquidity, which has led to increased bid-offer spreads and volatility.
Evidence of the reduction in liquidity was presented by Xavier Gabaix and Ralph Koijen in their March 2022 study, “In Search of the Origins of Financial Fluctuations: The Inelastic Markets Hypothesis.” They found that today, “Investing $1 in the stock market increases the market’s aggregate value by about $5.”
There are two ways to address the risks. The first is to reduce exposure to stocks and longer-term bonds and bonds with significant credit risks while increasing your exposure to shorter-term, relatively safe credit risks. By raising interest rates dramatically, the Fed has made that alternative more attractive than it has been in years. For example, for those concerned about inflation, the yield on five-year TIPS has increased from about -1.6% at the start of the 2021 to about 1.25% on March 22, 2023.
Another way to address the risks is to diversify your exposure to risk assets to include other sources of risk that have low to no correlation with the economic cycle risk of stocks and/or the inflation risk of traditional bonds but have also provided risk premiums. The following are alternative assets that may provide diversification benefits. Alternative funds carry their own risks; therefore, speak to your financial professional about your own circumstances prior to making any adjustments to your portfolio.
- Reinsurance. The asset class looks attractive, as losses in recent years have led to dramatic increases in premiums, and terms (such as deductibles) have become more favorable.
- Private middle-market lending (specifically senior, secured, sponsored corporate debt). This asset class also looks attractive, as base lending rates have risen sharply, credit spreads have widened, lender terms have been enhanced (upfront fees have gone up) and credit standards have tightened (stronger covenants).
- Consumer credit. While credit risks have likely increased, lending rates have risen sharply, credit spreads have widened, and credit standards have tightened.
- Long-short factor funds
- Commodities
- Trend following (time-series momentum).
As Kevin Grogan and I demonstrated in our book, Reducing the Risk of Black Swans, adding unique risks has historically reduced the downside tail risk associated with conventional stock and bond portfolios.
Larry Swedroe is head of financial and economic research for Buckingham Wealth Partners.
For informational and educational purposes only and should not be construed as specific investment, accounting, legal, or tax advice. Certain information is based on third party data and may become outdated or otherwise superseded without notice. Third party information is deemed to be reliable, but its accuracy and completeness cannot be guaranteed. Indices are not available for direct investment. Their performance does not reflect the expenses associated with the management of an actual portfolio nor do indices represent results of actual trading. Information from sources deemed reliable, but its accuracy cannot be guaranteed. Performance is historical and does not guarantee future results. All investments involve risk, including loss of principal. Individuals should speak with their qualified financial professional based on their own circumstances to discuss the ideas presented in this article. By clicking on any of the links above, you acknowledge that they are solely for your convenience, and do not necessarily imply any affiliations, sponsorships, endorsements or representations whatsoever by us regarding third-party websites. We are not responsible for the content, availability or privacy policies of these sites, and shall not be responsible or liable for any information, opinions, advice, products or services available on or through them. Neither the Securities and Exchange Commission (SEC) nor any other federal or state agency have approved, determined the accuracy, or confirmed adequacy of this article. The opinions expressed here are their own and may not accurately reflect those of Buckingham Strategic Wealth, LLC or any of its affiliates.
Membership required
Membership is now required to use this feature. To learn more:
View Membership BenefitsSponsored Content
Upcoming Virtual Events View All


