The Never-Ending Failure to Identify Future Mutual Fund Outperformers
Membership required
Membership is now required to use this feature. To learn more:
View Membership Benefits Countless investment practitioners and academics have unsuccessfully searched for the metric that can successfully identify future mutual fund outperformers. What follows is the saga of the latest failed attempt.
Recently, the search for outperformance has focused on the theme that superior stock selection ability is positively associated with the distinctiveness (referred to as “active share”) of a fund’s investment decisions – with distinctiveness based on either a fund’s portfolio holdings or the fund’s returns.
My February 21, 2022, Advisor Perspectives article examined the evidence from empirical research on the ability of active share to predict future performance of actively managed mutual funds. For example, in its November 2021 study, “Is Active Share Unattractive?,” Morningstar found that despite exhibiting greater risk, high-active-share funds failed to deliver superior net-of-fees results in any category. Despite that, active share has become an increasingly popular metric in terms of both reporting and evaluation. Given the evidence, there isn’t a logical explanation for that phenomenon other than that high active share is a necessary ingredient for outperformance.
Unfortunately, it’s not a sufficient one.
When active share alone failed to identify future outperformers, Martijn Cremers, Jon Fulkerson and Timothy Riley, authors of the study, “Active Share and the Predictability of the Performance of Separate Accounts,” published in the first quarter 2022 issue of the Financial Analysts Journal, tested whether active share combined with past performance could identify future winners. Confirming prior research, they found that single sorts on either active share or past performance failed. And while they found some evidence that the double sort helped with separately managed institutional accounts – within the top 20% of active share, a portfolio of those within the top 20% of past performance had a statistically significant (at the 5% confidence level) net alpha of 1.38% per year (t-stat = 2.11) – unfortunately, they did not find any statistically significant evidence with mutual funds. This is important as a test of the robustness of their findings. Even the finding regarding separate accounts was of limited value, as the future outperformance was limited to small-cap stocks (which make up only about 10% of the total market capitalization). And there is also the risk of data mining – torturing the data until you find correlation. Thus, the quest continued.
Another attempt was made by ZhengAi He and Eric Tan with their study, “Shared Experience in Top Management Team and Mutual Fund Performance,” published in the July 2022 issue of The Journal of Portfolio Management. They examined the role of top management teams (TMTs) in the U.S. mutual fund industry, focusing on the shared experience between fund managers. While He and Tan found that an increase in shared experience between the top two managers was associated with an increase in fund performance, they also found that team size was negatively correlated with future performance – as team size increased, there was no longer any statistically significant evidence of outperformance, failing a test of robustness that shared experiences lead to superior performance. In addition, there has been a strong industry trend toward increasing the size of teams.
When He and Tan split their sample into three equal terciles (low, medium and high) based on the level of disruption created due to the departure of fund managers, they found that the value added of having high shared-experience TMTs disappeared.
He and Tan’s findings did not provide much hope for investors using actively managed funds because, while they found that shared experiences led to higher concentration and higher active share, the evidence suggests that neither provides much if any information in terms of future performance. In addition, the finding that teams with more than two managers had no statistically significant outperformance limits the value to restricting purchases to just two-manager teams. However, doing so would leave investors vulnerable to a fund increasing the number of managers and running the risk of disruption if a manager leaves, as funds with disruptions showed no statistically significant outperformance. Further, the finding that a fund’s age was negatively correlated with performance (which could be an indicator of survivorship bias) also creates risks for investors choosing active funds because their performance tends to deteriorate over time.
But the quest continued.
Latest research
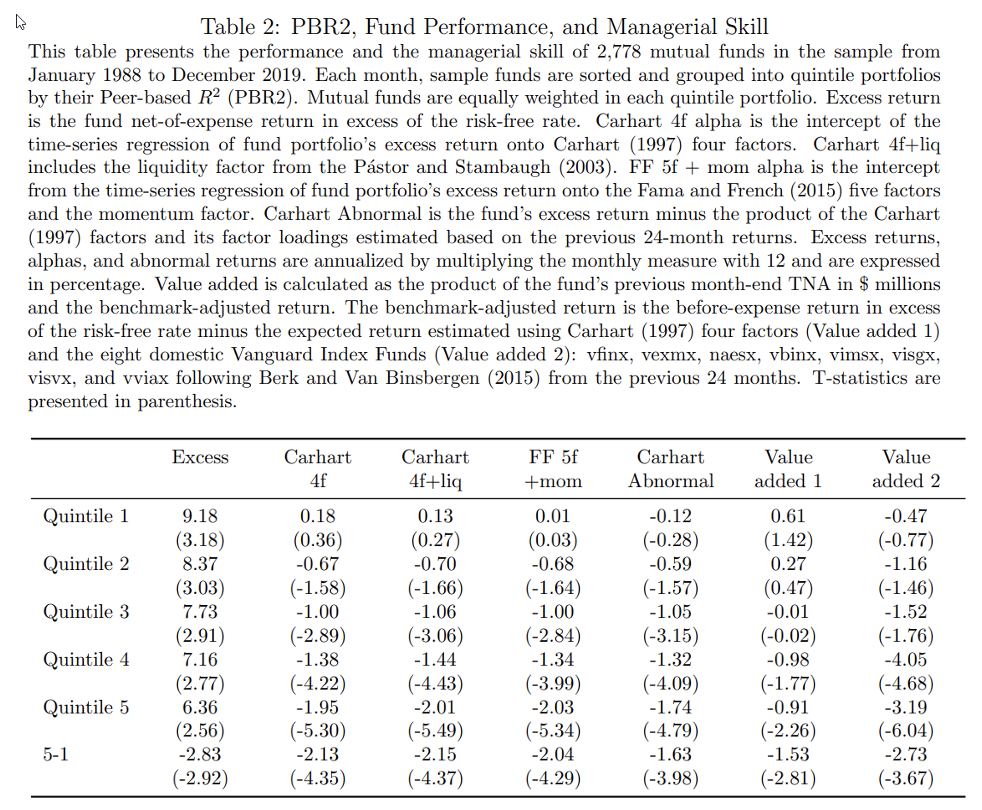
Tong Yao and Jie Ying, authors of the November 2022 study “Peer-based R2 and Mutual Fund Performance,” constructed a new measure of fund distinctiveness, which they claimed has significant power to predict fund performance and remain robust for long horizons of at least four quarters after the fund ranking (note that for taxable investors, changing funds every year or so is not a good way to keep taxes low). They termed their measure peer-based R2 (PBR2). It follows the popular regression-based approach; however, instead of using a preselected set of common factors as a benchmark, they gave each stock held by a fund its own benchmark based on the stock’s economic peers (equal weighting companies in the same industry). The PBR2 is thus the fraction of the return variations of the stocks held by the fund that can be explained by the variations of the stocks’ industry peer return. Their data sample consisted of actively managed domestic mutual funds in the U.S. from January 1988 to December 2019. Following is a summary of their findings:
- Funds with lower PBR2 tended to have better past investment performance measured by the Carhart four-factor (beta, size, value and momentum) alpha, higher expense ratios, higher turnover, fewer total net assets and younger age.
- PBR2 had the power to predict fund performance during a long sample period dating back to the 1980s as well as during the more recent period – the results were robust to variations in fund performance measures and definition of stock peers.
- The funds with the highest PBR2 (5th quintile) earned significantly negative risk-adjusted returns and underperformed the funds with the lowest PBR2 (1st quintile) across all the risk factor models.
- Investors pay attention to the traditional fund distinctiveness measures (such as active share), which affects fund performance via decreasing returns to scale. However, fund flows have not reacted correctly to PBR2, as high-PBR2 funds have been growing in market share yet underperforming compared to low-PBR2 funds.
What wasn’t said
No matter the benchmark, including Vanguard’s index funds, low-PRB2 funds (Q1) outperformed high PRB2 funds (Q5), but there are serious issues with the conclusions drawn. Table 2 above provides important information for investors.
None of the outperformance of Q1 funds (except for relative to riskless one-month Treasury bills, which is just capturing exposure to market beta) was statistically significant, and in two cases it was negative. In other words, the findings are not reliable. In all quintiles, including Q1, the active funds generated negative alphas compared to Vanguard’s index funds (although the results were only statistically significant for Q3-5). Thus, while low-PBR2 funds outperformed high-PBR2 funds, they underperformed low-cost, and almost certainly more tax-efficient, index funds. Another important point is that the authors annualized returns by multiplying monthly returns by 12, which is incorrect. Investors earn compound returns and volatility is a drag.
Perhaps the quest has become so desperate that researchers are happy to settle for finding a way to select the active funds that will perform best relative to their active peers instead of finding the metric that will allow investors to outperform systematic strategies such as index funds. Since hope endures, and the rewards for finding the magical formula would be high, the quest will continue.
Finally, it is possible that the use of an equal-weighted industry index in the calculation of PBR2 may be a main driver of the fact that the (equal-weighted) quintile of high-PBR2 funds generated large and reliably negative abnormal returns (see Table 2 above). The equal-weighted industry return gives disproportionally high weight to the smallest stocks within an industry. Since PBR2 is the R2 from cross-sectional regression of fund-holding returns on their equal-weighted industry returns, the measure is likely to be higher for funds tilted toward smaller stocks. Fama and French (2015, 2016) showed that large and reliably negative five-factor abnormal returns tended to be confined to small-growth-low profitability and small-high-investment stocks. In addition, they showed that it is the performance of these groups of stocks that the model cannot fully explain. As such, the reliably negative abnormal returns to high-PBR2 funds could simply be a result of such funds, on purpose or inadvertently, tilting toward small-growth-low profitability and small-high investment stocks.
Investor takeaways
When reviewing the findings of research papers, investors must analyze the data and not just accept the authors’ conclusions as stated.
Postscript: A special note of thanks to Namiko Saito, co-head of strategy research at Dimensional for her assistance.
Larry Swedroe is head of financial and economic research for Buckingham Wealth Partners.
For informational and educational purposes only and should not be construed as specific investment, accounting, legal, or tax advice. Certain information is based upon third party data and may become outdated or otherwise superseded without notice. Third party information is deemed to be reliable, but its accuracy and completeness cannot be guaranteed. Neither the Securities and Exchange Commission (SEC) nor any other federal or state agency have approved, determined the accuracy, or confirmed adequacy of this article. By clicking on any of the links above, you acknowledge that they are solely for your convenience, and do not necessarily imply any affiliations, sponsorships, endorsements or representations whatsoever by us regarding third-party websites. We are not responsible for the content, availability or privacy policies of these sites, and shall not be responsible or liable for any information, opinions, advice, products or services available on or through them. The opinions expressed here are their own and may not accurately reflect those of Buckingham Strategic Wealth® or its affliates. LSR-22-425
Membership required
Membership is now required to use this feature. To learn more:
View Membership BenefitsSponsored Content
Upcoming Virtual Events View All


