Advisor Perspectives welcomes guest contributions. The views presented here do not necessarily represent those of Advisor Perspectives.
Opponents of passive, index-based investing frequently claim that large-cap stocks are overvalued, and a market-cap-weighted index unduly exposes investors to those mispriced securities. That is a false statement.
As chief research officer for Buckingham Wealth Partners, I have often been asked about the claim by Robert Arnott, Jason Hsu and Philip Moore, authors of the paper, “Fundamental Indexation,” that “capitalization weighting assuredly gives additional weight to stocks that are currently overpriced relative to their (unknowable) discounted future cash flows (the true fair value), and reduces weights in stocks that are currently trading below that true fair value. This leads to a natural performance drag in capitalization-weighted and other price weighted portfolios.” This argument has been used as a criticism of total market-cap funds and other index and systematic strategies that use market-cap weighting.
Is that claim correct?
If the largest stocks are the most overvalued, we should see: 1) greater persistence of active managers in large stocks than in small stocks, and 2) anomalies to asset pricing models are greater in large than small stocks.
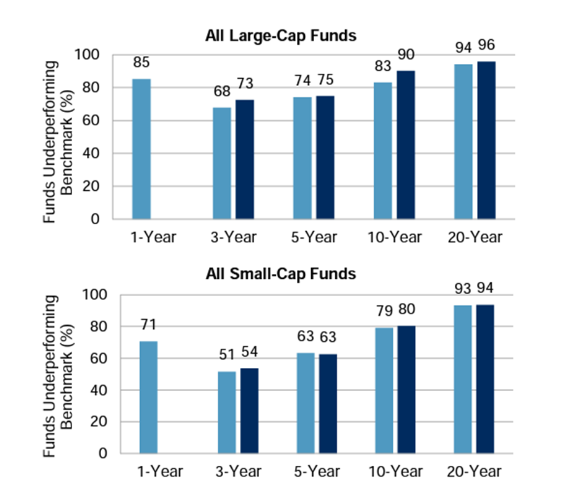
For evidence on the persistence of performance of active managers, we can turn to Standard & Poor’s 2021 SPIVA Active Versus Passive Scorecard.
SPIVA results
While just 6% of U.S. active small-cap funds outperformed their risk-adjusted benchmarks over the 20-year period ending in 2021, an even smaller 4% of active U.S. large-cap funds beat their benchmarks. If the largest stocks were the most mispriced, we should see evidence of that in greater levels of outperformance by active managers exploiting the mispricings, especially since larger stocks have lower trading costs, reducing the hurdles to generating alpha. Yet, we saw that the opposite was true. Large-cap funds showed lower percentages of outperformance over one-, three-, five- and 10-year periods as well. The average (equal weighted) active large-cap fund underperformed the S&P 500 by 1.68 percentage points over the 20-year period. On an asset-weighted basis, the underperformance was 1.10 percentage points.
Where’s the evidence of all the mispricing that was available to be exploited?
- Looking at the international evidence, S&P found that virtually the same percentage of active large-cap funds underperformed as did active small-cap funds (87.7% versus 87.9%). Again, even given the lower trading costs of large caps, reducing the hurdle to outperform, we don’t see any evidence to support the claim of more mispricing in larger stocks.
As our second test of whether there is evidence of more mispricing in large than small stocks, we can turn to the literature on anomalies – which can be considered mispricings relative to workhorse asset pricing models. If large caps are more overvalued, we should see evidence that the anomalies are greater in large stocks than in small stocks.
Are anomalies greater in large versus small stocks?
In their 2017 study, “Mispricing Factors,” Robert Stambaugh and Yu Yuan identified 11 anomalies:
-
Failure Probability: Stocks with a high probability of failure have lower future returns.
-
O-score: Stocks with higher O-scores (a higher probability of bankruptcy) have lower future returns compared to stocks with lower scores.
-
Net Stock Issuances: The stocks of firms that issue equity underperform the stocks of non-issuers.
-
Composite Equity Issuance: Firms with higher equity issuance underperform firms with lower measures.
-
Accruals: Stocks with high accruals underperform stocks with low accruals.
-
Net Operating Assets: Stocks with higher net operating assets underperform stocks with lower net operating assets.
-
Momentum: Stocks with higher past performance outperform stocks with lower past performance.
-
Asset Growth: Stocks with higher asset growth have lower future returns.
-
Return on Assets: Stocks with higher return on assets have higher future returns.
-
Investment-to-Assets: Stocks with higher past investment (scaled by total assets) have lower future returns.
That anomalies such as the poor performance of equities with lottery-like distributions (such as penny stocks, IPOs, stocks in bankruptcy, and small growth stocks with high investment and low profitability) can persist is attributed to what is referred to as “limits to arbitrage,” which can prevent sophisticated investors from fully correcting mispricings. The limits-to-arbitrage literature provides several explanations for why the anomalies may not completely vanish:
- Many institutional investors (such as pension plans, endowments and mutual funds) are prohibited by their charters from taking short positions.
- Shorting can be expensive. One has to borrow a stock to go short, and many stocks are costly to borrow because supplies of available stock from institutional investors are low – market frictions prevent prices from being fully corrected.
- Investors are unwilling to accept the risks of shorting because of the potential for unlimited losses. Even traders who believe that a stock’s price is too high know they can be correct in the long term (the price may eventually fall) but still face the risk that the price will go up in the short term before it eventually goes down. Such a price move, requiring additional capital, can force the traders to liquidate at a loss.
Stambaugh and Yuan found that the largest anomalies (mispricings) tended to occur not in large stocks but in small stocks, which are costly to trade in large quantity, both long and especially short (because the share volume available to borrow is limited and borrowing costs are often high) – market frictions prevented prices from being fully corrected. As further evidence of more mispricing in small rather than large stocks, having built a four-factor model with two “mispricing” factors in addition to market and size factors, they found that their model accommodated a large set of anomalies better than notable four- and five-factor alternative models and that their size factor revealed a small-firm premium nearly twice usual estimates (at 46 basis points per month), and it was highly significant (t-stat of about 4)!
Their findings were consistent with those of Clifford Asness, Andrea Frazzini, Ronen Israel, Tobias Moskowitz and Lasse Pedersen, authors of the study, “Size Matters, If You Control Your Junk,” who found that the size premium became substantially greater when controlling for other stock characteristics potentially associated with mispricing.
As further evidence that the premise that cap weighting leads to the largest stocks being the most overvalued, we will review the research on the role of investor sentiment in asset pricing.
Investor sentiment
Investor sentiment refers to the general mood investors exhibit toward a particular market or asset. Sentiment can be an important determinant of investment performance because investors who exhibit relatively high sentiment tend to be overconfident and engage in excessive trading, resulting in subpar investment performance because they are trading on “noise” and emotions. Such activity can lead to mispricing. Eventually, any mispricing would be corrected when the fundamentals are revealed, making investor sentiment a contrarian predictor of stock market returns.
Examples of times when investor sentiment ran high are the 1968-69 electronics bubble, the biotech bubble of the early 1980s, and the dot-com bubble of the late 1990s. Sentiment fell sharply, however, after the 1961 crash of growth stocks, in the mid-1970s during the oil embargo, and in the crash of 2008.
Malcolm Baker and Jeffrey Wurgler constructed an investor sentiment index based on five metrics: the value-weighted dividend premium (the difference between the average market-to-book ratio of dividend payers and nonpayers), the first-day returns on initial public offerings (IPOs), IPO volume, the closed-end fund discount, and the equity share in new issues. Originally, the Baker-Wurgler index included a sixth metric; however, the NYSE turnover ratio was dropped in the newest update. (Data is available at Wurgler’s New York University web page.) Does investor sentiment (the psychology of crowds) affect stock prices, leading to mispricings?
Baker, Wurgler and Yu Yuan, authors of the study, “Global, Local, and Contagious Investor Sentiment,” found that while there is a strong negative relationship between investor sentiment and stock returns (high investor sentiment predicts low future returns and vice versa), the effect of sentiment was much smaller on large stocks, as they are relatively easier to arbitrage and value. Once again, we see that mispricings (in this case caused by high investor sentiment) have been greater in small than in large stocks.
Investor takeaways
The overwhelming body of evidence, as seen in the SPIVA results, demonstrates that while markets are not perfectly efficient (or we would not have Stambaugh’s 11 anomalies), they are sufficiently efficient to make active management a loser’s game. And the evidence we reviewed demonstrates that the claim that, by definition, market-cap weighted indices (and other systematic strategies that market-cap weight their eligible universe) overweight the most overpriced stocks is not justified. In fact, the evidence suggests that exactly the opposite is true – if there are mispricings, they will tend to be greater in smaller stocks due to their greater limits to arbitrage.
Larry Swedroe is the director of research for The BAM Alliance, a community of more than 140 independent registered investment advisors throughout the country.
For informational and educational purposes only and should not be construed as specific investment, accounting, legal, or tax advice. Certain information is based upon third party data and may become outdated or otherwise superseded without notice. Third party information is deemed to be reliable, but its accuracy and completeness cannot be guaranteed. By clicking on any of the links above, you acknowledge that they are solely for your convenience, and do not necessarily imply any affiliations, sponsorships, endorsements or representations whatsoever by us regarding third-party websites. We are not responsible for the content, availability or privacy policies of these sites, and shall not be responsible or liable for any information, opinions, advice, products or services available on or through them. The opinions expressed by featured authors are their own and may not accurately reflect those of Buckingham Strategic Wealth® or Buckingham Strategic Partners®, collectively known as Buckingham Wealth Partners. Neither the Securities and Exchange Commission (SEC) nor any other federal or state agency have approved, determined, or confirmed the adequacy of this article. LSR-22-370
Read more articles by Larry Swedroe
 Advisor Perspectives welcomes guest contributions. The views presented here do not necessarily represent those of Advisor Perspectives.