Managing Taxes in Retirement: Income Thresholds versus Incremental Average Tax Rates
Membership required
Membership is now required to use this feature. To learn more:
View Membership Benefits This is the first in a series of articles that will explore tax-efficient retirement distribution strategies. The conventional retirement strategy is to spend taxable assets first, then tax-deferred (IRA) assets, and then tax-exempt (Roth IRA) assets. There is wide consensus that more tax-efficient distribution strategies are possible, including the strategic use of Roth conversions, and this series provides a deeper dive into these aspects.
I will simulate different strategies to determine which provides the greatest tax efficiency in terms of supporting the most after-tax spending and legacy for retirees. I will focus on how to source retirement spending needs as well as deciding whether to generate additional taxable income through Roth conversions. Though this article will use a fixed return assumption for the investment portfolio, I will shift into investigating these assumptions with volatile market returns in future articles.
These articles build on research popularized by William Reichenstein, which aims to understand how to strategize the withdrawal order sequencing between taxable accounts, tax-deferred accounts, and tax-exempt accounts to obtain the most after-tax spending potential for wealth in the face of our progressive tax system and with these important nonlinearities in the tax code:
- The Social Security “tax torpedo” applies when an increase in taxable income uniquely causes a greater percentage of the Social Security benefit to become taxable.
- Preferential income sources (qualified dividends, long-term capital gains) stack on top of ordinary income and have their own tax schedule. An increase in ordinary taxable income can also uniquely push preferential income into higher tax brackets.
- An increase in taxable income above certain thresholds triggers increases to Medicare premiums two years later.
- The net investment income tax and Medicare surtaxes apply when certain types of income exceed the relevant thresholds.
Numerous resources are available that explain the specifics of these tax non-linearities. For those first seeking further background on this, I suggest reading Chapter 10 of my book, Retirement Planning Guidebook.
The answer for creating tax-efficiency beyond the conventional approach generally involves spending from a blend of taxable and tax-deferred assets to meet expenses and to potentially make Roth conversions to generate more taxable income beyond what is needed to cover current spending, while taxable assets remain. Once taxable assets are depleted, the retiree then shifts to spending a blend of tax-deferred and tax-exempt assets to control the amount taxable income and taxes, which might also include Roth conversions, in a manner that allows for the greatest after-tax spending and legacy potential for investment assets. Harvesting capital gains could be a part of this process, but I do not specifically consider it for this case study.
The specific matter addressed in this first article is how to define the thresholds for generating additional taxable income for greater tax efficiency. William Reichenstein described filling up to specific income thresholds with Roth conversions to see which income thresholds provide the best outcome. I will describe these as adjusted gross income (AGI) thresholds, and this is equivalent to filling income tax brackets when the standard deduction is used. Reichenstein’s descriptions of optimal strategies tend to involve using different income thresholds over time. This can create computational problems as there are limitless variations of income thresholds to use at any age. I will investigate inflation-adjusted AGI thresholds checked in $1,000 increments for this article.
Another option was provided by Stephan Granitz at Income Discovery in his Advisor Perspectives article, “How Dynamic, Tax-Smart Distributions Maximize Retirement Income.”
His approach involves continuing to draw from the tax-deferred account while the average tax rate on just these incremental disbursals stays below a targeted level. The taxes considered include the impact of ordinary income marginal tax rates, the impact on taxable Social Security, the impact on Medicare premiums in two years (estimated as a part of current year taxes to determine the average tax rate), the impact of shifting preferential income into higher tax brackets, and the impact of additional net investment income and Medicare surtaxes. IRA spending increases first to reduce any Roth distributions and then to continue with Roth conversions for as long as the average tax rate on these incremental disbursals stays below the targeted level. The targeted tax rate providing the best financial outcome can then be determined.
I create a case study to compare these two methods, and I conclude that using the incremental average tax rate approach has several practical advantages. It is easier to compute because there are fewer potential tax rates to check than levels of AGI. This approach naturally allows the AGI thresholds to adjust based on the tax situation in a straightforward manner, as the optimal strategy does not have to be described as multi-phased with different income thresholds targeted at different points in retirement. The average tax rate strategy can make allowances for the composition of ordinary and preferential income within the AGI, which the AGI threshold strategy does not do. The tax rate method does not require keeping track of the inflation-adjusted value of the AGI target over time. Finally, it will be easier to use average tax rates in real-world applications as individuals can more easily target when the additional tax on a Roth conversion would remain below a targeted average tax rate, compared to performing a lifetime calculation to understand what level of lifetime AGI to target.
The purpose of this article is to compare the two methods. They can provide quite similar results, justifying the use of either approach. But for the practical benefits, the key outcome for this article is providing the motivation to use the incremental average tax rate method in my subsequent articles on this topic.
Case study details
The ensuing articles will be based on a case study for a couple with $3.2 million of investment assets. Both individuals are age 60 and have just recently retired after celebrating their 60th birthdays in January 2022. For their retirement finances, the priority is to build a financial plan that will cover their spending goals through age 95. When meeting spending goals, a secondary priority is to maximize the after-tax surplus of wealth for their beneficiaries at age 95.
Their financial details are provided in Exhibit 1. Retirement assets include $1,250,000 in a taxable brokerage account (with a $900,000 cost basis), $1,850,000 in a tax-deferred IRA, and $100,000 in a tax-free Roth IRA. The two spouses have Social Security primary insurance amounts (income) of $2,500 and $2,000 monthly. They will both delay claiming until age 70, which provides a 24% benefit increase through the delay credits, allowing for a combined $66,960 per year. These amounts are provided in age-60 dollars, as annual cost-of living adjustments assumed to match the consumer price index are applied in all cases.

The projected core annual retirement expenses for the couple equal an inflation-adjusted $130,000 throughout retirement. They seek to spend an additional $25,000 per year through age 74 to better enjoy the more active “go-go” years of their retirement. This discretionary spending, planned for when they are more active in enjoying travel and leisure activities, is not inflation adjusted. The couple also seeks reserves to cover contingencies related to health care (an additional inflation-adjusted expenditure of $10,000 between the ages of 85 and 95). They live in a state with no income tax. This couple rents their home in retirement to avoid the additional complications associated with managing home equity in the retirement plan.
They must pay federal income taxes – an additional expense that will be estimated beyond these spending goals. I calculate taxes on the portfolio distributions, including qualified dividends, interest, and long-term capital gains from the taxable account, the ordinary income generated from IRA distributions, the precise amount of taxes due on Social Security benefits, any Medicare premium surcharges if modified AGI exceeds the relevant thresholds, as well as any potential net investment income surtaxes due. These taxes are calculated based on the tax law in 2022, including the shift to higher tax rates in 2026 that is part of the sunsetting provisions in current law, as well as the new the required minimum distribution (RMD) life tables introduced in 2022. Tax brackets increase with inflation, though the thresholds for determining taxes on Social Security and the net investment income tax are not inflation adjusted. This couple uses the standard deduction instead of itemizing.
The legacy value of assets reflects the after-tax value of investments remaining at age 95. Taxable assets receive a step-up in basis at death, providing their full value for heirs. Tax-deferred assets maintain their embedded income tax liability after death. I assume that adult children will be beneficiaries, and the SECURE Act requires them to spend down the account within a 10-year window when they may still be in their peak earnings years and face higher tax rates. To reflect this, I assume that remaining tax-deferred assets will be taxed at a 25% rate to reduce their legacy value to heirs. Tax-free Roth assets also face the same distribution requirements, but they will not be taxable to heirs, so their full value passes as legacy.
If the entire spending goal cannot be met over the retirement planning horizon, I calculate the spending shortfall relative to the goals as a negative legacy. Only Social Security remains to cover a portion of spending if investments deplete.
Tax-efficient distribution strategies
Portfolio distributions will include Roth conversions and use a blended strategy that mixes taxable and tax-deferred distributions at first, and then tax-deferred and tax-free distributions later, to provide control over the AGI or the incremental average tax rate as a tax-management strategy. The client first takes any RMDs from the IRA, which begin at age 72. If Social Security benefits and RMDs from the IRA exceed the desired spending level and taxes due, then any surplus is added as new savings to the taxable account. More commonly, if RMDs and Social Security benefits are less than the desired spending and federal income taxes due, additional withdrawals are then first estimated to be taken from the taxable account until empty, then from the Roth IRA account until empty, and then from the IRA account until empty.
Then, if this distribution ordering leads to less than the targeted level of AGI or greater than the targeted average tax rate for additional disbursals, I distribute additional funds from the IRA to offset any Roth IRA distributions and then to further convert funds from the IRA to the Roth IRA to generate additional taxable income. Taxes on these additional IRA distributions and conversions are paid through further distributions from the taxable account when possible, or otherwise from the tax-deferred account after the taxable account depletes. Distributions are taken at the start of each year. This algorithm leads spending strategies to be a blend of taxable and tax-deferred IRA assets while taxable assets remain, and then a blend of IRA and Roth IRA assets.
Financial market returns
For the first few articles in this series, I will explore important questions using simple financial return assumptions. Market volatility will be added later. But for now, I use one fixed portfolio return assumption. In this article, I assume an overall portfolio return of 5%. This consists of a 2.5% inflation assumption (meant to be a long-term projection rather than reflecting 2022 inflation numbers), and a 2.5% real return. Asset allocation is not directly relevant other than to manage the breakdown between interest income and qualified dividends to determine income distributions from the taxable portfolio. I assume a portfolio of 60% stocks and 40% bonds, with a dividend yield of 2.5% (matching inflation) and a bond yield of 3% (or 0.5% real). The remainder of returns reflect long-term capital gains.
Results
The results proceed in two stages. First, I seek to determine the optimal threshold for AGI when using the first method and the optimal incremental average tax rate to use with the second method. Optimality here is defined as the threshold or rate that supports the greatest after-tax value for legacy assets as defined at age 95. Then I compare how each optimal strategy operates. The first two exhibits also include the legacy for the conventional spenddown strategy, which is simply to spend taxable accounts first, then tax-deferred accounts, and then tax-exempt accounts.
Exhibit 2 shows the after-tax legacy when managing AGI managed at different inflation-adjusted levels (all monetary values are defined as real 2022 dollars) as estimated in $1,000 increments from $0 to $300,000. The conventional strategy, which does not take advantage of paying taxes when it can be done at lower rates and leads to too much tax when spending only from the IRA, creates a legacy of $737,166 as shown with an asterisk (*). For the AGI targeting strategy, the $109,000 threshold supports the largest legacy after funding the retirement spending goals. The legacy is $907,208. The optimal AGI threshold is quite close to the start of the 22%/25% income tax bracket, as measured by AGI with the standard deduction added to the federal tax bracket numbers. Targeting higher income thresholds will reduce legacy. It is also interesting to observe the discrete legacy reductions that happen when targeting AGI values just above where the IRMAA surcharges get triggered. The AGI threshold of $0 provides a worse outcome than the conventional strategy because the Roth IRA is spent before the IRA in this case.
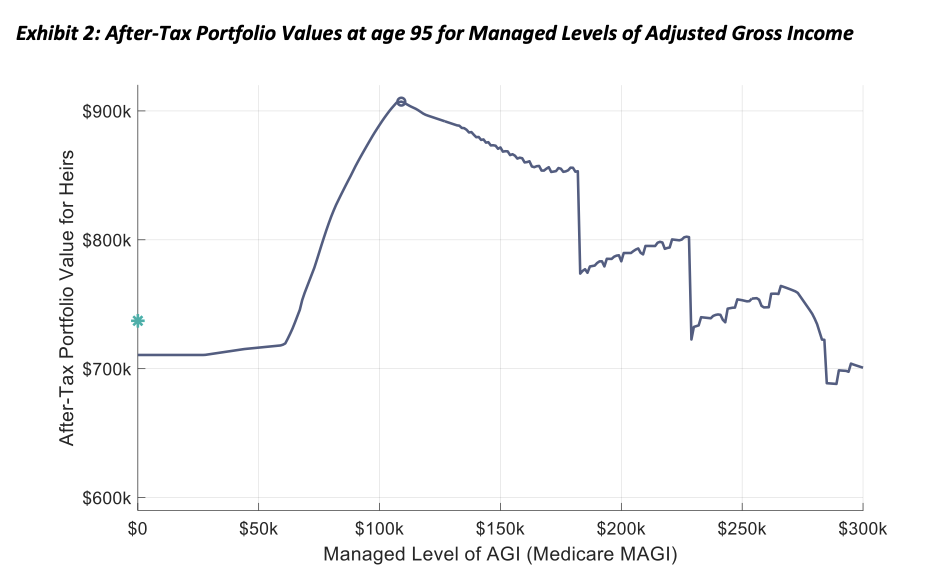
Exhibit 3 shows this analysis when managing different incremental average tax rates paid on additional IRA disbursals used for spending or Roth conversions. Legacy peaks at an average tax rate target of 20%, though legacy values are quite close for a full range of tax targets starting at about 7%. This is important to expand upon in subsequent articles when I will consider the impacts of changing the portfolio return assumptions, but for now I proceed with the optimal strategy of targeting a 20% incremental average tax rate. It leads to legacy of $912,008, which is slightly greater than with the AGI method. The tax rate strategy with a target of 0% does provide a better outcome than the conventional wisdom by allowing for some Roth conversions when still possible at 0% tax due to enough of the taxable distribution being taxed with preferential rates while there is still excess capacity for the conversions within the standard deduction after accounting for the interest income.

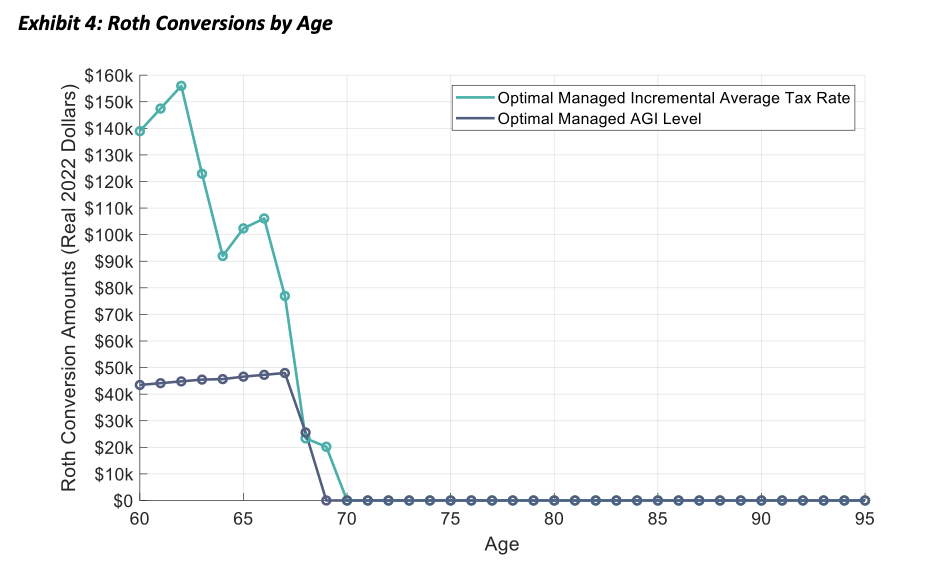
The next set of exhibits compare characteristics of the two optimal strategies: managing a real AGI of $109,000 or incremental average tax rate of 20% throughout retirement. First, Exhibit 4 shows the dollar amount (in real 2022 dollars) of the Roth conversions made at each age. For the AGI strategy, the last of the taxable account is spent at age 68, and Roth conversions are made consistently until this time. Once the taxable account depletes, this AGI threshold does not provide capacity for further conversions because higher IRA distributions are needed to cover spending, which raises the taxable income compared to covering spending partly through the spenddown of non-taxed basis with the taxable account.
For the 20% average tax rate strategy, Roth conversions are more aggressive and continue until Social Security begins at 70. Conversion amounts are the highest at ages 60-62. They reduce at age 63 as part of the efforts to avoid the Medicare IRMAA surcharge applied to income, with Medicare beginning at age 65, which pushes the average tax rate over 20%. Because of the higher taxes due on the conversions, the taxable account depletes at age 67, which causes another drop in the conversion amounts without completely stopping them. Once Social Security begins at 70, though, this strategy is helping to avoid the full tax torpedo and so additional conversions are avoided as a part of minimizing tax on Social Security benefits.
Next, Exhibit 5 shows the total income (ordinary income plus preferential income) at each age with these two approaches. The AGI strategy keeps total income at $109,000, as there are no above-the-line deductions until age 72, when RMDs begin. This strategy does a reasonable job of balancing RMDs to keep income at about this same threshold, but RMDs do force slightly higher total income for the rest of the retirement. As for the average tax rate strategy, higher total income is generated in the years before Social Security begins, and then it drops dramatically. One may wonder why income is higher at ages 70 and 71, compared to 72 and later. This is a quirk of the incremental average tax rate methodology, as in the years before RMDs begin there is a bigger runway for generating taxable income at 0% to keep the incremental average tax rate lower for longer, allowing for greater total income. Once RMDs begin, the starting point for incremental disbursals is higher, which causes the 20% average tax rate threshold to be reached more quickly. Even with this optimal strategy, total income is allowed to exceed the first IRMAA threshold for ages 67-69, which in turn causes additional tax to be paid as a higher Medicare premium at ages 69-71.
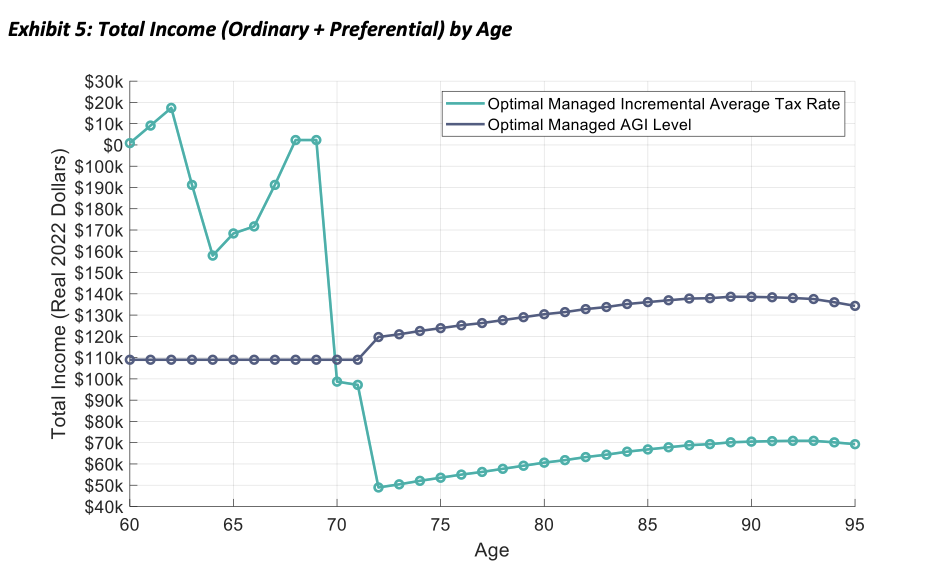
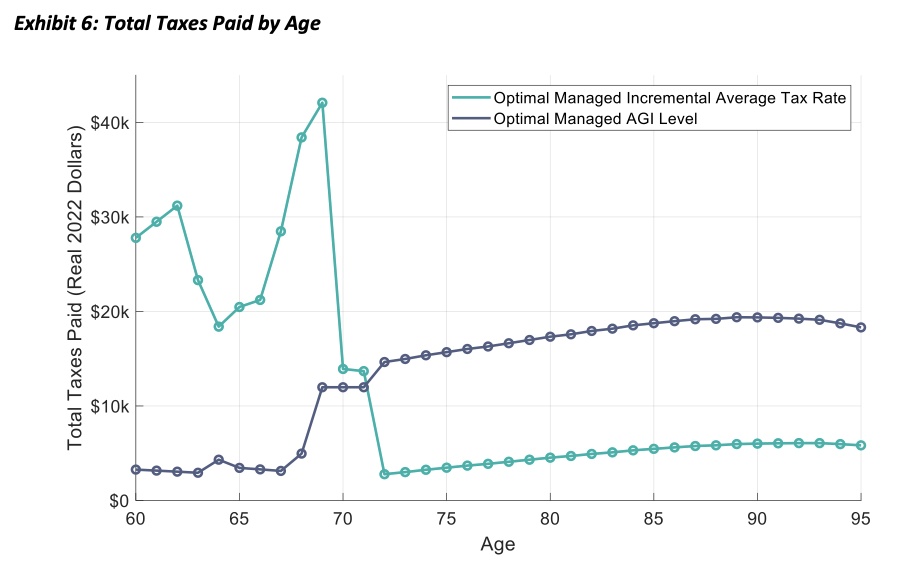
Exhibit 6 next shows the total taxes paid for each retirement year. The AGI method keeps taxes lower at the start as the taxable account generates less taxes while being spent, but then taxes increase once the taxable account is depleted and the Social Security benefit taxation and IRA distributions keep the tax bill consistently higher for the remainder of retirement. On the other hand, the average tax rate strategy does lead to a higher tax bill through age 72. But once the RMD phase begins, the total taxes due are kept low for the remainder of the retirement horizon.
Finally, Exhibit 7 partly demonstrates how the incremental average tax rate strategy was able to provide greater financial benefit through its frontloading of taxes. In this case study, the upfront taxes paid help to reduce the taxable amount of Social Security benefits received by the household quite dramatically. The AGI management strategy led to 85% of the Social Security benefits being taxed in almost every year they are received. For the $66,960 of annual benefits received, 85% taxation means that $56,916 of these benefits are added to AGI. But the average tax rate strategy reduces this number. This number does creep up over time as the formulas for determining Social Security benefit taxation are not inflation adjusted, but the average amount of Social Security benefits taxed is 53%, or $35,489. This lower Social Security contribution to AGI along with less RMDs provides tax savings for the couple.

The bottom line
In many cases, an AGI threshold strategy can be improved by targeting different income thresholds at different points in retirement. Often this will involve targeting a higher threshold before Social Security benefits begin, and then a lower threshold after. But determining such thresholds is computationally intensive, and the incremental average tax rate method provides a straightforward means to accomplish the same result more directly.
This case study shows the potential value for strategic tax planning in retirement, and I will further explore these issues in subsequent articles using the incremental average tax rate method.
Wade D. Pfau, Ph.D., CFA, RICP®, is the program director of the Retirement Income Certified Professional® designation and a Professor of Retirement Income at The American College of Financial Services in King of Prussia, PA, as well as a co-director of the college’s Center for Retirement Income. As well, he is a Principal and Director for McLean Asset Management and RISA, LLC. He also serves as a Research Fellow with the Alliance for Lifetime Income and Retirement Income Institute. Wade’s latest book is Retirement Planning Guidebook: Navigating the Important Decisions for Retirement Success.
Membership required
Membership is now required to use this feature. To learn more:
View Membership BenefitsSponsored Content
Upcoming Virtual Events View All


