That the Covid-19 pandemic would bring a big decline in poverty in the U.S. is not something a lot of people were predicting back in March 2020. But that’s what seems to have happened, at least if you go by — as most poverty researchers do — the Supplemental Poverty Measure introduced by the Census Bureau in 2011 to take into account both government assistance programs and unavoidable expenses that are not reflected in the official poverty rate. The percentage of Americans below the SPM poverty line fell to a record low 9.1% in 2020 from 11.8% the year before, the Census Bureau reported in September, while the Urban Institute projected in July that the rate will drop to 7.7% in 2021.
The chief cause of this poverty drop was the unprecedented gusher of federal social spending that began with the $2.2 trillion Coronavirus Aid, Relief, and Economic Security Act of March 2020 and continued through the $1.9 trillion American Rescue Plan of March 2021. The success of all that spending in keeping the Covid-caused recession short and stimulating a quick recovery should hold lessons for government policy in future downturns, but as a way to fight poverty year in and year out, it’s probably not sustainable either economically or politically.
There is one line item, though, that might make sense to keep around. The March 2021 aid law included a one-year expansion of the child tax credit to as much as $3,600 per child, made this fully refundable — that is, those owing less than $3,600 in federal income taxes can still get the full amount — and provided for monthly advance payments of up to $360 that the Internal Revenue Service started sending to parents in July. Historically, children have usually faced higher poverty rates than working adults and senior citizens. In 2021, if the Urban Institute’s projections hold up, they were for the first time the least likely among the three groups to be poor.
Those are just projections, of course, but monthly estimates from Columbia University’s Center on Poverty and Social Policy, based on data from the Census Bureau’s Current Population Survey and other sources, show a similar if noisier trend (the monthly rates are higher than the annual ones in the first chart for several reasons, some of which you can read about on page 8 of this paper).
In the past, a smaller CTC was paid out solely as part of annual tax refunds, which helps explain the sharp drops in child poverty in March 2020 and March 2021 in the above chart. The impact of the monthly payments starting in July are apparent too. They also left their mark in the Household Pulse surveys that the Census Bureau has been conducting during the pandemic, which showed a sudden drop in the share of households with kids reporting food insufficiency or trouble paying expenses from late June and early July to late July and early August.
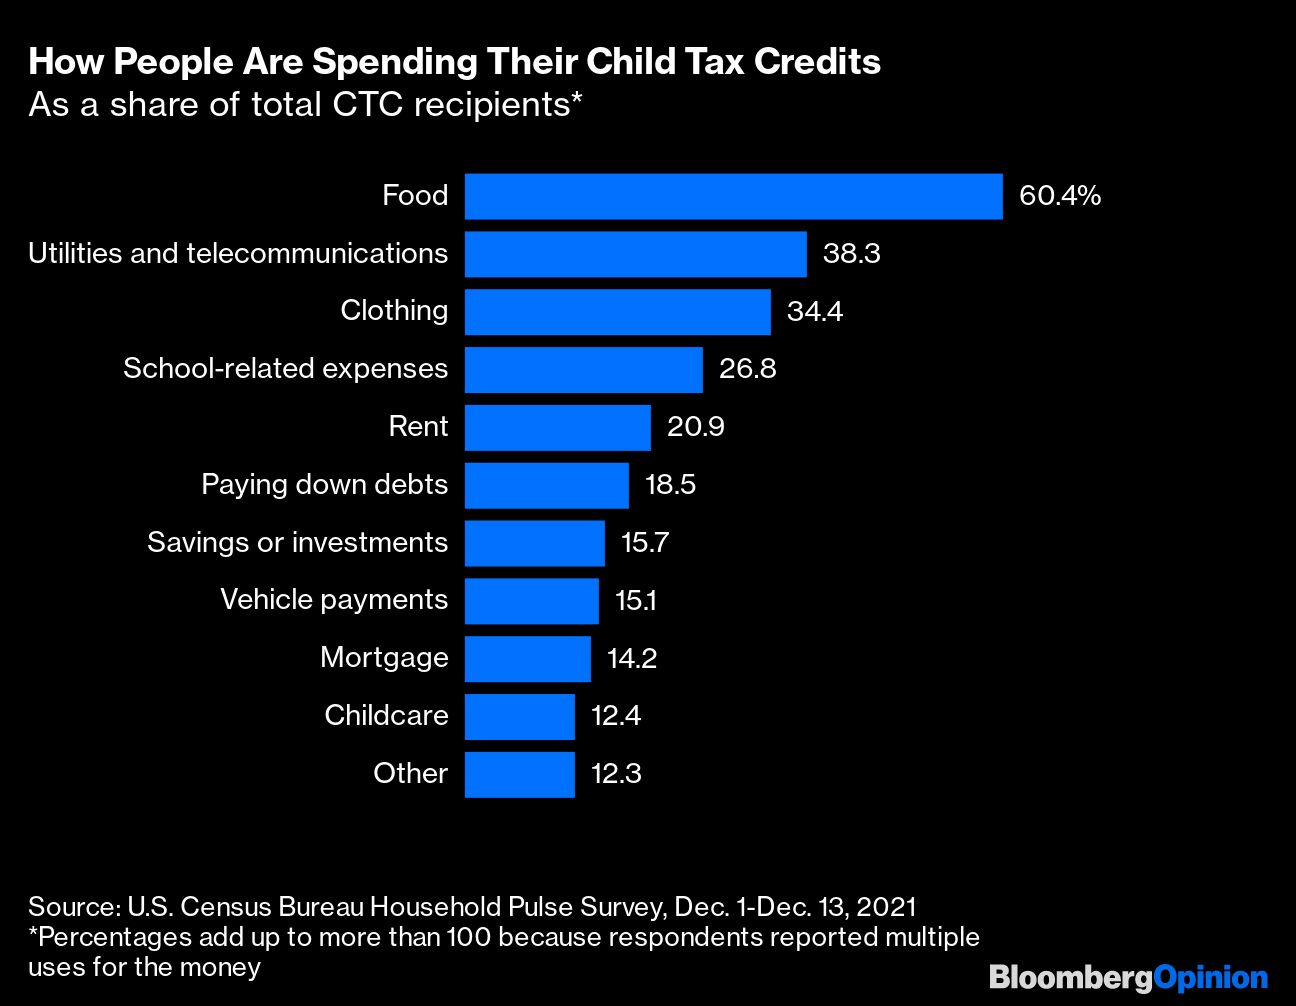
As of early December, here’s what parents reported spending their CTC payments on:

Barring action by Congress, the last monthly CTC payment will have been in December. There will be more money to come for those with children after they file their 2021 tax returns, but after that it’s back to a smaller, once-a-year CTC that maxes out at $2,000 per child and isn’t fully refundable (meaning that those with very low incomes and thus low tax bills can’t get the full amount.) Barring action by Congress, the CTC will further shrink to $1,000 in 2026, when the expansion of the credit that was included in the Tax Cuts and Jobs Act of 2017 is set to expire.
Extending last year’s increase is a key element of President Joe Biden’s endlessly debated Build Back Better legislation, which is apparently not dead yet but isn’t doing great either. Republican U.S. Senator Mitt Romney has his own much-praised if little-acted-upon alternative plan, and his colleagues Mike Lee and Marco Rubio — who were chiefly responsible for the 2017 changes — have their own ideas for CTC improvement and expansion. Others have suggestions too, and getting into all the alternatives and their odds of success is not something I’m going to do here.
What I will instead attempt to provide is some basic context. Has the credit reduced poverty? How much does it cost? What are the possible long-run economic effects?
Poverty reduction
The evidence I’ve cited so far indicates that poverty has in fact fallen among children in the U.S. since the monthly CTC checks started going out in June. There was also a discernible drop after the 2017 expansion of the credit. There’s less evidence of any impact in the 2000s — the CTC was created in 1997, first made partially refundable (that is, available to those with very low incomes) in 2001, and was gradually expanded to $1,000 from $500 in the early 2000s — but (1) it wasn’t all that much money and (2) there were a lot of economic headwinds.
There are a few recent data points that are less positive than the ones from the Supplemental Poverty Measure that I’ve cited so far. The official poverty rate went up slightly in 2020, for example. Given that what it measures is the percentage of Americans with gross before-tax cash incomes less than three times the cost of a minimum food diet in 1963 in today’s prices (!), it’s hard to know how much significance to attach to the disparity. The SPM approach of including the impact of taxes and noncash benefits and defining thresholds that vary by geography based on what people actually spend on food, clothing, shelter, and utilities is perhaps more opaque, but it does seem to make more sense.
More significant may be that the Household Pulse readings on food insecurity have gotten moderately worse since summer as food prices have risen. Bloomberg’s Mike Dorning and Elizabeth Elkin reported last month on rising signs of malnourishment among the poorest children in the U.S. — some of whom aren’t benefiting from the child tax credit because it’s only available to parents of U.S. citizens, or their families are otherwise disconnected from the federal income tax system. Also, the pandemic has been awful for U.S. children in lots of other ways even if they have enough to eat.
Still, none of this means the CTC expansion hasn’t helped — a lot. Summing up the research that’s been done so far on its impact, Megan A. Curran of the Columbia Center on Poverty and Social Policy writes that:
in its first six months, the expanded Child Tax Credit has shored up family finances amidst the continuing crisis, reduced child poverty and food insufficiency, increased families’ ability to meet their basic needs, and has had no discernable negative effects on parental employment.
Program Cost
How much has all this poverty reduction cost? The current Washington practice of summing up the 10-year cost of legislation, and assuming that all temporary provisions will expire, is really confusing. So here are some rough annual estimates: The 2021 version of the CTC costs around $220 billion a year in lost tax revenue and government outlays. That’s approximately 1% of gross domestic product, and 5% of federal revenue. Romney’s plan is in the same ballpark. The 2017 version of the CTC is about $120 billion. The pre-2017 CTC is a bit less than half that — $43 billion, according to a recent Congressional Budget Office estimate.
These costs all seem likely to decline over time given that the U.S. birth rate has been falling for more than a decade now, with the estimated number of births per woman ages 15 through 44 hitting an all-time low of 1.6 in 2020, and there are no hints of a big revival in the offing. Then again, $3,600-a-year per small child (it’s $3,000 for kids ages 6 through 17) might motivate people to have more children, which is one of the potential long-run impacts I’ll get to next.
Long-run effects
Monthly government payments to parents — “child allowances” — are common in other rich countries. “The U.S. is the only Western industrialized nation that does not have a child allowance policy or some other universal, public benefit for families raising children,” the bipartisan National Commission on Children pointed out in the 1991 report that eventually led to the adoption of the CTC. As of 2017, the U.S. continued to rank second-to-last among members of the Organization for Economic Cooperation and Development, the association of the world’s affluent democracies, in spending on child allowances, paid family leave and other family benefits as a share of GDP (the chart only shows the 15 most-populous OECD members, but Turkey and the U.S. rank last and second-to-last among all 38 members too).
The 2017 CTC expansion, which took effect in 2018, likely pushed the U.S. past Mexico, and the 2021 expansion moved it up another couple of rungs. But its spending would remain on the low end among OECD nations even if that were made permanent.
What do countries with high family benefits spending get for all that money? Child allowances have been around for so long in Western Europe (more than 75 years in some countries) that there’s not a lot of meaningful before and after data, and cross-country comparisons have their complications. Low-spending Turkey and U.S. have among the highest child poverty rates in the OECD, for example, but because of the way the poverty line is defined (half the median household income of the total population) this reflects inequality and the relative status of children within a country rather than their absolute well-being across countries. A 2009 attempt to measure the latter put U.S. children in the bottom third among OECD countries in three categories (material well being, educational well being and health and safety), in the middle third in three (housing and environment, risk behaviors and quality of school life) and in the top third in none. Sweden, the only country to rank in the top third in every category, ranks No. 2 in family benefits spending at 3.4% of GDP, just barely behind Denmark.
Beyond the immediate effect of simply making children’s lives better, doing so probably makes them more likely to succeed as adults. The economic benefits thought to flow from this are part of what University of California at Davis economist Peter Lindert has described as the “free lunch” effect of a well-designed welfare state, in which social spending stimulates economic growth because it enables workers to become more productive. Lindert’s 2021 book “Making Social Spending Work” cites strong evidence in this regard for investment in early childhood education and parental leave. The book does not make the same case for child allowances, but when I talked to Lindert last spring he hailed the CTC expansion as a positive step in the direction of “investing in the young, especially the young and the poor.” There also is some evidence that child allowances increase subsequent social mobility.
One key issue in the current debate over expanding the CTC is whether the benefits should come with work requirements, as holdout Democratic Senator Joe Manchin says they should. In a working paper released in October, four University of Chicago economists argued that making the 2021 CTC expansion permanent with no work requirement would in theory cause 2.6% of working parents to leave the labor force. As noted above by Columbia’s Curran, early empirical research has detected no such work-discouraging effect from the 2021 legislation. It’s also possible that enabling parents to spend more time with their kids rather than at work might have long-run positive effects that outweigh any short-term labor impact, not to mention that adding work requirements complicates the CTC process in ways that could discourage even eligible parents from participating.
There’s also the question of how far up the income scale the benefits should go. The 2017 version of the CTC starts phasing out at an income of $200,000 for single filers and $400,000 for married couples, while the benefits added in 2021 start phasing out at $75,000 and $150,000. The overall pricetag could certainly be cut if the income limits were ratcheted down further, but there are costs to that too in (1) complexity, (2) perverse work incentives for those nearing the income thresholds and (3) political support. Also, if the goal of a child allowance is not just to reduce child poverty but to encourage the non-poor to have babies — which has long been a motivation in Europe and seems likely to become more of one in the U.S. as birth rates fall — then income limits are counterproductive.
Bloomberg News provided this article. For more articles like this please visit
bloomberg.com.
Read more articles by Justin Fox