The Next Generation of Risk Measurement Methodology
Membership required
Membership is now required to use this feature. To learn more:
View Membership BenefitsAdvisor Perspectives welcomes guest contributions. The views presented here do not necessarily represent those of Advisor Perspectives.
Having an accurate investor risk profile is the first step in wealth management. But what is in a risk profile? Is it the same as risk tolerance or is there more to it?
The release of Orion’s 3D Risk Profile and a webinar by Michael Kitces titled “Rethinking Risk Tolerance” got people thinking.
Many of us are familiar with risk tolerance. Also known as the risk attitude, risk appetite, or risk preference, it indicates how much risk the investor wants to take. This is a personality trait.
People also talk a lot about risk capacity, i.e. how much risk the investor can afford to take, which is usually determined by the investment time horizon, the asset level and cash-flow considerations. For example, a retirement account with a 20-year investment horizon can afford to take on more risk because it has time to recover from a downturn.
But what else is in the investor risk profile?
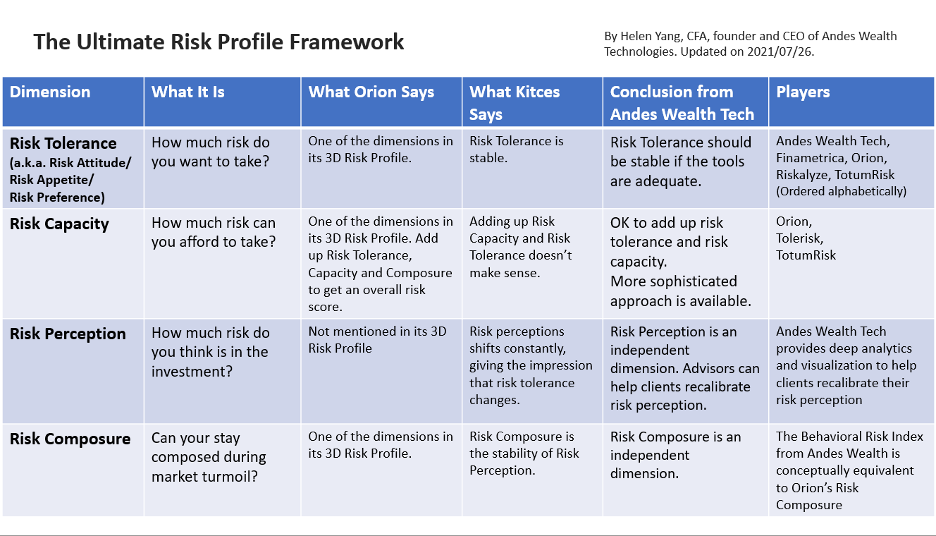
Dr. Daniel Crosby, the mastermind behind Orion’s 3D Risk Profile, says risk composure is the third dimension, indicating how likely the investor stays composed during market turmoil instead of making irrational investment decisions. Risk composure is not a new concept. Michael Kitces wrote about it in this blog post in 2017, but Crosby is perhaps the first person to formally introduce it as one of the dimensions in a 3D risk profile framework, along with risk tolerance and risk capacity.
Kitces highlights risk perception in his risk framework, along with risk tolerance and risk capacity. Risk perception indicates an investor’s perception of the risk, which may be different from the actual risk. Kitces points out that investors tend to perceive risk to be lower during a bull market, while higher during market turmoil.
Risk composure and perception are closely related. In his 2017 blog post, Kitces pointed out that risk composure is the stability of risk perception. In a Twitter thread, he further stated that, “ it's not because ‘poor composure’ causes responses to turmoil. It's because poor composure leads to perception shifts. And mis-perception leads to reaction.”
How do you make sense of it all? Here is my take.
The ultimate investor risk profile
An investor risk profile should have four dimensions:
- Risk tolerance
- Risk capacity
- Risk perception
- Risk composure
It starts with risk tolerance, i.e. how much risk you want to take. And then risk capacity comes into play. This is not any different from when you buy a car or a house. You start with what you want and adjust based on what you can afford.
Risk perception and composure are fundamentally different, because perceived high risk doesn’t automatically translate to poor behavior. For example, those on the Titanic had no illusion of the fate ahead, yet they chose to respond in the most admirable manner.
Is risk tolerance stable?
Many advisors report that their risk tolerance assessments are not stable if a client takes it multiple times. It is due to the limitation of the tools they use. Self-described risk tolerance may indeed be unstable because it tends to be influenced by the mood of the client. In addition, some risk tolerance tests can be confusing, making the results unreliable.
Based on my experience, the results from properly constructed risk tolerance assessments are stable. But, as time changes, the client’s risk tolerance can evolve over time.
Kitces shares this belief. Furthermore, he believes that it is the risk perception that shifts constantly, changing the investor’s attitude towards certain assets such as equity, hence giving the impression that the risk tolerance has changed. This is an important insight.
Risk perception, risk composure, and investor response
Changes in risk perception reflect a combination of changes in the market and behavioral biases.

The change in risk perception is from an event or trigger, and the risk composure ultimately determines how the investor chooses to respond to the event. Behavioral biases such as loss aversion, the lack of knowledge in financial markets and other personality traits influence both risk perception and risk composure, hence the correlation between the two.
While the investor’s risk perception can shift more dramatically than warranted, financial advisors are often too quick to dismiss it as irrational. The chart below shows the rolling three-month risk and return of S&P 500 from 2018 to 2021. You can see that the risk was indeed lower during the bull market while shooting up sharply during the market turmoil in early 2020.

“But wait,” you might say, “what about ‘high risk, high return’?” The notion of “high risk, high return” is true when you compare the long-term risk and return across different asset classes. However, if you look at a given market, say, U.S. stocks, periods of negative returns are often accompanied by high risk.
Shifting risk perception does reflect market reality, at least partially. Financial advisors must acknowledge it first so the client feels validated, before moving on to talk about how loss aversion and the recency bias can magnify the fear, and the need to step back and take a more objective look at the risk.
To help clients recalibrate their risk perception, financial advisors can show clients the longer-term risk and return – not over 30 years, but any time horizon they can relate to. For example, the chart below shows the relative stability of the 10-year rolling risk and return for S&P 500, so clients can step back from recent events and focus on the longer-term picture.

On the behavioral finance front, while talking about biases may not get rid of them, having this awareness helps clients become more disciplined investors, regain composure, and minimize impulsive actions.
Can we measure risk composure?
Orion’s 3D Risk Profile asks clients a set of questions to identify whether they are easily stressed out and worry about things that are out of their control. This is quick and easy to do.
My firm, Andes Wealth Technologies, introduced a method to first break down the investor behavior into a set of factors including the investor type (passive investor, trend follower, etc.), behavioral biases, and financial IQ, each of which is independently assessed, and then roll them up into the Behavioral Risk Index™, a single number from 0-10 that indicates how likely a client may respond irrationally to market turmoil.
These are two different ways of looking at the same thing and can be used together to cross validate each other.
Does asset level affect risk capacity?
When talking about risk capacity, people often say that the asset level is an important factor, because investors with more assets (relative to their goals) can afford to take losses in down markets.
The opposite is also true: Those with more assets can also afford not to take the risk because they don’t need the extra return. Unfortunately, for those with less assets, they can’t afford to lose money, and they also can’t afford not to take the risk because they need the return.
The ultimate driver of risk capacity is the investment horizon. Various cash flow considerations affect the investment horizon, hence the risk capacity.
Combining risk tolerance and risk capacity
To make it possible to combine the risk tolerance and risk capacity, it is necessary to normalize each to the same scale, say 0-10.
The simplicity of having such a score is appealing; however, does it make sense? For example, what qualifies as a risk score of 10? Is it the long-term average risk of the most aggressive portfolio (100% equity)? Or the risk of the stock market at its highest point during a financial turmoil? Or the risk of the most volatile asset, say, bitcoin?
Let’s assume that both risk tolerance and capacity can be scaled to 0-10, and the two scales are comparable, i.e., the same number in risk tolerance and risk capacity maps to the same portfolio risk.
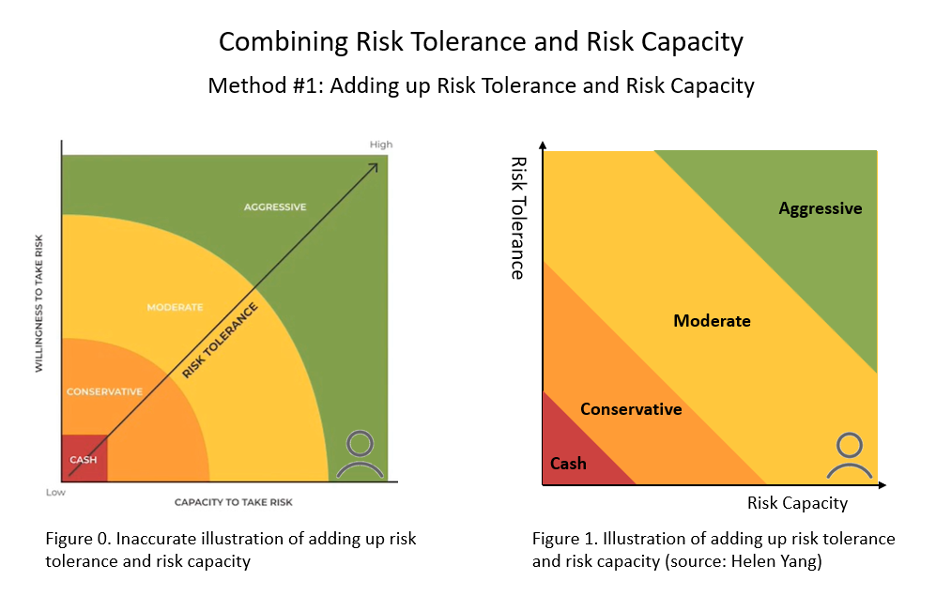
Some technology providers simply add up risk tolerance and risk capacity. Kitces illustrates this method in figure 0 below. He argues that it is wrong because based on this illustration, an investor with low risk tolerance and high risk capacity would be assigned an aggressive portfolio, which would not make sense.
It turns out that figure 0 is an inaccurate illustration of this method1. If you add up these two dimensions for an investor with risk tolerance 1 (out of 10) and risk capacity 10 (out of 10), the sum would be 11 out of 20, mapping to a moderate portfolio. The fact that this figure is wrong doesn’t mean this method is wrong.
Figure 1 shows the correct illustration of this method, while Appendix 1 explains how it is derived mathematically.
Nonetheless, a moderate portfolio for an investor with very low risk tolerance could still be a problem. To address this, I proposed a method that is illustrated in figure 2 (explained in Appendix 2), while Kitces proposes a method as illustrated in figure 3.

If we smooth out the lines in figure 2, it is similar to figure 3, except for cash.
In fact, even figure 1 is not that different. If you still remember a few things from calculus, you can see that figure 1 is the first order approximation2 of figure 2 and figure 3 (except for cash).
Practically, when the investor’s risk capacity and risk tolerance are not far apart, these three methods are the same (except for cash). Even when risk tolerance and risk capacity differ significantly, all three methods give a portfolio that is in-between.
Conclusion
An investor’s Risk Profile has four components: tolerance, capacity, perception and composure.
In wealth management, the focus has been on measuring risk tolerance and risk capacity. It is time to talk more about risk perception and risk composure to get a fuller understanding of the risk profile of clients.
Helen Yang, CFA, is the founder and CEO of Andes Wealth Technologies, a Lexington, MA-based provider of technology solutions for financial advisors.
Appendix 1: Adding Up Risk Tolerance and Risk Capacity
This appendix explains the illustration for simply adding up risk tolerance and risk capacity to get an overall risk score.
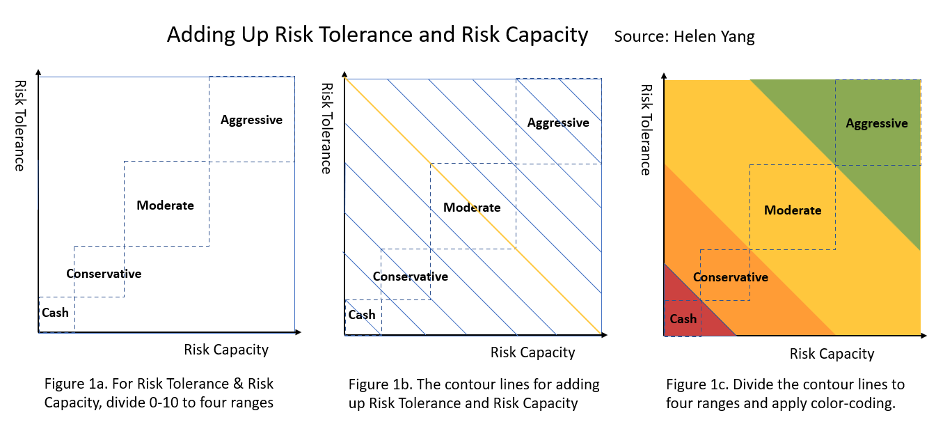
The graph can be constructed in three steps as illustrated by Figure 1a, 1b and 1c.
Figure 1a: For risk tolerance, divide 0-10 to four ranges: Cash, Conservative, Moderate and Aggressive. Do the same for risk capacity. If an investor has both moderate risk capacity and risk tolerance, it falls right into the Moderate box with dotted lines.
Figure 1b: Add up risk capacity and risk tolerance. We will get a set of “contour lines”, where the sum is the same for every point along each line. For example, the yellow line is the line for X + Y = 10.
Figure 1c: Divide into four regions based on the sum. This is the correct illustration for adding up risk tolerance and risk capacity, labeled as Figure 1 in the main text.
Appendix 2: Alternative Method for Combining Risk Tolerance and Risk Capacity
This appendix explains our proposal for combining risk tolerance and risk capacity.
To start with, since both risk tolerance and risk capacity are limiting factors in the portfolio decision, it makes sense to take the minimum of the two, as illustrated in Figure 2a. For example, if an investor has moderate risk tolerance and high risk capacity, the lower one wins hence the portfolio should be moderate. You can see that Figure 2a is quite similar to Kitces’ proposal in Figure 3.
Now, since the risk capacity of the investor is high, it may make sense to go a step up in the portfolio decision, i.e. to go for the Aggressive. Figure 2b reflects this adjustment.
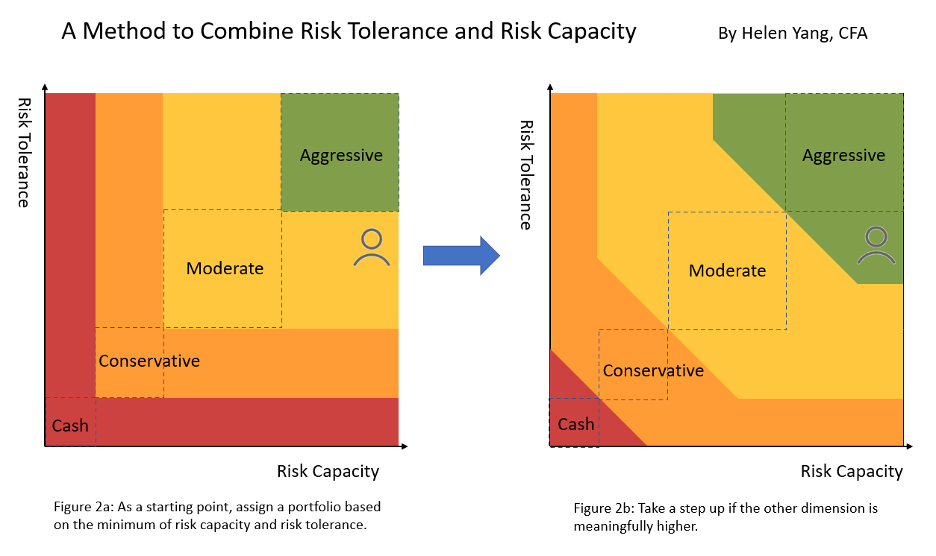
Figure 2b, labeled as Figure 2 in the main text, is really a hybrid of Figure 1 and Figure 2a, combining features in both.
Intuitively, in the example above, when adjusting the result based on risk capacity, it is essentially “adding” the risk capacity to the equation, while applying restrictions so it doesn’t bump up too much.
1Michael Kitces has agreed with this assessment. This section is kept in place for the benefit of the readers who have seen it in his previous work.
2The first order of approximation uses a straight line to approximate a curved line.
Membership required
Membership is now required to use this feature. To learn more:
View Membership BenefitsSponsored Content
Upcoming Virtual Events View All


