Why It’s So Hard to Choose ESG Funds and ETFs
Membership required
Membership is now required to use this feature. To learn more:
View Membership Benefits Choosing a fund or ETF with a positive environmental, social and governance (ESG) profile is fraught with risk. New research shows how carefully investors must weigh considerations such as screening criteria, factor exposures, industry concentration and expenses.
Concern over climate change has led many investors to consider integrating carbon risk into portfolio and risk management. Maximilian Görgen, Andrea Jacob and Martin Nerlinger, authors of the study, “Get Green or Die Trying? Carbon Risk Integration into Portfolio Management,” published in the February 2021 issue of The Journal of Portfolio Management, examined how integrating carbon risk impacts portfolio risk, exposure to common factors (such as value) and performance.
In their June 2019 study, “Carbon Risk,” the authors had quantified carbon risk via a “Brown-Minus-Green factor” (BMG) which was derived from 1,600 firms with data from four major environmental, social and governance (ESG) databases. BMG is “a composite measure of three indicators designed to separately capture the sensitivity of firms’ ‘value chains’ (e.g., current emissions), of their ‘public perception’ (e.g., response to perceived emissions), and of their ‘adaptability’ (e.g., mitigation strategies) to carbon risk.”
The BMG factor enabled Görgen, Jacob and Nerlinger to construct quintile portfolios and analyze the implications for portfolio management. Their analyses were based on a global dataset consisting of all constituents of the MSCI ACWI Investable Market Index (IMI) for the period October 2010 to December 2019. The sample included almost 9,000 constituents and approximately 99% of the global equity investment opportunity set.
They began by noting that positive (negative) BMG values represent firms that are likely to be negatively (positively) affected relative to others if the transition toward a low-carbon economy develops faster or more extensively than anticipated. They added: “In both cases, the contrary is true in the event of an unexpected slowdown of the transition process.” Görgen, Jacob and Nerlinger were making the important point that known BMG risks are already incorporated into prices. Thus, only the unexpected should impact returns.
Their sample period was relatively short and also favored the green stocks because of the cash flow into sustainable investment strategies over the past decade. The short-term impact of the increased cash flows is to drive valuations higher. However, higher valuations forecast lower future returns. Following is a summary of their findings:
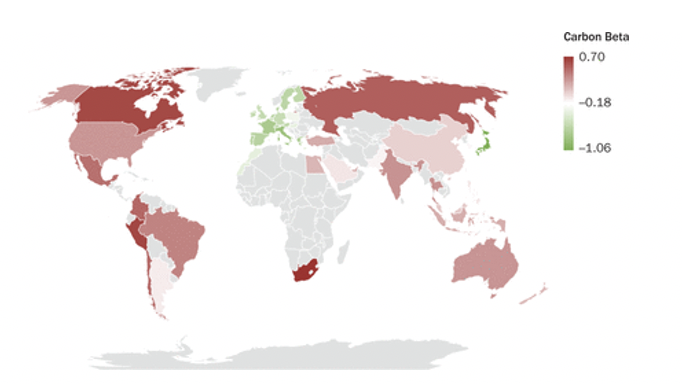
- As illustrated in the carbon landscape map below, Japan, with a negative carbon beta of -1.06, has the greenest portfolio. European portfolios are the next greenest. Russia, Brazil, the United States and Canada have high carbon betas. South Africa has the brownest portfolio (carbon beta of 0.7).

- In line with financial theory, low-carbon-beta portfolios, also referred to as green portfolios, had lower mean returns than high-carbon-beta (brown) portfolios, and returns increased almost monotonically from the lowest quintile to the highest.
- The extreme quintiles (both the highest and lowest carbon risk stocks) had higher risk than the middle portfolios. And the risk-adjusted performance was lower for the greenest and brownest portfolios – suggesting that the additional carbon risk was not remunerated proportionally in the financial market.
- Quintile 1 (the lowest carbon risk portfolio) produced a mean return of 13.2%, a standard deviation of 15.2 and a Sharpe ratio of 0.81. Quintile 5 (the highest carbon risk portfolio) returned 18.9% with a standard deviation of 16.4, resulting in a Sharpe ratio of 1.08. The Q2, Q3 and Q4 Sharpe ratios were 1.01, 1.33 and 1.25, respectively. The middle portfolio, Q3, also had a much lower standard deviation of 11.55.
- Differences in factor exposures drove part of the return pattern.
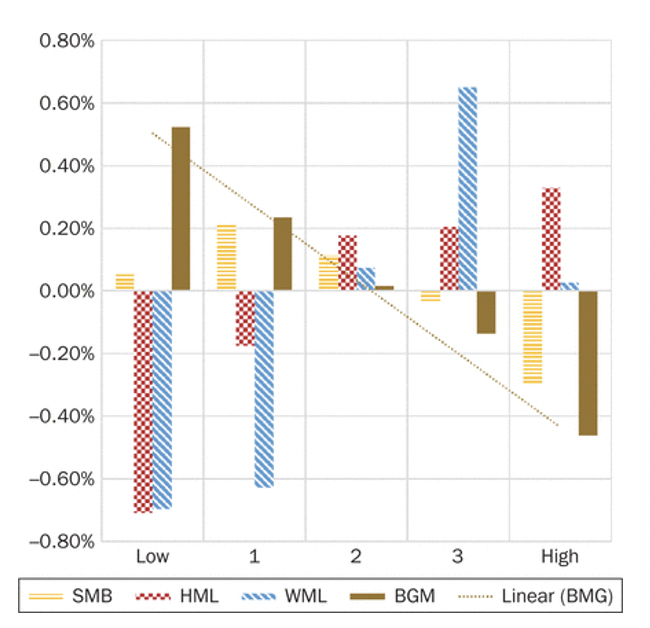
SMB (small minus big, the size factor); HML (high book-to-market minus low book-to-market, the value factor); WML (winners minus losers, the momentum factor); BMG (brown minus green, the carbon factor).
- Factor exposures explained much of the returns. The BMG alphas were -0.05 for Q1 and -0.41 for Q5. The four-factor (beta, size, value and momentum) Carhart alphas were -1.83 for Q1 and -0.26 for Q5.
- The inclusion of the carbon risk factor (BMG) led, in most cases, to a significant improvement in the asset pricing model applied – the unexplained part of the return, alpha, was significantly lower if BMG was considered in the model.
- The carbon risk factor had low correlation to the size, value and momentum factors, suggesting that it is a unique risk.
Görgen, Jacob and Nerlinger repeated their portfolio construction, relying on “a more fundamentals-based measure, the carbon emissions score from MSCI.” Their results were very different. In fact, they were reversed. They found that the brown portfolio with the worst carbon emissions score had the lowest mean return, at 13.74%. The green portfolio with the best carbon emissions score had a higher return but stood behind the middle portfolios (15.71% versus 16.34% for the second portfolio). Despite the different outcome, they did find that once again the return pattern was explained by varying factor exposures, particularly the value factor. For example, there was a large change in the HML exposure, from -0.17 for the brown carbon beta portfolio to 0.36 for the brown carbon emissions score portfolio. In addition, the green portfolio changed its HML exposure significantly, from 0.37 to -0.01. These changes drove returns down for the brown portfolio and up for the green portfolio. They also found that the brown portfolio had a lower Sharpe ratio, greater market beta risk and by far the largest negative alpha (-2.03% versus -0.65% for the green portfolio).
The impact of exclusionary screens
Görgen, Jacob and Nerlinger next examined portfolio construction strategies that use exclusionary screens (such as screening out the bottom 10 or 20% of the stocks with the worst sustainability scores). They found that the greenest portfolio had the worst underperformance, underperforming the benchmark by 3.33% annually, while the brownest portfolio outperformed the market by 2.41% annually. And the browner a portfolio, the higher the return. In addition, the total risk of the extreme screening portfolios was higher than that of the neutral portfolio – restricting the portfolio to stocks with the lowest carbon beta led on average to an increase of 2.92 percentage points in standard deviation. Thus, the stricter the exclusions, the more the Sharpe ratio of the portfolios deteriorated. They concluded: “Investors selecting the greenest or brownest stocks might lose risk-adjusted performance compared to the market. However, this loss comes with a more focused portfolio on a desired level of carbon risk exposure.”
Best-in-class approach
Görgen, Jacob and Nerlinger turned to examining how a “best-in-sector” approach impacts portfolio performance. They constructed a portfolio that was equal weighted in each of the 11 Global Industry Classification Standard sectors and equal weighted the sectors but included stocks with the 20% lowest carbon betas in each sector.
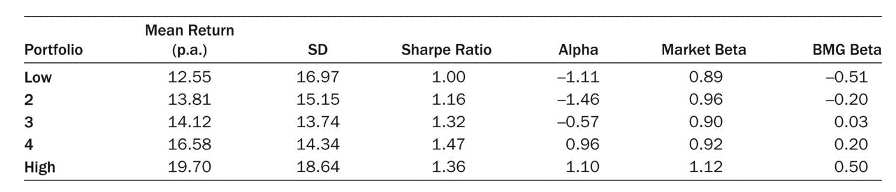
The greenest (low) portfolio had a mean annualized return of 12.55%, a Sharpe ratio of 1.00 and a Carhart alpha of -1.11. Returns increased monotonically, with the brownest portfolio returning 19.70% with a Sharpe ratio of 1.36 and an alpha of 1.10.
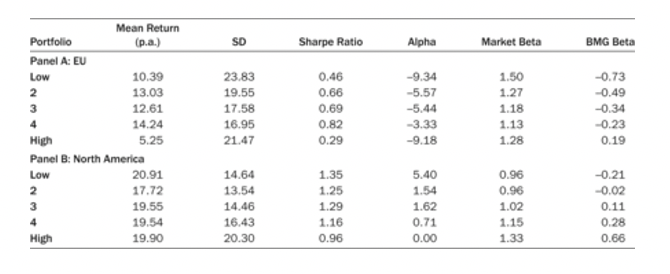
Görgen, Jacob and Nerlinger next applied their best-in-class approach to country portfolios. They found that brown portfolios across European countries had by far the lowest mean annualized return, at 5.25%. The green portfolio had the second lowest mean return, at 10.39%; this was, however, almost double the return of the brown portfolio. This performance perhaps is explained by the greater emphasis on sustainability in Europe, which in turn has led to greater cash flows into sustainable strategies – ESG investing now accounts for one of four dollars under professional management in the U.S. but one out of every two dollars in Europe[1]. In the U.S. the performance of the green and brown portfolios was much more similar, though the greenest portfolio had the highest return and the highest Sharpe ratio.
Summary
Their findings led Görgen, Jacob and Nerlinger to conclude that “both brown and green stocks exhibit risks stemming from the uncertain transition process from a carbon-based to a low-carbon economy. Most sustainable ratings do not mirror this twofold character of carbon risk. Our measure of carbon risk, the carbon beta, can reflect both brown and green risk.” They also found that much of the returns of green and brown portfolios are explained by exposure to common equity factors, and that the return patterns vary as factor exposures change from low- to high-scoring portfolios.
Their findings also led the authors to conclude that “screening strategies allow investors to reach a certain threshold value of carbon beta; however, this comes with less risk-adjusted performance.” They were also able to conclude that best-in-class approaches on sector level allow investors to gain a certain level of greenness or brownness without sacrificing sector exposure.
Summarizing their findings, they stated: “For the integration of carbon risk (either in the green or brown direction), we advise that investors carefully analyze all available information. In particular, the measure for greenness and brownness, respectively, influences risk and return profiles remarkably.”
Their findings of very different return results depending on which green versus brown metric was used (the carbon risk measure, BMG, or the MSCI carbon emissions measure) help explain the wide dispersion of findings from academic research on sustainable investing. For example, Vanguard’s Jan-Carl Plagge and Douglas Grim, authors of the 2020 study “Have Investors Paid a Performance Price? Examining the Behavior of ESG Equity Funds,” concluded: “Due to the wide dispersion of outcomes caused by systematic differences in portfolio holdings, investors are best served by assessing investment implications on a fund-by-fund basis. They added: “Our mixed and dispersed performance results suggest that it is difficult to make generalizations on the investment risk and return impact when replacing a conventional US equity fund with an ESG fund. Carefully assessing the important and unique attributes of both funds seems to be an essential step in determining the potential direction and magnitude of any differences.”
To make ESG investing a core of your investment philosophy, thorough due diligence is required before committing assets. That due diligence should not only include the screening methodologies but also a careful examination of factor loadings, industry concentrations and expenses. The research findings could also lead investors seeking to integrate sustainable investing principles into their portfolios to consider overweighting Japan and Europe, as they are much greener portfolios, while underweighting the U.S.
Larry Swedroe is the chief research officer for Buckingham Strategic Wealth and Buckingham Strategic Partners.
Important Disclosure: This information is for educational purposes only and should not be construed as specific investment, accounting, legal or tax advice. Certain information may be based on third party data which may become outdated or otherwise superseded. Third party data is deemed to be reliable, but its accuracy cannot be guaranteed. The opinions expressed by featured authors are their own and may not accurately reflect those of Buckingham Strategic Wealth® or Buckingham Strategic Partners®, collectively Buckingham Wealth Partners. LSR-21-30
[1] Depending on how you identify ESG assets, those numbers are considerably less.
Membership required
Membership is now required to use this feature. To learn more:
View Membership BenefitsSponsored Content
Upcoming Virtual Events View All


