Advisor Perspectives welcomes guest contributions. The views presented here do not necessarily represent those of Advisor Perspectives.
Advisors all know the mantra: Past performance is not indicative of future results. So why do we think that the past volatility of returns is indicative of forward risk? It doesn't make sense. The world changes. Markets change. For markets the term “unprecedented” is commonplace.
The common approach to measuring market risk takes the last year or two of returns, computes the variability of those returns, and asserts that as the forward-looking risk for the market. The most common metric is value at risk (VaR), but there are many others, like GARCH or expected short-fall. Whether simple or sophisticated, they all look at risk through the rearview mirror. That might be adequate for the humdrum, typical day-to-day price movements, but it’s not satisfactory when risk matters.
To see what I mean, look at this chart of volatility for the S&P 500 over the last 50 years.
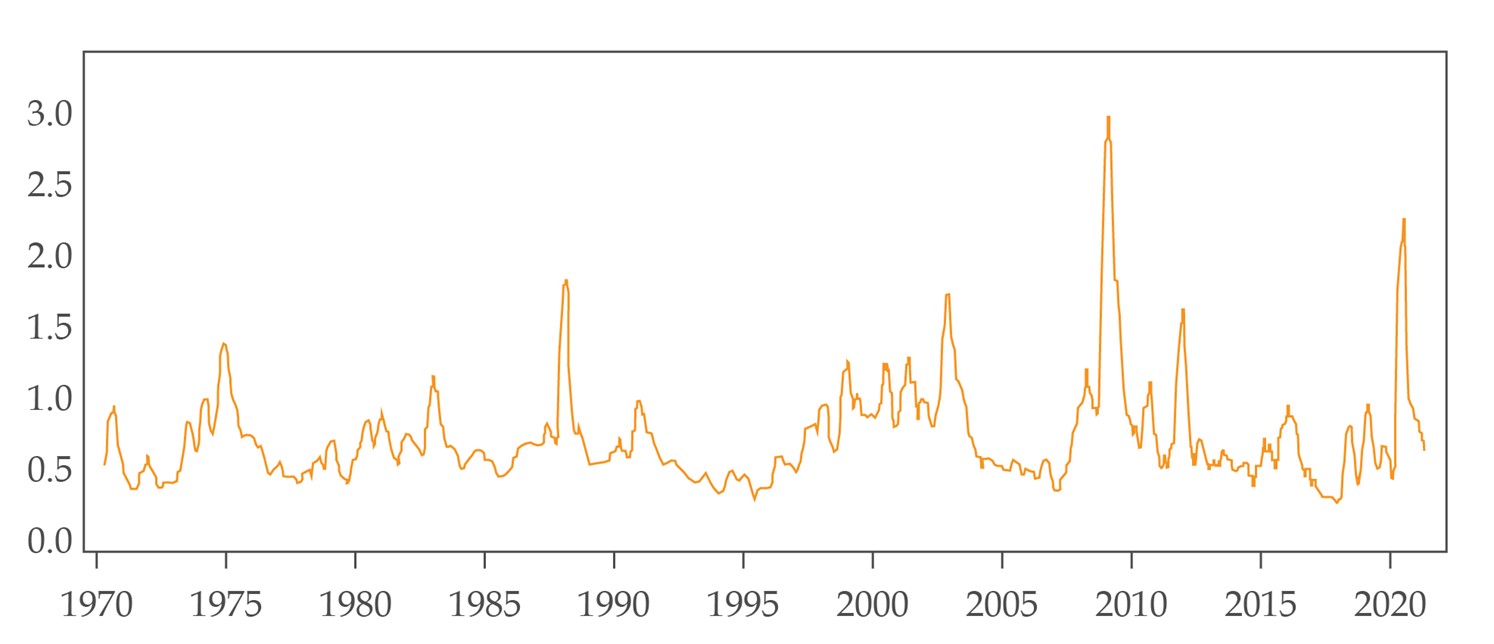
Daily volatility for the S&P 500 measured using a 100-day lag
Volatility moves with fits and starts. Unprecedented (see, I used the word) events pop up decade by decade: stagflation in the 1970s; the October 19 market break in 1987; the Asia crisis and the implosion of Long-Term Capital Management warming things up for the dot-com bubble and “irrational exuberance” as we ushered in the new millennium; the 2008 banking crisis; and credit stresses in 2012. If you estimated forward risk based on volatility in the late 1990s, you would underestimate by a lot. And of course, it goes the other way around. If you take a period of high volatility like the early 2000s and assume the forward risk is going to look the same, you’ll get it wrong.
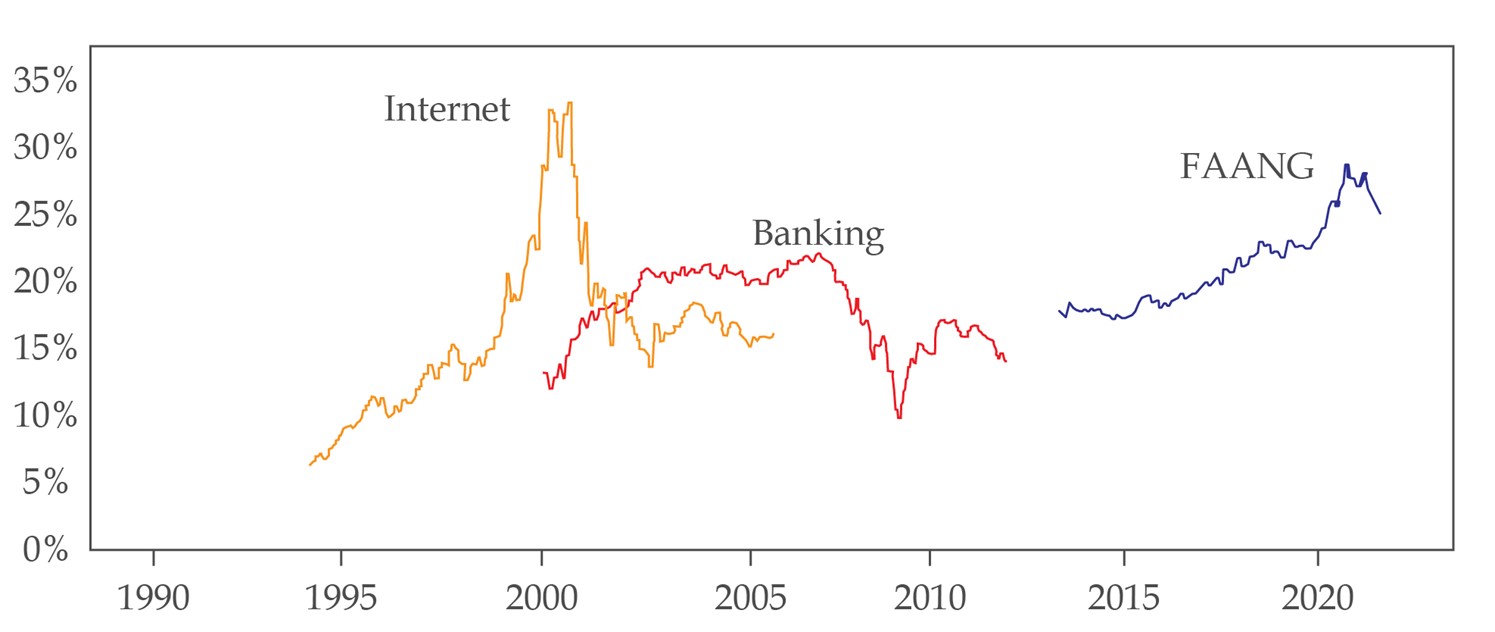
What can we do about this? Augment whatever we're looking at in terms of historical risk with observations of the market environment – things like leverage, liquidity, market concentration and where we are in the credit cycle. For example, as this chart illustrates, we have very high concentration, with the top 10 stocks in the S&P 500 accounting for more than 25% of the index’s total market cap, a level we have seen before when banks, internet stocks, and oil dominated in earlier high-volatility periods. Not a great omen for risk.