One of the challenges for financial planners is selecting or building capital market assumptions for major asset classes. Those assumptions determine how to adjust asset allocations and drive estimates of portfolio risk and expected return. Capital market assumptions largely determine the estimated benefits of diversification.
I have written extensively about the interplay of capital market assumptions and planning over the years. Outlooks for equity asset classes are typically built using one or a combination of three methods:
- The capital asset pricing model (CAPM)
- Valuation (using P/E, CAPE, etc.)
- Yield and growth (Gordon growth model)
The first of these is what I used to in many of my past articles on Monte Carlo-based financial planning. Wade Pfau, David Blanchett and others have written extensively about the second of these. Research Affiliates has an excellent online tool that provides examples of the latter two of these. These methods are appropriate for multi-year and longer outlooks.
Over the past couple of years, I have been increasingly interested in a less well-known method called market-based or option-implied outlooks. This approach has been in use for 20 years and is endorsed by Fed researchers for planning. In this article, I introduce option-implied asset class outlooks and provide asset class outlooks using this approach. The outlooks generated using this approach are most relevant for one or perhaps two years into the future. A shorter-term view helps with near-term planning and complements longer-term capital market outlooks.
Introduction to market-based outlooks
The key concept is that prices of options on equity indexes or ETFs can be used to build an implied consensus market outlook. The approach was first developed by Berkeley professor Mark Rubenstein and University of Konstanz professor Jens Jackwerth in the mid-1990s (see here and here). There are well-developed liquid markets on options (calls and puts) on major equity index ETFs. A call option on an S&P 500 index ETF is a bet on the probability that the S&P 500 will exceed a specific threshold level (the strike price) over time (from now until the expiration date). A put option is a bet that the price will fall below a specific threshold level (the strike price) from now until its expiration date. For a given expiration date, options trade at many different strike prices, from close to the current price to far above and below it. By combining the prices of call and put options at many different strike prices and the same expiration date, A mathematical model can calculate the implied probability of all possible returns between now and the expiration date. The result is a probability distribution of the options market’s consensus of future returns.
A simplified version of this approach is the calculation of the well-known VIX index. VIX uses prices of S&P 500 options that expire within 30 days to calculate an implied volatility. The concept introduced by Rubenstein and Jackwerth is that you can calculate a lot more than just volatility from the options prices. You can calculate the most-probable return (the mode of the distribution) until expiration of the options and the skewness (the asymmetry in probability of gain versus Loss). By looking at options with different expiration dates, you can calculate an outlook for different periods.
As the ETF markets have grown, options markets have developed on many indexes. This makes it possible to build option-implied return outlooks for a range of indexes.
While this approach is new to the advisory profession, it is quite well established in other areas of finance. The Minneapolis Fed, for example, maintains a version of this methodology to build outlooks for risk and return for the S&P 500, a range of commodities, a group of major banks, CPI and for other indexes.
These outlooks are often referred to as “risk neutral.” They represent the consensus of risk-neutral investors. In practice, investors tend to be risk averse, willing to pay more for downside protection than for an equivalent level of gain. As such, it is reasonable to assume that the option-implied probabilities of negative returns will be higher than for a risk-neutral investor; the probability of positive returns will be lower. Even considering the risk-averse bias, the option-implied outlooks are the best estimate of the market’s consensus.
Almost three years ago, I developed my own implementation of this conceptual approach. I built an optimizer to calculate the future distribution of returns using the prices of options at a range of different strike prices and the same expiration date. The model can consistently build option-implied outlooks that match the market prices of options on stocks and index ETFs very closely. I have been running and testing this model over the past two years and I am confident that this is a robust way to build asset class and individual stock outlooks. I have a range of articles with option-implied outlooks on Seeking Alpha.
In this article, I have generated the option-implied outlooks for five major equity asset classes, as represented by ETFs:
S&P500 (SPY)
EAFE (EFA)
Emerging Markets (EEM)
NASDAQ 100 (QQQ)
Russell 2000 (IWM)
All five of these have options that expire on January 21, 2022, allowing a consistent outlook period. The options used for this analysis were collected on the afternoon of February 26, 2021, the final trading day of the month. This outlook is, therefore, for the period from March 1, 2021 to January 21, 2022. I would prefer to build exactly a 12-month outlook, but this methodology is constrained by the dates on which options expire.
S&P 500 outlook
Let’s start with the outlook for the S&P 500, developed using options on SPY. I will explain this case in the most detail to highlight the major features of this approach. The outlook for price returns is presented as a probability distribution.
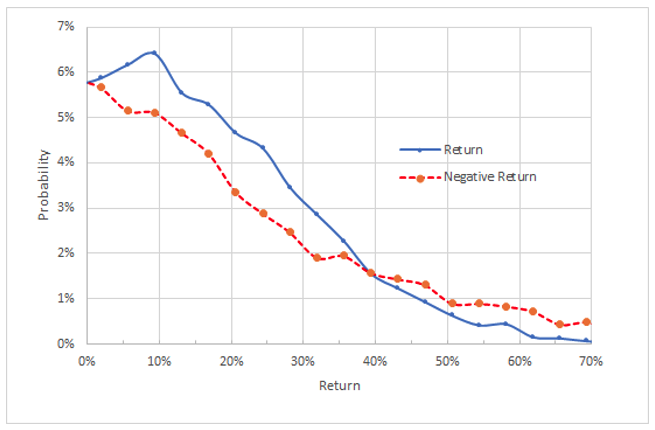
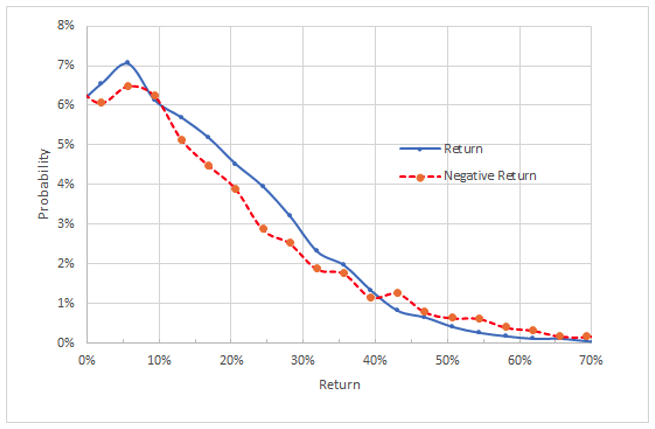
Option-implied price return outlook for SPY to January 21, 2022
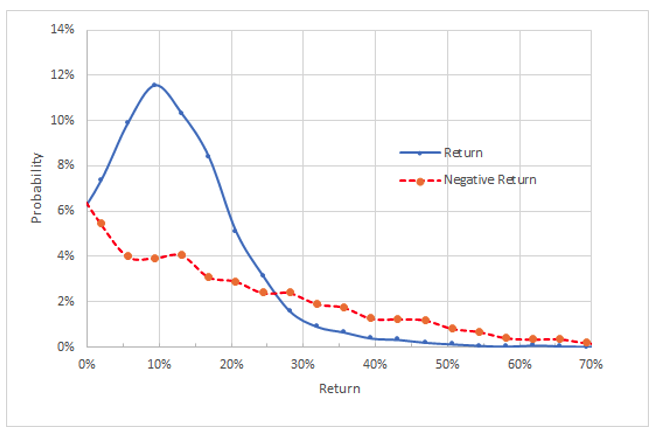
The blue line shows the probabilities of positive returns and the red line represents negative returns. For the red line, the returns (on the x axis) must be viewed as negative numbers. For example, a return of -10% has a probability of approximately 4%. (In other words, the red line has been rotated on the vertical axis.)
This outlook is characteristic of what one expects. The most probable return (9.4%) is positive, with a well-defined peak, and the negative tail is fatter than the positive tail. This means that large negative returns (in this case more extreme than -30%) are more likely (higher probability) than positive returns of the same magnitude. The most probable price return for SPY between now and January 21, 2022 is +9.4%. This is what one would use for the expected return over the next 12 months for planning purposes.
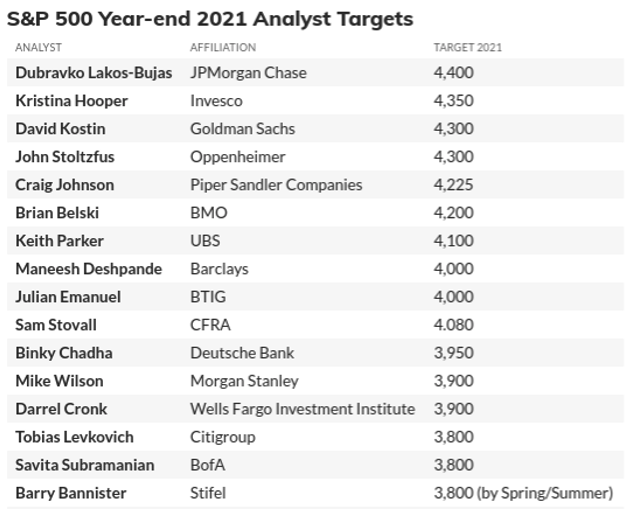
The price of the S&P 500 at the end of February was $3,811, so the SPY-based forecast would have the S&P 500 reaching $4,169 by January 21, 2022. Scaling this back to the end of 2021, this would be $4,144. This is in the middle of the 2021 year-end targets established by Wall Street analysts.
Wall Street analyst price targets for S&P 500 for 2021 as of end of 2020 (Source: Marketwatch)
The annualized volatility derived from the option-implied distribution is 24%, as shown in the graph below. This is markedly higher than the trailing three- (19.25%), five- (15.5%) and 10-year (13.9%) annualized volatility for the S&P 500. Morningstar’s calculated historical volatility for SPY is slightly lower than for the S&P 500. The numbers are close enough, however, that the outlook for SPY can be viewed as synonymous with that for the S&P 500. The option-implied outlook is for substantially higher volatility than we have experienced in recent years, which is an important consideration for planning.
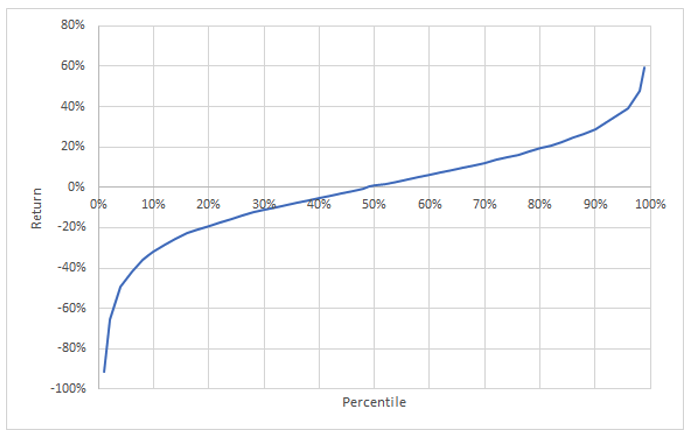
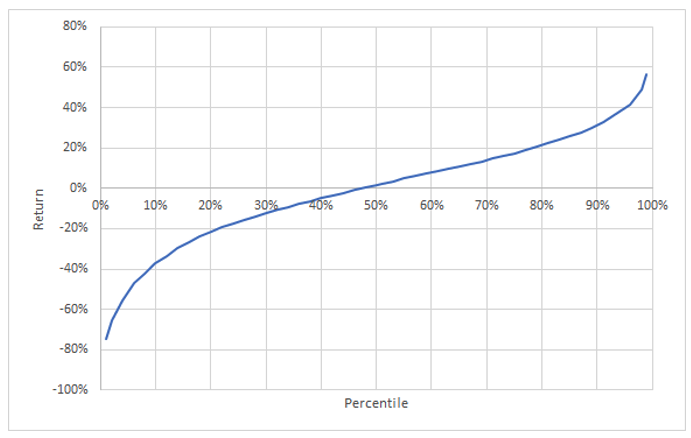
Percentiles of option-implied price return outlook on SPY to January 21, 2022
Another way to chart the option-implied probabilities of price return is in a “percentile chart.” This amplifies certain features of the results. The expected return crosses zero at the 40th percentile, which means that there is a 60% chance of price returns greater than zero over this period. The percentile chart also shows the asymmetry of probabilities of large positive and negative returns. The 10th percentile price return is -32%, but the 90th percentile price return is +20.6%.
Summary of results
Having gone through a detailed interpretation of the option-implied price return outlook for the S&P 500, this section provides a summary of the key metrics derived from the process applied to the other four major equity asset classes. The charts of the probabilities and percentiles are provided at the end of this article.
Summary of option-implied price return outlooks to January 21, 2022
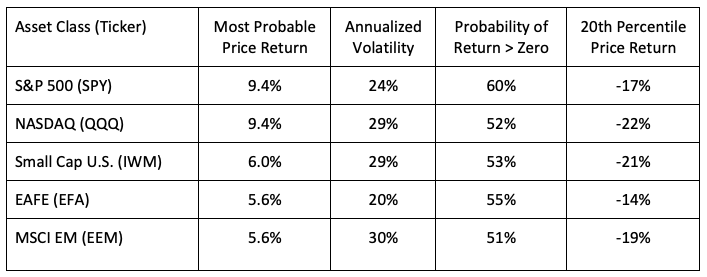
The most-probable returns and the annualized volatilities suggest that the S&P 500 (SPY) will provide the greatest return relative to risk (volatility) by a considerable margin among these equity asset classes. The NASDAQ (QQQ) has a most-probable price return equal to that of the S&P 500 but higher volatility. Especially in light of the very high gains in the S&P 500 and the NASDAQ over the last year, this bullishness is somewhat surprising (to me, at least).
The two asset classes with the highest probability of positive returns between now and January 21, 2022 are the S&P 500 (SPY) and EAFE (EFA), although all five have greater than 50% probability of positive returns. The most probable return for QQQ may be almost 10% (when you include dividends), but there is also a 48% chance that the price return is below zero between now and January 21, 2022.
The annualized volatilities from the option-implied outlooks are consistent with what one would expect on a relative basis. Emerging market, small-cap and the NASDAQ have higher expected volatilities than the S&P 500 or EAFE. EAFE has a significantly lower expected volatility than the S&P 500. In recent years, EAFE has had a slightly lower volatility than the S&P 500.
The option-implied volatilities are consistently higher than the trailing three-year volatilities in all cases. This has, historically, provided a useful warning for planning and risk management.
Dividend yield and annualized trailing three-year total return and volatility for ETFs representing each asset class (Source: Morningstar)
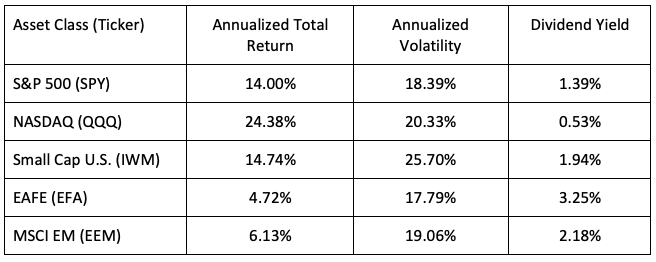
The option-implied outlook shows domestic equities continuing to outperform non-U.S. equities for the next year or so. The discrepancy is less dramatic once dividends are added, however. EAFE’s most-probable total return is 8.85% as compared to 10.79% if we add current yield to the option-implied price return (although this is actually for less than a year). Given EFA’s lower projected volatility, developed international stocks look reasonable on a risk-adjusted basis, although still less attractive than domestic equities. Emerging market stocks look less attractive still.
One of the useful features of option-implied outlooks is that they emphasize the probabilistic nature of any asset class projections. They are interval forecasts rather than point forecasts. Forecasts that provide only a single expected value (such as the analyst price targets for the S&P 500) lack a sense of uncertainty in outcomes.
Conclusions
I have introduced the market-implied (option-implied) method for deriving outlooks for major asset classes over the next year or so. This approach has a long academic history and, more recently, has been used by the Fed. This method is a useful tool for financial advisors in setting reasonable expectations for the next year, adjusting asset allocations and managing risk. This approach can help in choosing portfolios tilts (international versus domestic, small versus large) as well as in risk management. The option-implied outlooks provide a shorter-term complement to longer-term outlooks based on fundamental metrics.
The overall outlook is positive for equities, although the most-probable returns for U.S. equities are significantly below the high bar of the past three years and expected volatility is also somewhat higher than in recent years. The option-implied outlook for developed international equities is for higher returns than in recent years, and the expected volatility is expected to be lower than for domestic equities. Emerging market and small-cap stocks look the least attractive from among these equity classes because of their high risk.
Geoff Considine is founder of Quantext, an analytics consulting firm.
Additional Option-Implied Price Return Probabilities and Percentile Charts
NASDAQ (QQQ) Outlook
Option-implied price return outlook for QQQ to January 21, 2022
Percentiles of option-implied price return outlook on QQQ to January 21, 2022
Russell 2000 Outlook
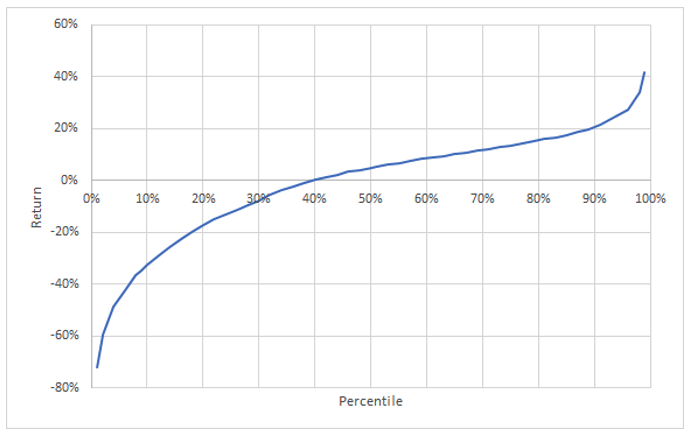
Option-implied price return outlook for IWM to January 21, 2022
Percentiles of option-implied price return outlook on IWM to January 21, 2022
EAFE Outlook
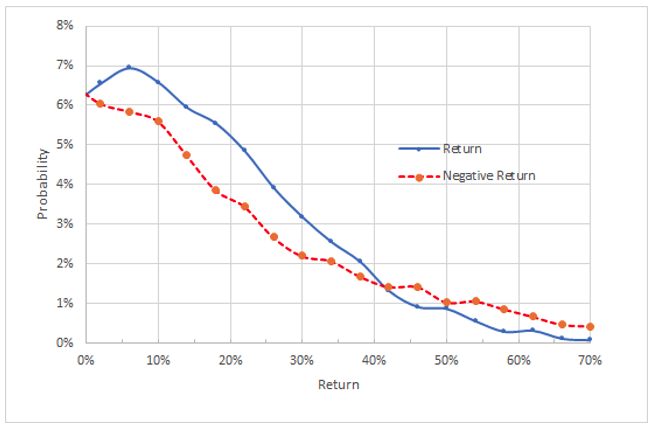
Option-implied price return outlook for EFA to January 21, 2022
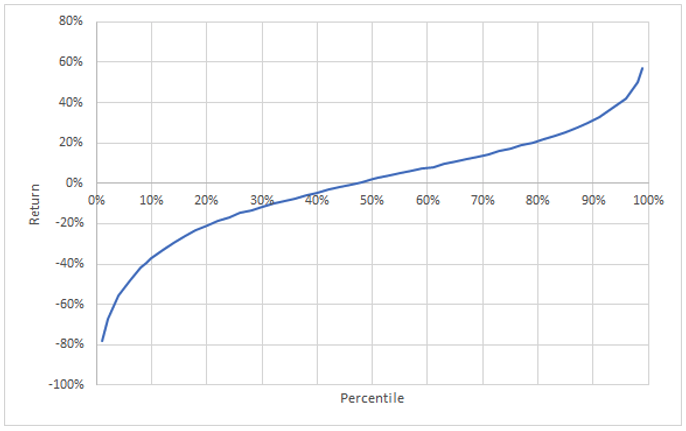
Percentiles of option-implied price return outlook on SPY to January 21, 2022
Emerging Markets Outlook
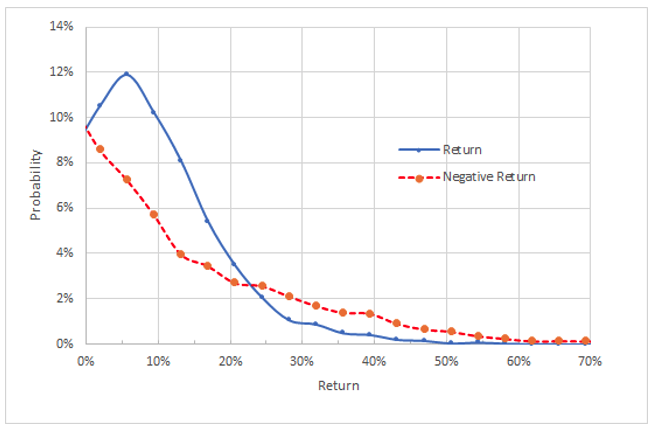
Option-implied price return outlook for EEM to January 21, 2022
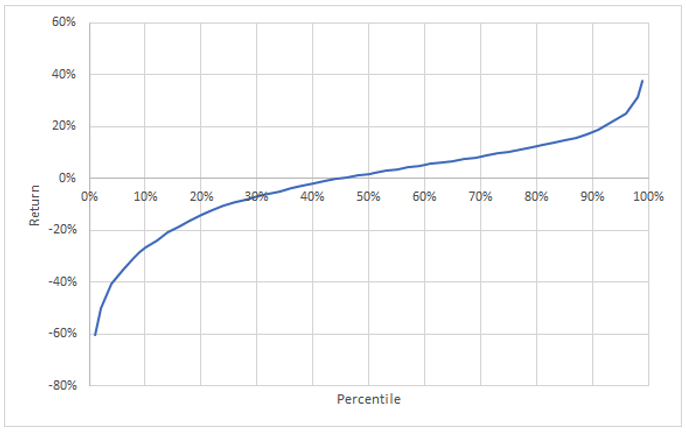
Percentiles of option-implied price return outlook on SPY to January 21, 2022