Calls for fiscal stimulus measures to target infrastructure are growing. But new research shows that infrastructure investments have offered few benefits to investors.
The combination of historically low bond yields and relatively high equity valuations have caused investors to seek nontraditional sources of diversification using alternative investments. In addition, with interest rates at zero and the Federal Reserve using all the tools in its arsenal, it seems likely that fiscal stimulus will have to continue to play an important role in the recovery from the COVID-19 crisis. The combination of these factors has led many to consider infrastructure investments as a source of income, a hedge against inflation, and a diversifier of traditional sources of risk.
Using the FTSE Global Core Infrastructure Index, which includes both developed and emerging markets, the market capitalization of the publicly listed infrastructure equity market has reached about $2 trillion. The definition used to represent listed infrastructure is based on the FTSE Global Developed Core Infrastructure Index. Infrastructure is defined by FTSE Russell as “companies that own, manage or operate structures or networks, which are used for the processing or movement of goods, services, information/data, people, energy and necessities.” Core infrastructure activities can be broken into three major categories:
- Transportation: roads, bridges and tunnels; ports; airports; railways; terminals and depots; and inland waterways.
- Energy: electricity generation, distribution and transmission; water supply projects; and pipelines.
- Telecommunications: fixed line, telephone and data networks; transmission lines or towers; wireless transmission towers; and transmission satellites.
Infrastructure also can be broken into several subsectors:
- Utilities: conventional electricity, gas distribution, multiutilities and water.
- Transportation: heavy construction, transportation services, business support services, railroads, and travel and tourism (i.e., railways).
- Others: pipelines, broadcasting and entertainment, fixed-line telecommunications, mobile telecommunications, diversified real estate investment trusts (REITs), specialty REITs, telecommunications equipment.
The two largest U.S. infrastructure funds are the iShares Global Infrastructure ETF (IGF) with assets of about $3.2 billion and the FlexShares STOXX Global Broad Infrastructure ETF (NFRA) with assets of about $1.7 billion.
Aidan Geysen of Vanguard’s research team investigated the investment characteristics of infrastructure in his study, “The Role of Infrastructure in a Portfolio.” His goal was to analyze the investment merits advanced by the investment industry to determine whether the increasing role of infrastructure in portfolios is well-placed. His data sample was a history of local-currency, globally listed infrastructure returns from 1990 through 2017. Following is summary of his findings:
- A comparison of factor exposures highlights infrastructure’s significant underweight to volatility and size, and an overweight to financial leverage driven by the higher level of debt held by infrastructure companies.
- Infrastructure compares with other alternative exposures that have similar characteristics – global minimum volatility, global high dividend and REITs.
- Global infrastructure and global minimum volatility would have served as effective diversifiers during the historical period of analysis. Either exposure would have performed a reasonably similar role from a volatility-reduction standpoint. However, minimum volatility provides a more diversified exposure, by stocks and sectors.
- The addition of either global infrastructure or global minimum volatility in place of bonds would have magnified volatility with even a small incremental increase – the funding source is relevant if the investor’s aim is volatility reduction.
- The equivalent risk of a 60/40 equity/bond portfolio could have been maintained by funding a 10% allocation to infrastructure from a mix of 5% bonds and 5% equities.
- While infrastructure has provided higher dividend yields than global equities, the MSCI World High Dividend Yield Index delivered additional pickup in yield.
- Infrastructure hasn’t been an especially effective inflation hedge – there is no material difference between the inflation-hedging benefit of infrastructure when compared with either the broader equity market or REITs. In addition, infrastructure returns did not have a statistically significant relationship with the level of interest rates. However, infrastructure has had a statistically significant inverse relationship with changes in interest rates – indicating a potential vulnerability in the event of a rising rate environment.
- The sensitivity of listed infrastructure to the business cycle is lower than that of the broader equity market and REITs, explaining the lower beta exposure.
These findings led Geysen to conclude that while infrastructure has historically met some widely held expectations – it offers above-average dividend yields and earnings stability – it has fallen short of others. He added: “An infrastructure overweight may be consistent with some investor goals, but … those same goals can often be met with investment options that are more broadly diversified by company and industry.”
Cautionary warnings
Geysen offered two cautions investors should consider before allocating to infrastructure. The first related to interest rates: “The 28-year period of analysis has been characterized by a bull market in bonds, which may have created a tailwind for infrastructure investments, with prospective returns potentially vulnerable in an environment of rising rates. The returns used in the historical analysis are limited to a time period where interest rates have mostly moved one way, which is a limitation on the investment case that needs to be carefully weighed with the potential benefits.”
His second caution related to concentration risk: “The top ten securities in the FTSE Global Developed Core Infrastructure Index make up 32% of the infrastructure sector. The sector exposures also demonstrate a high degree of industry concentration, with 34% of the infrastructure index made up of conventional electricity companies and 17% in railroads. These two sub-sectors, together with multiutilities, pipelines, and gas distribution, make up 80% of the infrastructure sector.” That said, if infrastructure is only a small allocation, this is not a significant problem.
Conclusion
Summing up, Geysen concluded: “For many investors seeking exposure to a well-diversified, low-cost and risk-efficient portfolio, a global market-cap exposure to equities and bonds may best meet their needs. Investors that have reframed the investment objective to achieve a higher-than-market income yield or to lower portfolio volatility without compromising the growth/defensive asset mix might consider an overweight to infrastructure.” He added: “To determine the appropriateness of infrastructure to achieve the investor’s goal, the alternatives also need to be considered. … Ultimately, it is essential that the potential benefits of an infrastructure overweight are weighed against the concentration risks that an overweight position introduces.”
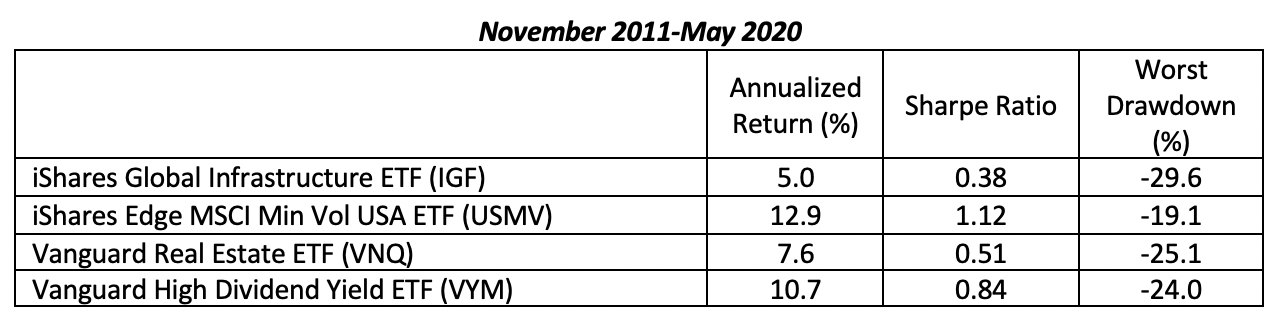
With these suggestions in mind, we can review the performance of the two aforementioned infrastructure ETFs, IGF and NFRA, and compare their returns to those of low volatility, REITs and high-dividend yield ETFs. The period is the longest available for each of the four. Data is from Portfolio Visualizer. We’ll begin with reviewing the performance of IGF.
IGF not only had the lowest return, but the worst Sharpe ratio and the largest drawdown. It is hard to make the case for its use relative to the alternatives that have similar characteristics.
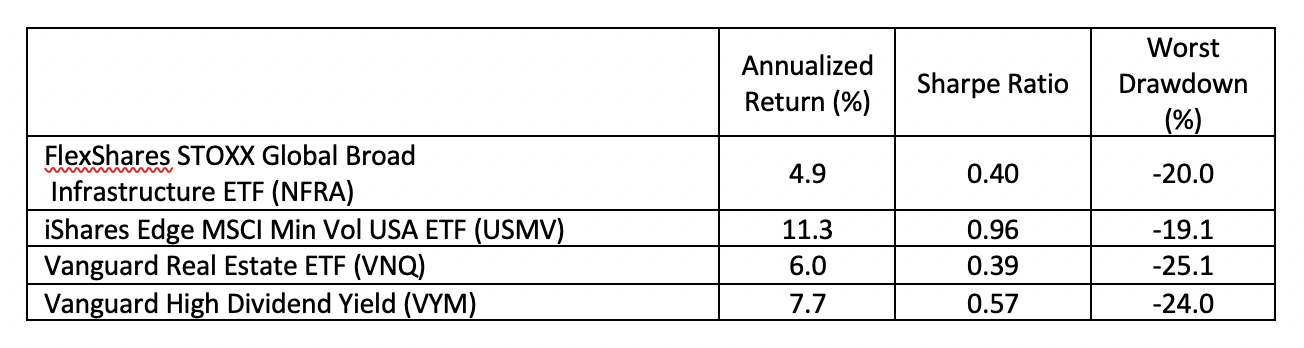
We now turn to reviewing the performance of NFRA.
November 2013-May 2020
Reviewing the data, it’s hard to make a case for including infrastructure in a portfolio.
Larry Swedroe is the chief research officer for Buckingham Strategic Wealth and Buckingham Strategic Partners.
Information presented herein is for educational purposes only and should not be construed as specific investment, accounting, legal or tax advice. Certain information may be based upon third party information and may become outdated or otherwise superseded without notice. Third party information is deemed to be reliable, but its accuracy and completeness cannot be guaranteed. Specific securities mentioned due to their size in the market or the availability to the public and should not be interpreted as a specific recommendation to purchase that security. By clicking on any of the links above, you acknowledge that they are solely for your convenience, and do not necessarily imply any affiliations, sponsorships, endorsements or representations whatsoever by us regarding third-party websites. We are not responsible for the content, availability or privacy policies of these sites, and shall not be responsible or liable for any information, opinions, advice, products or services available on or through them. The opinions expressed by featured authors are their own and may not accurately reflect those of the Buckingham Strategic Wealth® and Buckingham Strategic Partners® (collectively Buckingham Wealth Partners). IRN-21-1676
Read more articles by Larry Swedroe
 Calls for fiscal stimulus measures to target infrastructure are growing. But new research shows that infrastructure investments have offered few benefits to investors.