Capital flows into passive funds are a clear sign that investors have embraced John Bogle’s reflection, “In investing, you get what you don’t pay for.”
The argument for low-cost investing is commonly made in terms of accumulation: A fraction of a percent in saved costs will yield big dollars in amassed wealth.
The retiree’s objectives differ from the saver’s, however. The benefits of expense minimization in retirement should be framed in terms of withdrawal rates, portfolio longevity, and other relevant metrics.
I used the “Big Picture” software to examine the impact of investment expenses on historical retirement outcomes. The startling results may help advisors persuade retirees to lower investment costs and review their asset allocation strategy.
My approach
My research builds on the work of William P. Bengen, who in 1994 published his groundbreaking analysis, Determining Withdrawal Rates Using Historical Data. The originality of his work sprang from the use of rolling retirement periods for a hypothetical investor. He showed us how the retiree’s portfolio had fared, under various spending levels and equity weightings, in every investment landscape that retirees had ever faced, starting January 1, 1926. By accounting for the worst historical retirement periods, Bengen quantified sustainable spending in a way that past performance averages, by definition, could not.
Bengen focused initially on bond and large-cap stock portfolios, but later measured how the addition of other asset classes, such as small-cap stocks, affected safe withdrawal rates. He also began to use data that was quarterly, rather than yearly, in frequency, thus boosting his sample size of rolling periods. Bengen’s conclusions continue to enlighten and inform today’s financial professional.
With fee-conscious advisors in mind, I complement Bengen’s research by accounting for the effects of investment expenses on safe withdrawal rates. The Big Picture software allows advisors to build hypothetical portfolios, set a rebalancing frequency, enter an appropriate expense ratio, and instantly back-test their strategy over hundreds of rolling retirement periods (of up to 40 years). It illustrates for clients how dramatically diversification and cost have impacted safe withdrawal rates over the past nine decades.
The Big Picture program relies on the actual historical performance of indexes and inflation, using monthly frequency total return data from the Center for Research in Security Prices and Global Financial Data, Inc. Monthly data give us a “net” through which to sift history that is three times finer than that offered by quarterly-frequency data. As Bengen and others have noted: Two same-length retirements have, at times, experienced wildly different outcomes – even when they have started just months apart. By capturing more start dates in our sample, we gain deeper insights into historical outcomes.
Retirement simulations were run over 20-, 30-, and 40-year rolling periods, at annual expense burdens ranging from 0.1 to 3% (while the extremes of this range may be unrealistic, I include them for perspective). Since January 1926, there have been 898, 778, and 658 rolling 20-, 30-, and 40-year periods, respectively.
For comparison purposes, two portfolios were simulated. The first, named the “60/40” portfolio, contained a traditional mix of 60% large-cap stocks, and 40% intermediate-term government bonds.
The second, named the “Bernstein” portfolio, contained equal weightings of large-cap stocks, small-cap stocks, international stocks, and intermediate-term government bonds. This is the portfolio that William Bernstein, in his excellent book, The Intelligent Asset Allocator, set forth as offering a reasonable degree of diversification, without incurring undue complexity. It was chosen arbitrarily for illustration. Portfolios were rebalanced annually.
Lastly, the concept of “safe” is defined here as the maximum level of spending that could be maintained historically, while still attaining a given goal in 90% of historical periods of a specified duration. The goal studied here was that of remaining solvent (a goal of leaving “x” dollars as a legacy could have been stipulated instead). Withdrawals were constant in real-dollar terms (i.e. adjusted for inflation as it prevailed in each historical period that was tested), and withdrawal rates defined as annual spending as a proportion of initial portfolio value.
Of course, “safe” will mean something different to each retiree; some may prefer to apply a more conservative (higher) historical success rate, while others may be comfortable with, say, 80%. Whatever one’s risk threshold, it can be back-tested in the Big Picture software.
Findings
It is striking how strongly investment expenses eroded safe withdrawal rates.
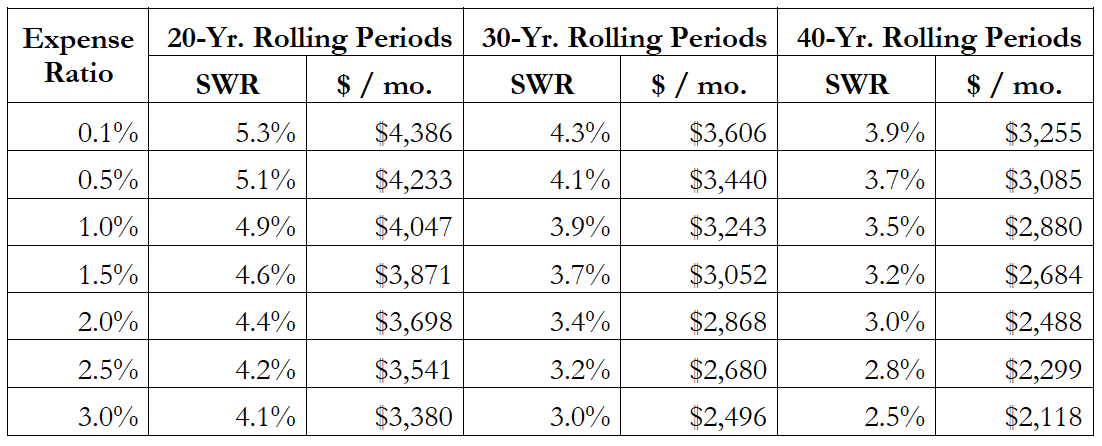
Over 20-year horizons, the safe withdrawal rate for the 60/40 portfolio was 5.3% at an expense ratio of 0.1%. In other words, 5.3% was the highest rate of spending that could be sustained, in 90% (808 out of 898) of historical 20-year periods, without completely depleting the portfolio’s value. In 10% of periods, this rate was too high, and the portfolio ran dry before the 20 years were up.
At an expense ratio of 3%, the safe withdrawal rate fell to 4.1%. That is, in order to remain solvent at the same historical frequency, this higher expense burden necessitated a whopping 23% decrease in spending. For a portfolio with an initial value of $1 million, that’s a drop of $1,006 in monthly spending, from $4,386 to $3,380.
This pattern played out similarly over 30- and 40-year retirement horizons. Safe 30-year spending tumbled from a 4.3% withdrawal rate, at an expense ratio of 0.1%, to a 3% withdrawal rate, at an expense ratio of 3% – a fall of nearly one-third or $1,110 in monthly spending (again, assuming an initial value of $1 million). Safe 40-year withdrawal rates, meanwhile, fell from 3.9% to 2.5% – a 35% reduction.
Table 1 summarizes the impact of various expense burdens on the 60/40 portfolio’s spending capacity. As you can see, safe withdrawal rates withered steadily as costs rose.
Table 1. Safe withdrawal rates (SWRs) for the 60/40 portfolio, assuming a 90% historical success rate, and a $1 million initial investment
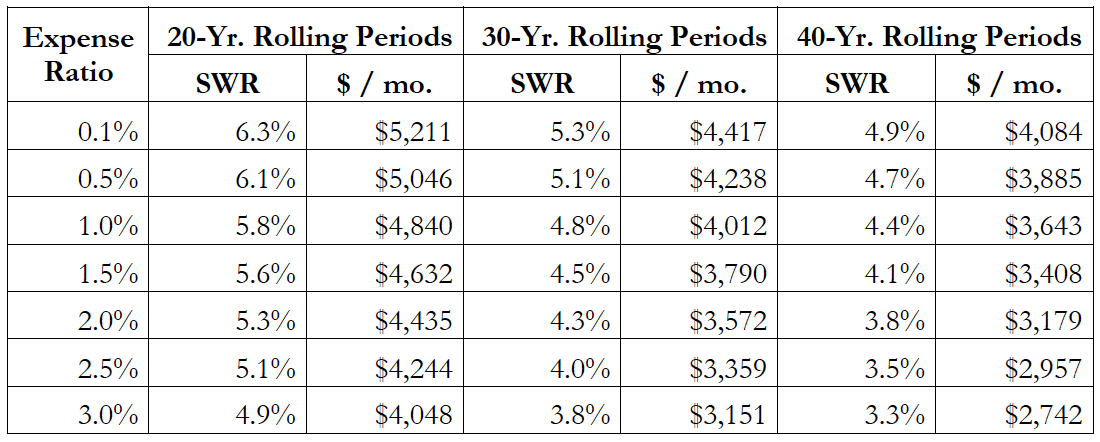
It is also striking how much better the Bernstein portfolio held up. Over each of the three horizons – 20, 30, and 40 years – the Bernstein portfolio supported appreciably higher withdrawal rates than the 60/40 portfolio. For example, over 30-year periods, at an expense burden of 0.1%, the Bernstein portfolio supported a withdrawal rate of 5.3% versus 4.3% for the 60/40 portfolio. At an expense burden of 1.0%, it was 4.8% against 3.9%. That’s about $800 more in sustainable monthly spending, at no more frequent a rate of portfolio insolvency.
Not only did the Bernstein portfolio support higher safe spending levels, sustainable spending suffered proportionately less from higher expenses than it did with the 60/40 portfolio. While an increase in expenses from 0.1 to 3% forced safe 30-year spending down by 31% with the 60/40 portfolio, the decline in safe spending was 29% with the Bernstein portfolio.
Table 2 summarizes the impact of various expense burdens on the Bernstein portfolio’s spending capacity.
Table 2. Safe withdrawal rates (SWRs) for the Bernstein portfolio, assuming a 90% historical success rate, and a $1 million initial investment
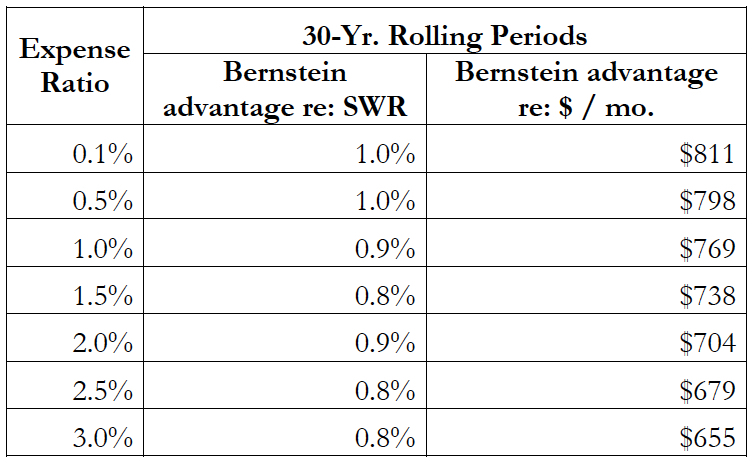
Table 3 and Figure 1 highlight the Bernstein safe withdrawal “advantage” over the 60/40 portfolio in the case of rolling 30-year periods.
Table 3. Differences in safe 30-year spending levels between the Bernstein and 60/40 portfolios, assuming a 90% historical success rate, and a $1 million initial investment
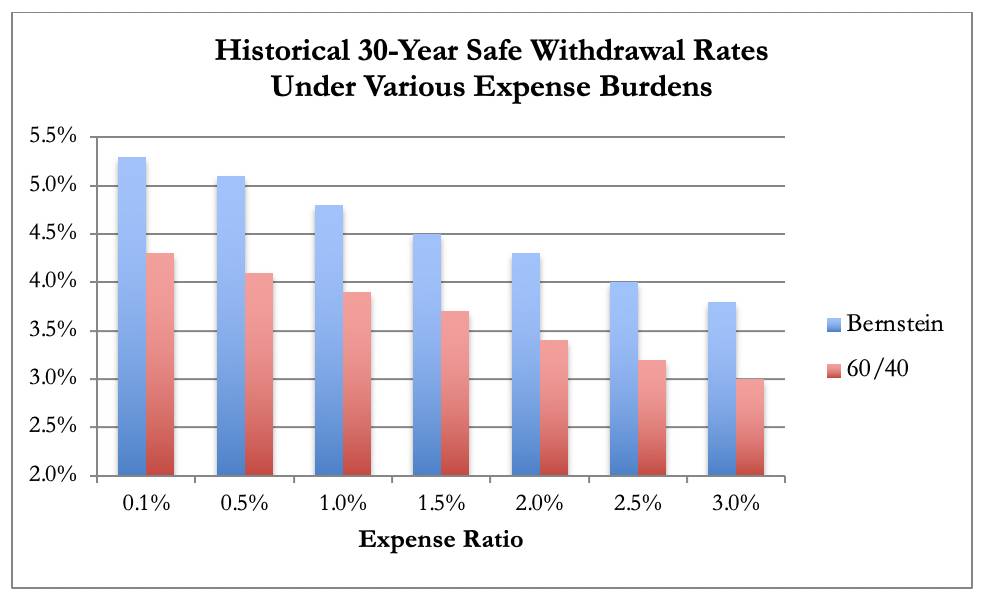
Figure 1. Differences in safe 30-year spending levels between the Bernstein and 60/40 portfolios, assuming a 90% historical success rate
Keen readers will discern that, even at twice the annual cost burden, the Bernstein portfolio supported higher spending than did the 60/40 portfolio.
There are several sides to the safe withdrawal rate “coin.” The drag of expenses can also be illustrated in terms of portfolio longevity: How long the portfolio lasted before all its capital was exhausted by withdrawals. At a historical success rate of 90%, a withdrawal rate of 4%, and an expense ratio of 0.1%, the 60/40 portfolio expired in 37 years. At an expense ratio of 0.5%, it lasted 33 years and, at an expense ratio of 3%, it lasted 20 years. For every 10-basis-point increase in expenses, the 60/40 portfolio lasted, on average, 0.6 fewer years.
As in the case of safe withdrawal rates, the Bernstein portfolio trounced the 60/40 portfolio with respect to longevity. At all expense burdens up to 1.6%, and again assuming withdrawals at 4%, the Bernstein portfolio survived for at least 40 years, 90% of the time. At an expense ratio of 1.7%, it lasted 39 years. Even at a punishing 3% expense ratio, it lasted 27 years. This portfolio was the investment equivalent of the Energizer Bunny.
Another side of the coin is legacy capital. In other words, how much wealth could be left to heirs? I assume, again, an initial investment of $1 million, a 30-year horizon, and withdrawals at 4%. Under these parameters, the 60/40 portfolio ended, historically, with a median balance of $4.23 million at an expense ratio of 0.1%. At an expense ratio of 2% it ended with a median balance of $1.19 million and, at expense ratios of 3%, with a median balance of $319K.
By now it will come as no surprise that the Bernstein portfolio again beat the 60/40 portfolio. By this metric, however, the differences between them are especially eye-popping. At an expense ratio of 0.1%, the Bernstein portfolio ended with a median balance of $7.91 million. In other words, after 30 years of constant withdrawals at 4%, the median value of this portfolio had increased by a factor of almost eight. This is nearly twice the amount accumulated just as often in the 60/40 portfolio. At an expense ratio of 1%, the Bernstein portfolio ended with a median balance of $4.88 million. Even at an expense ratio of 3%, the median residual capital was slightly above the initial $1 million investment.
Some investors may wish to consider yet another side of the coin: historical odds. Holding all variables constant, I used the Big Picture software to compute the historical success rate of each portfolio at various expense levels.
Here’s what I found: The 60/40 portfolio, withdrawn from at 4%, survived 98% of historical 30-year periods at an expense ratio of 0.1%. Stated differently, it survived 762 out of 778 rolling retirement periods. At an expense ratio of 0.5%, it survived 93% of rolling periods and, at an expense ratio of 3%, it survived about half of them. With each ten-basis-point increase in expenses, the historical likelihood that the 60/40 portfolio remained solvent over thirty years fell by an average of 160 basis points.
The Bernstein portfolio, for its part, remained solvent in every 30-year period, at expense ratios up to 0.8%. At an expense ratio of 3%, it survived four-fifths of periods.
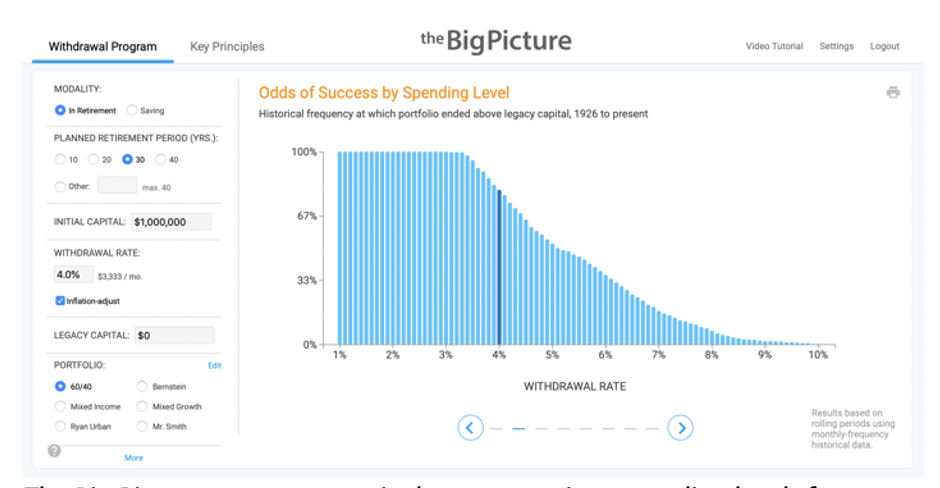
The Big Picture computes survival rates at various spending levels for a given portfolio.
In either case, the historical odds appear to have been quite favorable overall, particularly in light of the various bumps along the road: The Great Depression, WWII, 1970s stagflation, fifteen recessions, eight bear markets, and a host of other misfortunes.
A final side of the coin is minimum required initial portfolio value. Given, once again, a 30-year horizon, a success rate of 90%, a 0.5% expense ratio, and $3,333 in monthly spending (equivalent to 4% drawdowns on a $1 million portfolio), the historical minimum required investment was $968,794 for the 60/40 portfolio. For the Bernstein portfolio, it was just $786,486, or about a fifth less. This finding is sure to pique the interest of those who are saving for retirement.
Closing thoughts
It’s worth recalling that we are dealing in historical data, and that the future cannot be predicted. But the past offers important clues.
Asset allocation is a tricky matter. Some advisors may look at the Bernstein portfolio and feel hesitant about so (seemingly) high a proportion of small-cap and international stocks, which have tended to be more volatile. Yet the numbers don’t lie: Over the past 94 years, this portfolio was the better option for retirees by all measures considered, and across a range of retirement durations. The “safer” (conventionally speaking) portfolio was actually the riskier one.
Superior results to those of the 60/40 portfolio could have been achieved with an infinite number of alternatives to the Bernstein portfolio, of course. The Big Picture program offers 11 major asset classes with which one can easily experiment. The point is to illustrate for the prospect (or reinforce for the existing client) the importance of proper asset allocation, and the historical superiority of some allocation strategies over others.
Whatever strategy is chosen, a consideration of cost is vital to the retiree’s chances of success. I hope the findings presented here will help strengthen advisors’ commitment to cost minimization, and serve as useful material in client meetings.
Ryan McLean is the founder of BigPicApp.co. He worked previously as an equity analyst at Morningstar and as a business consultant in Latin America. He holds an MBA in finance from McGill University.
______
Note: Historical data range from January 1, 1926 to September 30, 2020.
More Diversity & Inclusion Topics >
 Capital flows into passive funds are a clear sign that investors have embraced John Bogle’s reflection, “In investing, you get what you don’t pay for.”