The top-heavy outperformance of the FAANG stocks is not a historical anomaly, but history shows that they are likely to be tomorrow’s underperformers.
The tremendous dispersion of returns in the stocks within the S&P 500 over the past several years has brought great attention to the largest companies in the index. As of the end of August 2020, the six largest listed stocks, Apple (7.3%), Microsoft (5.9%), Amazon (5.0%), Facebook (2.4%) and Alphabet (Class A shares 1.7% and Class C shares 1.7%), made up 24% of the market cap of the index. They became the largest stocks because of their strong performance over the prior 10 years. In addition, year-to-date through August, while the S&P 500 Index returned 10%, those five stocks returned 49%, while the remaining stocks in the index returned -3%.
Even more compelling is that over the 10 years ending August 2020, a portfolio of the so-called FAANG stocks – Facebook, Amazon, Apple, Netflix (number 21 on the list as of 9/29) and Google’s parent company, Alphabet – held in proportion to their market caps would have delivered an average annual return of more than 34% a year, more than twice the 15.2% return of the index (the return of which was boosted by the performance of the FAANG stocks).
Expected versus unexpected returns
How should investors think about the exceptional performance of the FAANG stocks? As Professor Ken French explains: “Stock returns are explained by the expected return and the unexpected return. The expected return is the best guess of what will happen based on all the information currently available. The unexpected return is the surprise, the difference between what does happen and what was expected. Investors should base their portfolio decisions on expected future returns, not recent realized returns, and the two can differ by a lot.”
Clearly, 10 years ago investors were not expecting 35% returns from the FAANG stocks. Those returns were realized because realized results were much better than investors expected – the unexpected (unpredictable) good news produced those high unexpected stock returns over the last decade. However, investors should not expect high unexpected returns to persist because the expected value of the unexpected returns must be zero.
We now turn to the issue of concentration.
Is the market top-heavy?
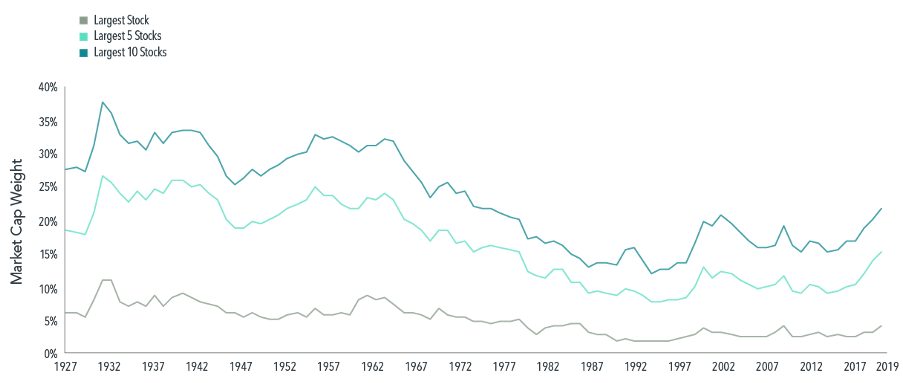
While investors may think the current “top-heavy” concentration of the S&P 500 is unusual, as you can see in the following chart from Dimensional, that is not the case. In fact, from 1927 through the mid-1960s, the top 10 stocks made up more than 25% of the market cap of the index.
Source: Dimensional, using data from CRSP and Compustat. Includes all U.S. common stocks. Largest stocks identified at the end of each calendar year by sorting stocks on market capitalization. CRSP and Compustat data provided by the Center for Research in Security Prices, University of Chicago.
The lesson provided by the chart is that concentration of the stock market in a few large companies such as the FAANG stocks in recent years is not a new normal; it is old normal.
Investor behavior
Among the most well-documented behaviors of individual investors are “recency” and “herding.” Recency bias is the tendency to overweight recent events/trends and ignore long-term evidence. This leads investors to buy after periods of strong performance – when valuations are higher and expected returns are now lower – and sell after periods of poor performance – when prices are lower and expected returns are now higher. Buying high and selling low is not exactly a prescription for successful investing. Yet it is the way many individuals invest.
Herding is the behavior that causes investors to buy investments based on the fact that many others are buying them. Herding behavior is also influenced by FOMO, the fear of missing out. Recency bias, herding and FOMO are destructive biases that can cause even investors with well-thought-out plans to abandon them.
How should investors react to the dramatic outperformance of the largest companies and their expected future performance? As always, we look to the historical evidence for guidance.
Historical evidence
The researchers at Dimensional examined the performance of the 10 largest companies by market cap over the period 1927-2019. Following is a summary of their findings:
- Over the five- and 10-year periods before becoming one of the 10 largest, they outperformed by 19.3% per annum and 10.0% per annum, respectively.
- Over the five- and 10-year periods after becoming one of the 10 largest, they underperformed by 1.1% per annum and 1.5% per annum, respectively.
Dimensional provided the example of Intel. The technology giant posted average annualized excess returns of 29% in the 10 years before the year it ascended to the top 10. In the next decade it underperformed the broad market by nearly 6% per year. Dimensional also noted that some companies have stayed on top for a long time. AT&T was among the largest two for six straight decades beginning in 1930. General Motors and General Electric ranked in the top 10 at the start of multiple decades. IBM and Exxon were also mainstays in the second half of the 20th century. The authors added: “Moreover, while the definition of ‘high-tech’ is constantly evolving, firms dominating the market have often been on the cutting edge of technology. AT&T offered the first mobile telephone service in 1946. General Motors pioneered such innovations as the electric car starter, airbags, and the automatic transmission. General Electric built upon the original Edison light bulb invention, contributing to further breakthroughs in lighting technology, such as the fluorescent bulb, halogen bulb, and the LED. So technological innovation dominating the stock market is not a new normal; it is an old normal too.”
Summary
One of my favorite expressions is that there is nothing new in investing, only the investment history you don’t know. While the types of business that make up the largest stocks change over time, we have “been there and done that” with both concentration and dramatic outperformance of stocks that go on to become one of the 10 largest. We also have seen what happens once they become one of the 10 largest; they tend to underperform the market over the succeeding five- and 10-year periods. This seems logical, as investors would likely view them as great companies and, as such, safe investments – unless you believe that risk and expected return are unrelated, safe investments must have lower expected returns.
The evidence, as presented annually in the S&P Active Versus Passive Scorecard, demonstrates that it is the extreme difficulty of systematically predicting which companies will outperform the stock market that makes active management a loser’s game – a game in which the odds of winning are so low that it’s not prudent to play. This insight also highlights the importance of having a broadly diversified equity portfolio that provides exposure to a vast array of companies and sectors.
As to the future performance of the FAANG stocks, Professor French noted: “The past decade of extraordinary realized returns tells us little about the FAANG stocks’ future expected returns. And unfortunately, this is a general result. For most investments and most investment horizons – a month, a year, five years, even 10 years – the realized return is driven far more by the unexpected return than the expected return.”
Larry Swedroe is the chief research officer for Buckingham Wealth Partners.
Important Disclosure: The analysis contained in this article are for informational and educational purposes only and should not be construed as specific financial, accounting, legal or tax advice. The analysis contained in this article is based upon data and information available at the time which may become outdated or otherwise superseded at any time without notice, and the opinions of BSP. Certain information contained is based upon third party sources, which are deemed to be reliable, but their accuracy or completeness cannot be guaranteed. By clicking on any of the links above, you acknowledge that they are solely for your convenience, and do not necessarily imply any affiliations, sponsorships, endorsements or representations whatsoever by us regarding third-party websites. We are not responsible for the content, availability or privacy policies of these sites, and shall not be responsible or liable for any information, opinions, advice, products or services available on or through them.
Read more articles by Larry Swedroe
 The top-heavy outperformance of the FAANG stocks is not a historical anomaly, but history shows that they are likely to be tomorrow’s underperformers.