Advisor Perspectives welcomes guest contributions. The views presented here do not necessarily represent those of Advisor Perspectives.
A recent article in Advisor Perspectives, using data from Backend Benchmarking (BEB), noted that robos had significantly underperformed and suggested that they had “failed” investors. The conclusion is not robust, though, because the findings are based entirely on performance comparisons against BEB’s benchmarks and no alternative tests were conducted or considered. Unlike traditional indexes that tend to be relatively similar (e.g., for large cap equities), there is significantly more ambiguity when creating (and implementing) any multi-asset benchmarking strategy (e.g., for a 60/40 portfolio)1 and using only BEB’s approach could have biased the findings.
An alternative way to assess robo performance would be to see how they fared against other portfolios with similar risk levels, such as balanced mutual funds and models (i.e., their peers). If robos collectively underperformed their peers, the initial “failure” conclusion would hold additional weight; if not, it should be revisited.
After completing such an analysis, I find no economically or statistically significant difference in performance, which suggests the “failure” diagnosis is premature. My findings were consistent with my expectations, though, since it is questionable that any group of investments (or strategies) should systematically underperform (or outperform) on risk-adjusted basis.
It’s too early to know how robos are going to impact investors, especially versus alternatives (i.e., do-it-yourself-or financial advisor-constructed portfolios); however, from a performance perspective, I give robos an “A” for being average, so far, and hope that future research can make more meaningful statements as to how robos truly impact investor outcomes.
Robo portfolios
Robo portfolios are usually pretty boring. Boring is typically a good thing when it comes to investing, though, since boring strategies tend to do pretty well over time. Robos tend to invest in ETFs and are unlikely to be alpha-generating machines, at least among some of the more established/larger players. While it’s possible the style tilts and timing choices of the robos might help performance, the alpha expectation should be pretty close to zero before fees, especially across a wide number of providers (it is unlikely everyone is going to time the market correctly), and negative after fees.
How is it, then, that robos could have collectively “failed” investors and underperformed their benchmarks collectively about 1% per year? Fees are obviously going to be a factor, as they would be for any strategy that employs any level of personalization and/or advice for an additional fee. Similar to more traditional financial advisors, robos are increasingly offering services beyond investment management, and therefore assessing their value solely based on performance is simplistic (e.g., would advisors be deemed to fail investors if their portfolios also underperformed?).
One potential issue with the original analysis, though, is the benchmark. Benchmarking is an incredibly important activity when determining the efficacy of a given strategy, and BEB does a better job than most. BEB’s benchmarks are a combination of ETFs and are detailed on page 36 of its most recent report. There is quite a bit of ambiguity when building a multi-asset benchmark, though, and it’s not clear how robust the original findings would be to a different benchmark.
Since we do not have detailed information on holdings for the taxable portfolio for each robo (e.g., the allocation to asset sub-classes like municipal bonds, how asset class weights have shifted over time, etc) developing different sets of benchmarks would be difficult. An alternative test, though, would be to see how the performance of the robo portfolios compared to other balanced portfolios, which is the analysis I conducted for this article.
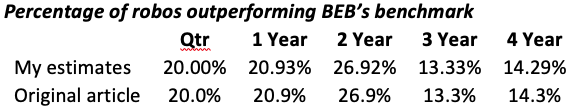
The original article included information about the percentage of robos that outperformed their BEB benchmark. I extracted the total returns for the taxable portfolios (pages 19 and 20) in the most recent (Q1) report. Below is comparison of my estimates of the percentage of robos that outperformed versus the originally reported numbers. Our estimates are identical, so we’re looking at the same data.

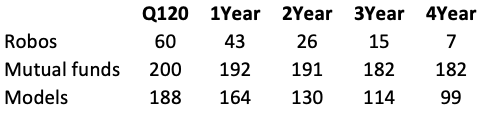
Two possible bogeys to compare the robo performance to would be balanced mutual funds and models. I conducted a query in Morningstar Direct on June 2, 2020 for all mutual funds with a Morningstar category with equities between 50% and 70% (U.S. fund allocation=50% to 70% equity), which includes only the oldest share class for a given fund, and for models with the same equity range (U.S. model allocation=-50% to 70% equity). The table below includes the number of portfolios with performance available for each of the respective portfolio groups, as of Q1 2020.
The groups aren’t independent; for example, Vanguard has robo-advisor, mutual funds and models (more on this later). However, those three groups give us an opportunity to better understand how the performance of robos compares to other professionally managed portfolios.
The equity allocations used for the performance-proxy portfolios, which are mutual funds and models (50%-70%), have a very similar equity allocation as the portfolios in the BEB test data. The initial and current equity allocations are available for each robo portfolio starting on page 24 of the BEB report. The average initial allocation (at account set-up) for the robos is 61% with a min/max of 45%/73% with a standard deviation of 5%. The average current equity level for the robos is 60% with a min/max of 45%/70%. The one fund with an equity level below 50% (the Wealthfront PassivePlus portfolio, at 45% equities) has a significant (19%) weight to miscellaneous.
Historical robo portfolio performance was extracted from the BEB report and the historical performance for the mutual funds and models was extracted from Morningstar Direct. Since the robo portfolios include only current robo providers (i.e., it is not survivorship-bias free), only mutual funds and models with current performance are included for comparison purposes.
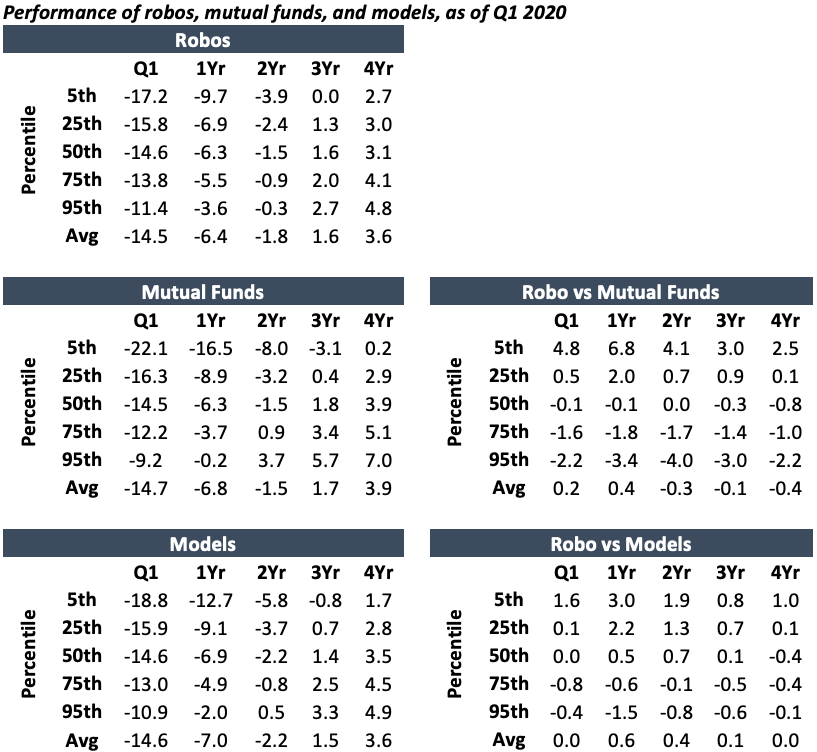
The table below includes the distribution of the performance values for each period, as well as a comparison of the robo-performance distribution versus mutual funds and models.
The overall performance of the robos is similar to mutual funds and models and none of the differences are statistically or economically significant. In other words, when the bogey is changed from the BEB hypothetical benchmark to an actual alternative portfolio, robos no longer appear to “fail” at all; rather they are performing in-line with their peers.
While the robos may have lower all-in costs compared to the mutual funds, some also have significant allocations to municipal bonds, which is likely to have negatively affected relative performance. For example, according to the BEB report, 100% of the fixed income allocation for the Vanguard Personal Advisor Services portfolio is invested in municipal bonds (versus 43% for Betterment and 57% for Schwab). The Barclays Municipal Bond Index has underperformed the Barclays Aggregate Bond Index by 3.78%, 5.08%, 2.07%, .87%, and .72% over the last quarter, one-year, two-year, three-year, and four-year periods, respectively.
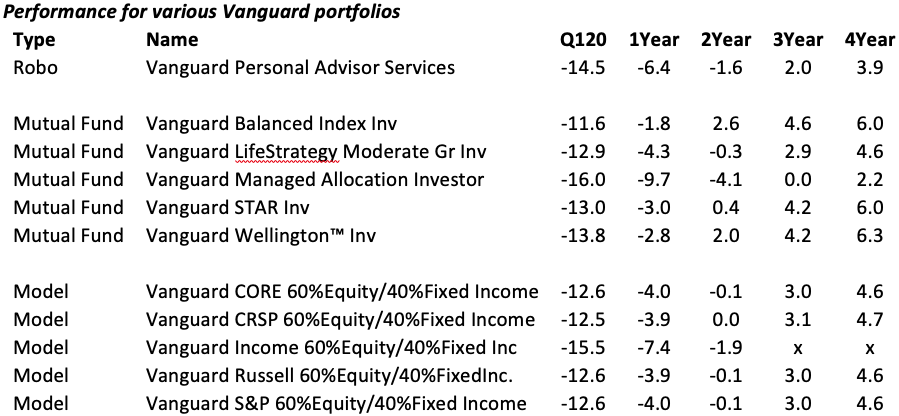
There were significant differences in performance for some entities that have data available for each of three portfolio-types (robos, mutual funds, and models). This is included below for Vanguard:
It is unclear why Vanguard’s robo portfolios mostly underperformed its professionally managed strategies. While some of the portfolios are managed with different mandates (e.g., the Balanced Index is domestic-focused and, as noted previously, and the robo portfolio has a significant allocation to municipal bonds) one approach shouldn’t necessarily outperform the other.
Conclusions
The conclusion that robos have “failed” from a performance perspective appears to be premature. While robos underperformed a benchmark created by BEB, it is not clear if the performance would persist if BEB used a different benchmarking approach. Additionally, the performance of robos has been relatively consistent with other, similar balanced portfolios. This suggests the benchmarking approach employed by BEB is not necessarily representative of the strategies of the group and that the relative performance of robos probably shouldn’t necessarily be extrapolated to other domains (i.e., financial advisors can’t say their portfolios are better or worse, on average, based on the BEB analysis).
The concluding remark in the original article is somewhat ironic. It notes the, “enduring power of a passive, 60/40 portfolio.” Robo strategies are typically relatively passive investing approaches; therefore, to suggest they have failed investors, despite the fact they invest in a way that seems to be close to ideal, is a bit of a contradiction.
David M. Blanchett, Ph.D., CFA, CFP®, is head of retirement research for Morningstar's Investment Management group.
1 For example, there is no such thing as a truly passive target-date fund
Read more articles by David Blanchett