Advisor Perspectives welcomes guest contributions. The views presented here do not necessarily represent those of Advisor Perspectives.
Hecato says, “cease to hope and you will cease to fear:”’... The primary cause of both these ills is that instead of adapting ourselves to present circumstances, we send out thoughts too far ahead.
– Seneca
The coronavirus (COVID-19) entered the global mainstream thinking in February when Iran and Italy reported large number of cases. Since then, country after country has announced lockdown measures. The thing about being in a lockdown with a constant barrage of news is that one quickly starts to imagine the worst. COVID-19 is a scary topic, especially because there is significant uncertainty around the primary variables around this pandemic.
But a rational assessment of the capital markets shows that much of the market decline was due to liquidation-driven selling. Indeed, prospective returns from quality business have greatly improved.
Performance of equity markets
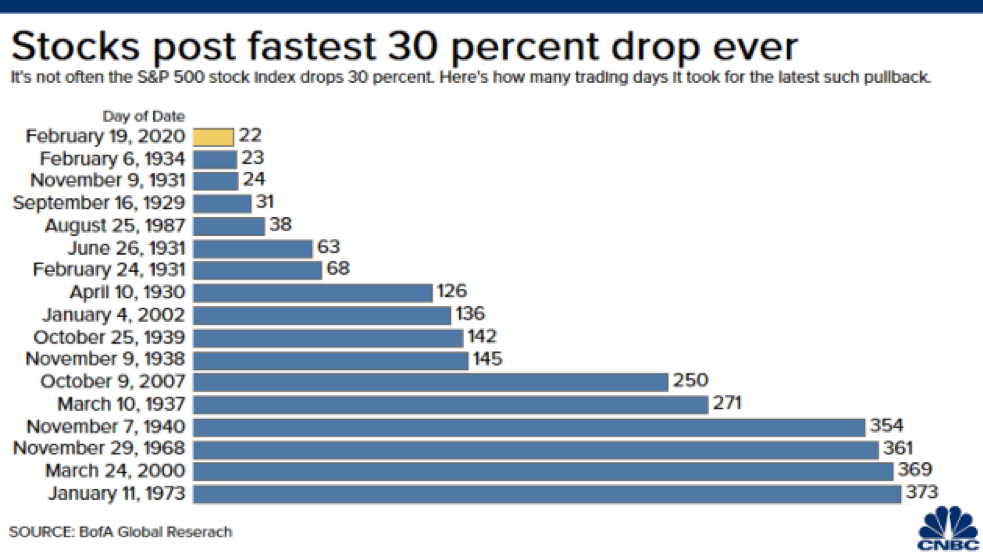
The financial markets, driven by a panicked response, registered volatile price actions. The S&P 500 fell 30% within 30 trading days from its record highs reached on February 19th. As seen in Figure 1, this was the fastest drop of this magnitude in the recorded history of the index.
Figure 1: Speed of 30% Declines

Source: CNBC
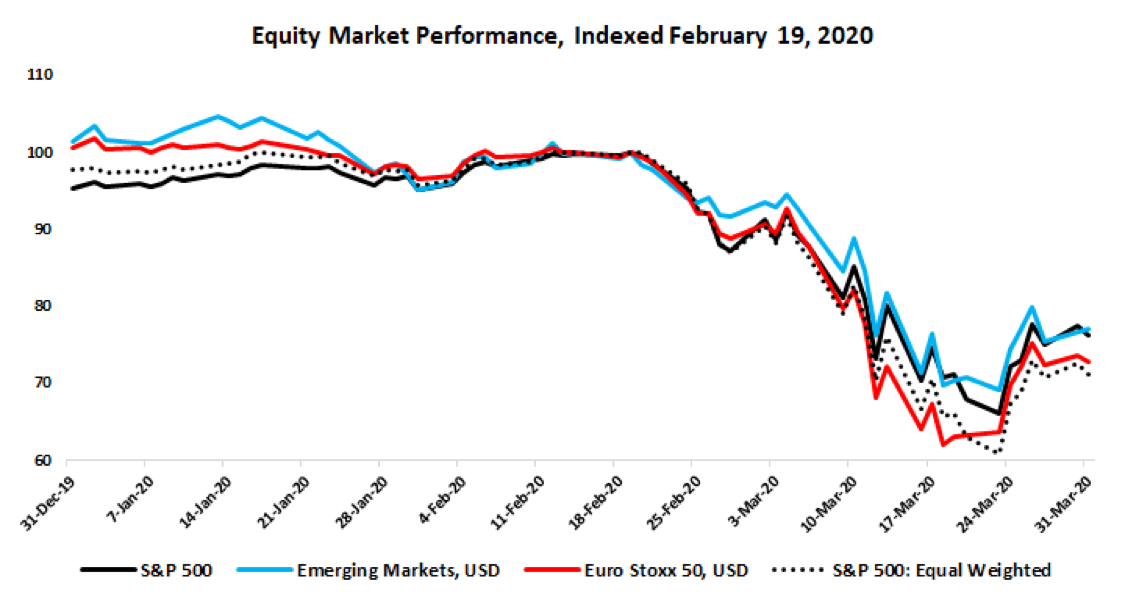
The average stock in the S&P 500 registered a significantly larger decline. In Figure 2, the solid black line shows the performance of the S&P 500 index, while the dotted black line shows the performance of its equal-weighted counterpart. As is seen, the equal-weighted index registered a larger decline, falling 40%. European and emerging markets, measured in dollars, registered large declines as well.
Figure 2: Equity Market Declines from February 19, 2020
Source: Data from investing.com
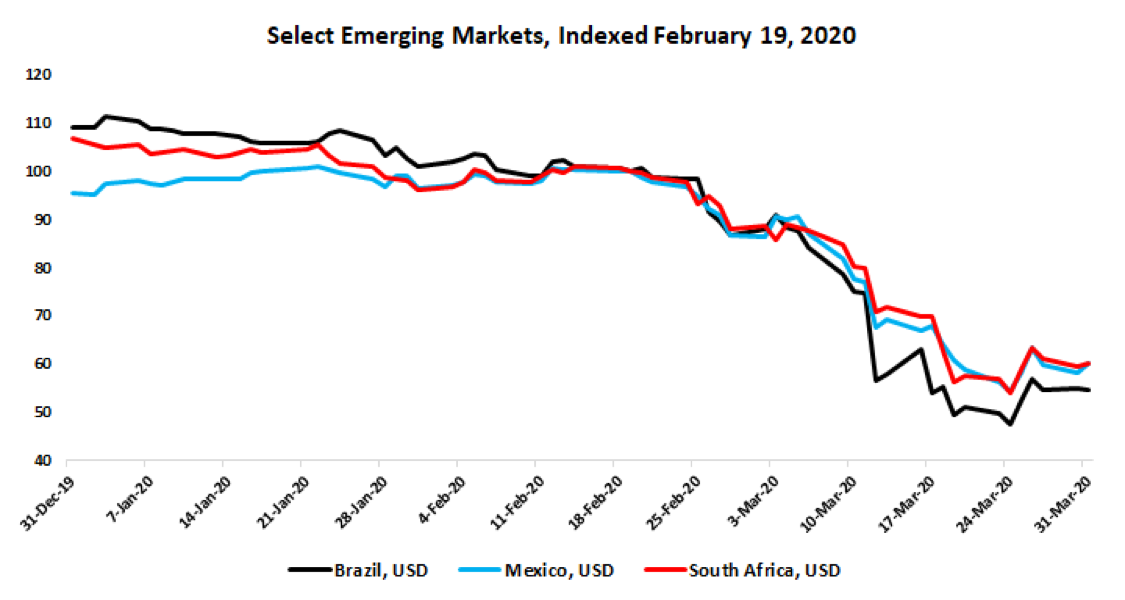
Figure 3 shows the performance of equity markets of Brazil, Mexico, and South Africa in U.S. dollars. As the currencies of each of these countries depreciated by 20% or more against the dollar, they registered a decline of nearly 50% on average in dollar terms.
Figure 3: Performance of Brazilian, Mexican, and South African Equity Markets in USD
Source: Data from investing.com
Liquidations and fear of missing out- (FOMO-) driven pricing
As the charts above show, equity prices across markets declined in unison. At times like these, the primary function of financial markets is to serve as a price discovery mechanism. This is a very important role that has a significant bearing on the economic structure as well as on the long-term health of the economy, as capital allocation decisions depend on this mechanism.
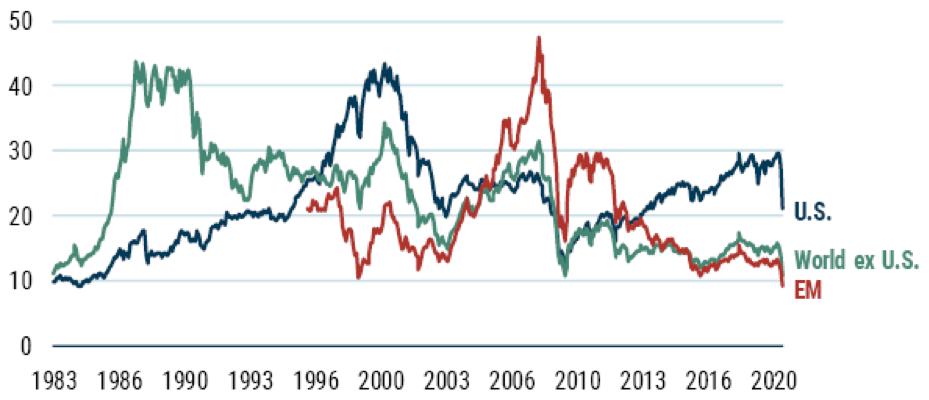
In general, financial markets perform this task reasonably well. However, there are times when investment prices are not driven by rational actions and are instead driven by greed or fear. As seen in Figure 4, emerging and non-U.S. equities were already trading near their lowest valuation multiples of the past 30-plus years. However, as shown in Figures 2 and 3, they fell in unison, with the U.S. markets and, in some cases, registered even larger declines. The undifferentiated price changes that we experienced in Q1 were largely liquidation-driven and valuation agnostic.
Figure 4: Shiller P/E Ratios as on March 19, 2020
Source: GMO
Global moats index: Valuations
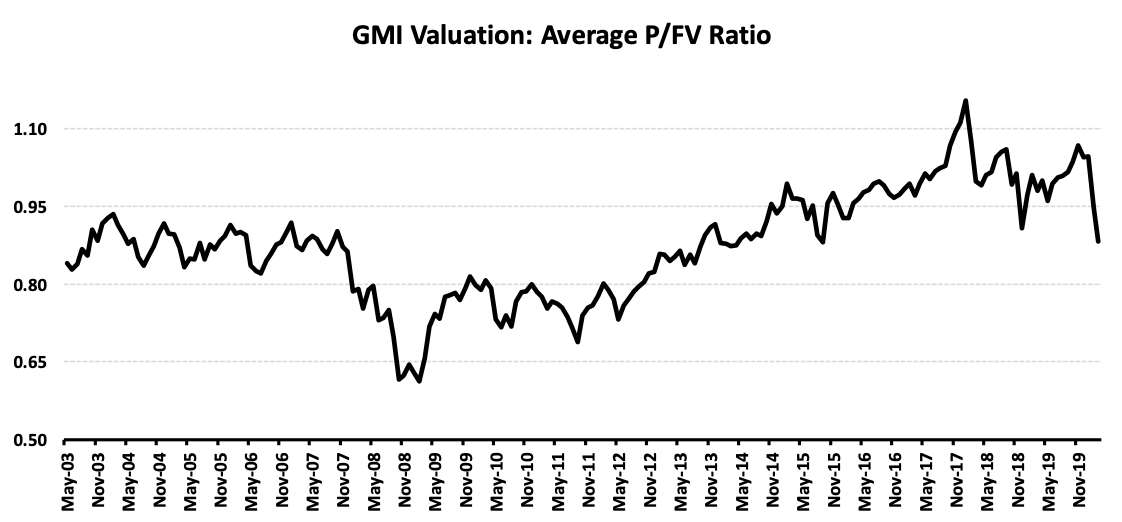
Figure 5 shows the average price-to-fair-value ratio for the global moats index (GMI)1. As against typical valuation shorthands like P/BV and P/E, which do not account for the expected business value growth and the duration and width of the competitive (dis)advantage of the business, if any, Figure 5 is based on duly assessed business valuations of each business in the index.
The correction in March 2020 brought the index’s valuations to a reasonable zone.
Figure 5: Global Moats Index (GMI) Average Price to Fair Value Ratio
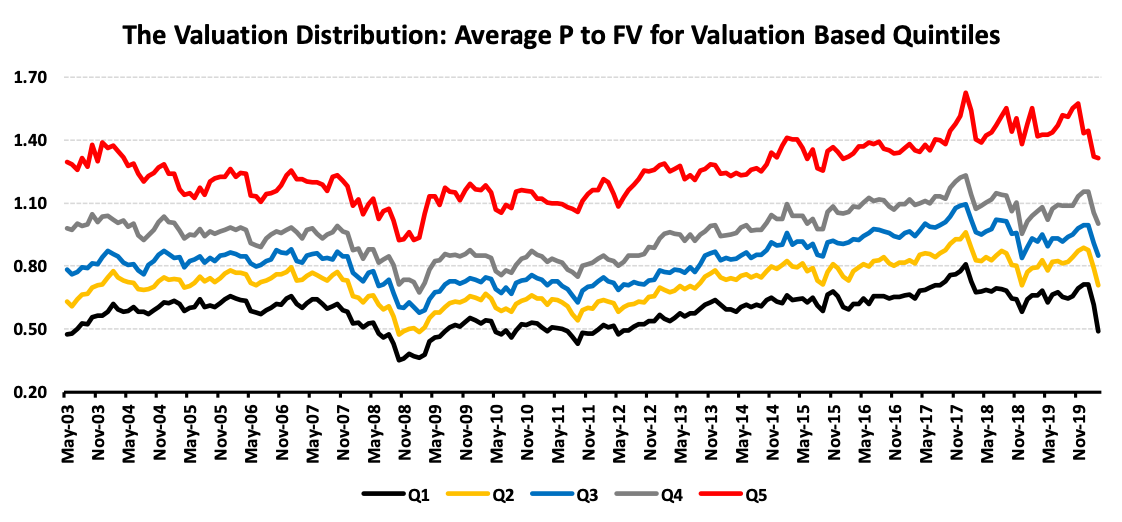
Figure 6 shows the valuation distribution2 for the GMI. This chart provides the clearest evidence of liquidation-driven price changes as opposed to business valuation-driven price changes. As is seen, the cheapest stocks (Q1) registered much larger price declines than the most expensive businesses in the index (Q5). Indeed, while the index itself is not close to its valuations in 2009, the cheapest set of our businesses are currently the cheapest outside of the Global Financial Crisis and its aftermath.
Figure 6: Global Moats Index’s (GMI) Valuation Distribution
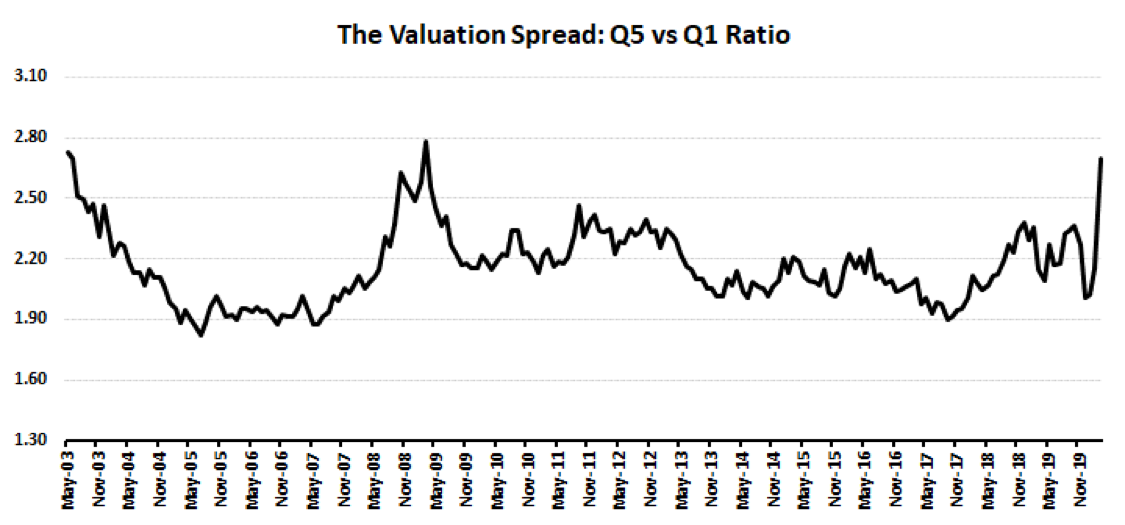
As a result, the valuation spread between Q5 and Q1 is nearing the extremes experienced in 2009 and 2003.
Figure 7: Global Moats Index’s (GMI) Valuation Spread Between Q5 and Q1
Expected returns: Where we are
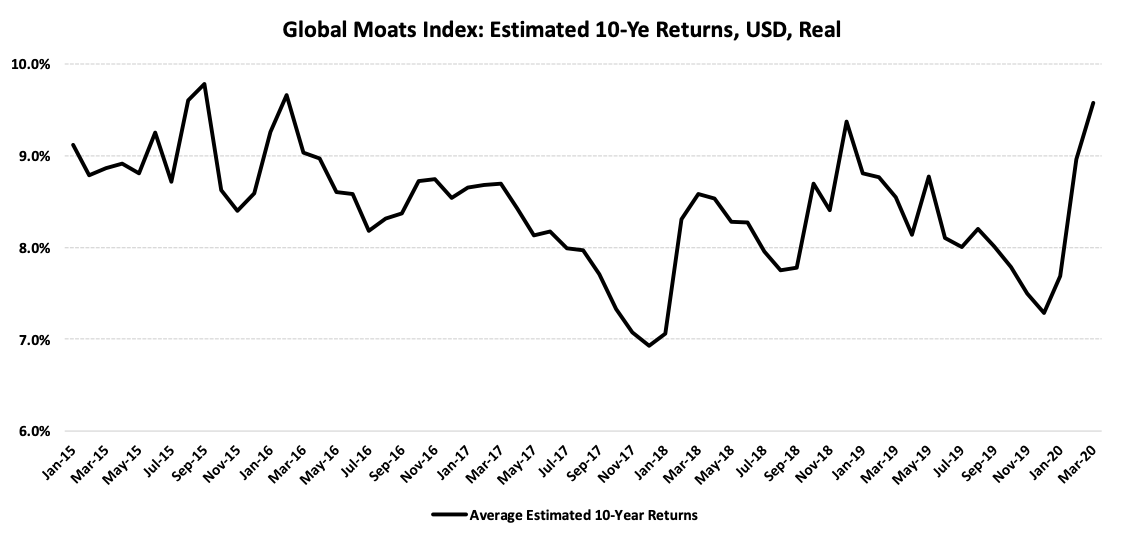
Figure 8 shows our estimate of the 10-year return for the GMI since 2015. As is seen, we currently estimate the 10-year return for the index to be in the same zone as in 2015 and somewhat higher than at the equity market lows achieved in November 2018.
Figure 8: Global Moats Index (GMI) – Estimated 10-Ye Returns, in USD, Real
COVID-19: Investment Implications
As stated previously, there is significant uncertainty surrounding the key variables of this pandemic. This is also seen in the expert predictions around its transmissibility as well as the number of deaths. The pandemic will have an impact on businesses and consequently investments. As with most things in life, the impacts will not be evenly spread across all businesses. The worst affected should have been the ones with the poorest business models and balance sheets that were not designed to handle the once-in-a-hundred-year flood.
However, we live in a world where policymakers have shown a nonexistent willingness to allow recessions and bankruptcies. Of the many policies currently being implemented, the Federal Reserve has decided to buy corporate bonds, in effect, bailing out managers who overextended their financial shenanigans and exposed their businesses to poor outcomes. It also hampers the primary function of financial markets, that of price discovery.
The unintended consequences of these actions are hard to fathom. When combined with the uncertainty associated with COVID-19, investors indeed face an uncertain investment environment. When faced with significant uncertainty, it pays to clean the house and ensure that the base is strengthened.
Global Moats Fund (GMF): Improving the quality quotient
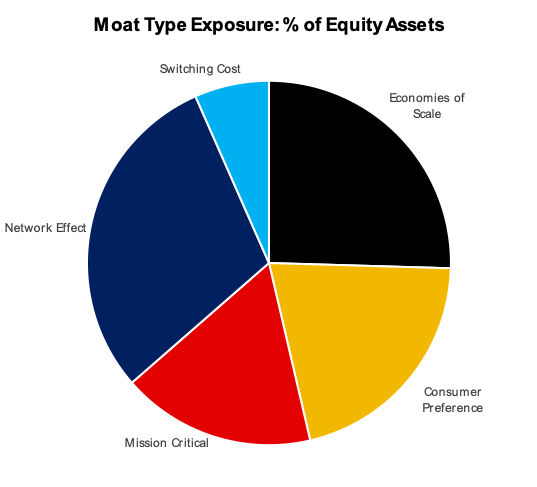
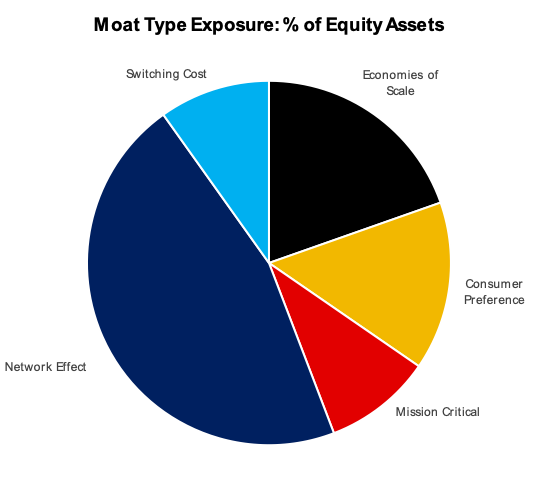
Keeping in line with the recommendation above, we used the opportunity afforded by the indifferent pricing actions to further improve the quality quotient of our portfolio. As shown in Figure 9, the fund experienced a significant increase in its allocation to network-effect businesses; the strongest source of competitive advantages within our framework. This shift came at the expense of some our economies of scale businesses in emerging markets. Importantly, we were able to achieve this rebalancing without a significant compromise on expected returns.
Figure 9: GMF Moat Type Mix – Improving the Quality Quotient
GMF: Moat type mix as of Dec 31, 2019
GMF: Moat type mix as of March 31, 2020
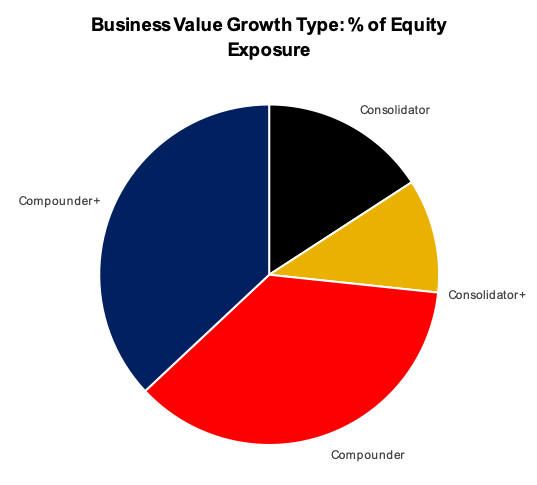
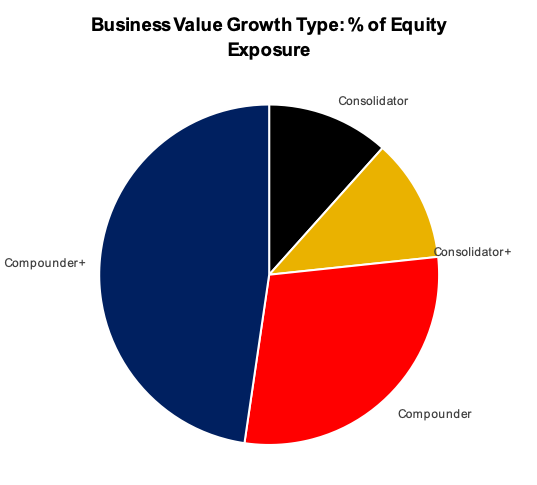
At the same time, we were also able to improve the business value growth potential of the portfolio as we increased our weightings in businesses that are likely to achieve the fastest business value growths. As seen in Figure 10, GMF saw a significant increase in its mix of Compounder pluses which now account for close to half of the portfolio.
As investors placed higher value on stability and dividends, they were willing to pay significantly higher prices for consolidators. The liquidation-driven price changes gave rise to an interesting valuation environment wherein some of our compounders and compounder pluses were priced for superior expected returns as compared to the lower growth businesses we exited.
Figure 10: Business Value Growth Type Mix
GMF: Growth type mix as of Dec 31, 2019
GMF: Growth type mix as of March 31, 2020
Summary
The Wuhan coronavirus adds significant uncertainty to potential investment outcomes, which is further compounded by possible unintended consequences of policymaker actions. However, the price declines experienced during the past month resulted in significantly improved investment return potentials. At the Global Moats Fund, we used this opportunity to improve all three pillars of our portfolio; the business quality, the business growth potential, and the expected returns.
Stay safe. We wish the best to your investing.
Baijnath Ramraika, CFA, is a cofounder and the CEO & CIO of Multi-Act Equiglobe (MAEG) Limited and is the Executive Director at Sapphire Capital. As a portfolio manager, he manages the Global Moats Fund and the India Moats Fund. Contact him at [email protected]. Baijnath’s thoughts and ideas can be read at his blog at www.symantaka.com
Prashant K. Trivedi, CFA, is a cofounder of MAEG and the founder and chairman of Multi-Act Trade and Investments Pvt. Ltd.
MAEG is an investment manager and manages the Global Moats Fund, an investment fund that invests in a global portfolio of high-quality businesses with sustainable competitive advantages. Sapphire manages the India Moats Fund, an investment fund that invests in a portfolio of high-quality Indian businesses with sustainable competitive advantages.
Multi-Act is a financial services provider operating an investment advisory business and an independent equity research services business based in Mumbai, India.
1 GMI is a proprietary index of MAEG representing a global set of high quality businesses that qualified through our moat assessment framework as having durable competitive advantages.
2 To construct the chart, we calculated the price to fair value of each company in the Global Moats Index on a monthly basis. The index was then segmented in quintiles based on the price to fair value ratio. The chart plots the average of price to fair value ratios so calculated for each one of the quintiles.
More Alternative Investments Topics >