Investing in a COVID-19 MMT Era
Membership required
Membership is now required to use this feature. To learn more:
View Membership BenefitsAdvisor Perspectives welcomes guest contributions. The views presented here do not necessarily represent those of Advisor Perspectives.
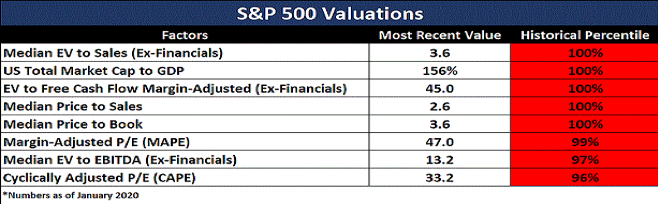
The U.S. stock market was overvalued and positioned to fall before the coronavirus arrived. By the end of 2019, a combination of Federal Reserve policies, stock buybacks and government deficits had elevated stock prices according to virtually all metrics (see chart below).
So how did we get here and where are we going?
In terms of how we got here, the origins of this secular debt cycle originated with the largely ideological decision to deregulate financial markets during the 1980s and 1990s. The two segments of the postwar period provide quite a contrast. During the early postwar period from 1945 until the mid-1970s, credit growth tracked closely with real economic growth, given that most credit was used to support either consumption or the production of goods and services (see chart below).
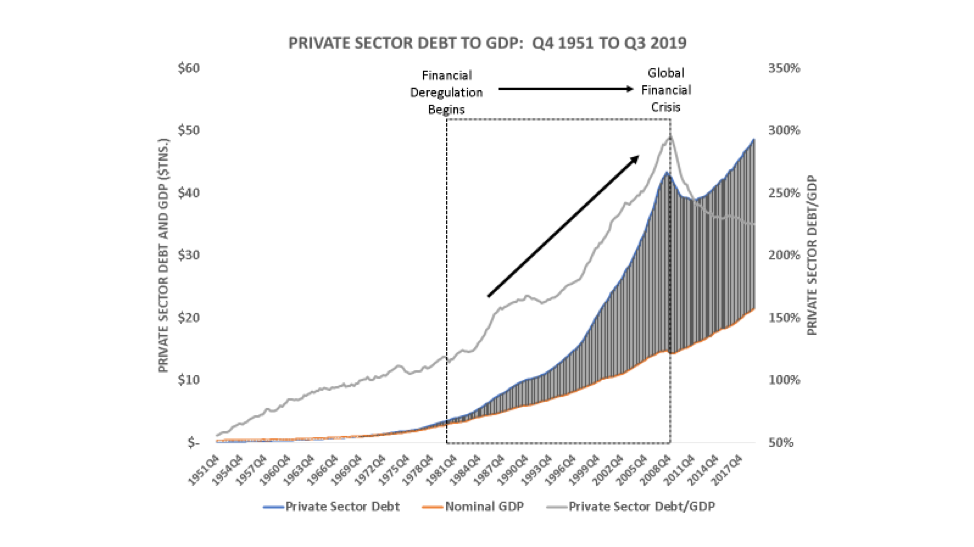
Source: Flow of Funds, Author calculations
That dynamic changed from the 1980s until 2007, as financial markets were deregulated and shareholder value (and corporate stock buybacks, permitted under SEC Rule 10b-18) gradually took hold. Wage suppression throughout this time period resulted in middle- and lower-income households borrowing to support consumption, which caused debt levels to begin to rise. How did those households service their debt? It was underwritten by rising house prices and more borrowing. Ultimately, this became a Ponzi scheme that unwound during the global financial crisis (GFC), as real estate values plummeted, as did the net worth of the bottom 90%. As of 2016, the net worth of those households was still more than 30% below 2007 levels.
This set the stage for a very weak recovery, in which annual growth in the real economy has averaged only 2%. And this slow pace of growth was driven in large measure by the sizable debt burden being carried by the bottom 90%. Despite the fact that the Bernanke-led Federal Reserve and the Geithner-U.S. Treasury treated the financial system with kid gloves, handing it a rather nice bailout with few constraints, nothing was done to address the debt levels of many households in the bottom 90%. In other words, these households were largely incapacitated in terms of serving in their historic role as engines for growth in aggregate demand and GDP. (In general, these households have had very high marginal propensities to consume, though not this time).
The Fed stepped into reduce short-term interest rates and also conducted quantitative easing (QE 1-3), but those activities merely fueled the liquidity-driven bubble in asset prices, exacerbating already evident income and wealth inequality. The fact that the top 10% of US households now own 90% of all equities and about 70% of all net wealth (with higher concentrations in the top 1%) strongly suggests that they were the primary beneficiaries of Fed policies. The polarization of wealth and income since the GFC undoubtedly contributed to the emergence of populism, xenophobia, the opioid crisis and the erosion of democratic institutions.
Fast forwarding to 2019, the 30% increase in the S&P 500 was quite unexpected and more than anything else, resulted from the Fed returning to its playbook of cutting short-term interest rates and resuming QE. In late-2018, the Fed anticipated that it would continue to tighten monetary policy in 2019, while unwinding QE (via quantitative tightening or QT). However, those plans fell apart, as stock prices fell sharply in December 2018. And so, the Fed reversed its forward guidance and began cutting short-term rates in the second half of 2019. Then, in response to the spike in repo rates in September, the Fed once again increased its balance sheet, adding between $400 and $500 billion by year-end.
What is quite clear from 2019 was how closely market returns were linked to the actions of the Federal Reserve. In 2019, virtually every asset class generated positive returns, which is hardly the norm. That performance is a clear sign that what drove markets in 2019 was not at all related to fundamentals, but rather liquidity conditions. The Fed delivered!
In fact, the Fed has been delivering for more than a decade (given its asymmetric policy also known as the “Fed put”). From 2009 to 2020, the S&P 500 rose by more than 500%. And yet, annual GDP growth throughout that 11-year period was a rather meek 2%. And adding even more to the notion that it was not the fundamentals that drove stock prices, corporate profits have been flat for the past five-plus years.
Stock market performance over the past decade has been extraordinary, yet it had little to do with the underlying fundamentals.
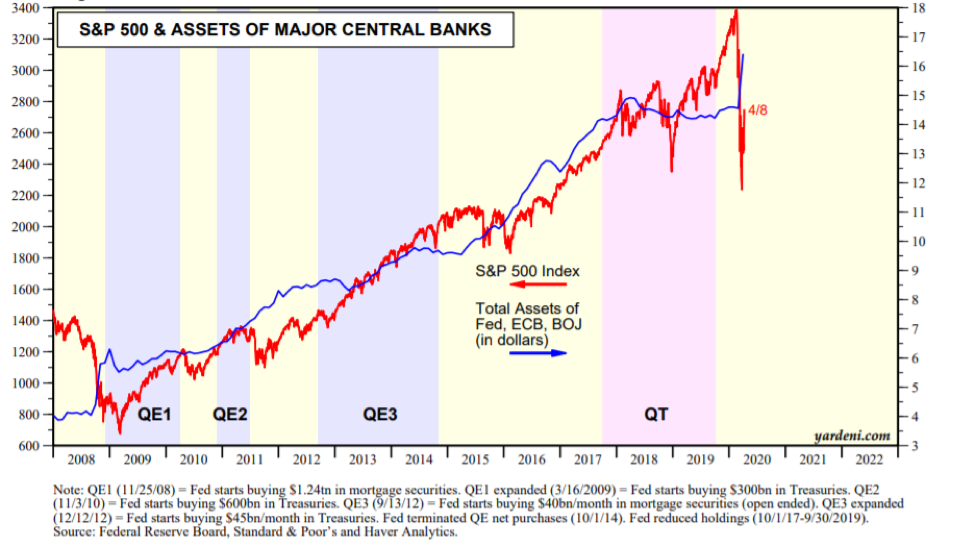
Interest rates have been around zero (real rates have been negative) throughout much of the past decade and QE policies have also boosted stock prices. The correlation between U.S. stock prices and the Fed’s balance sheet is illustrated in the chart below. And when the Fed was not conducting QE operations (from 2014 to 2019), other central banks, namely the European Central Bank, the Bank of Japan and the Bank of China were. These actions boosted the value of stocks (red line), as the chart below illustrates.
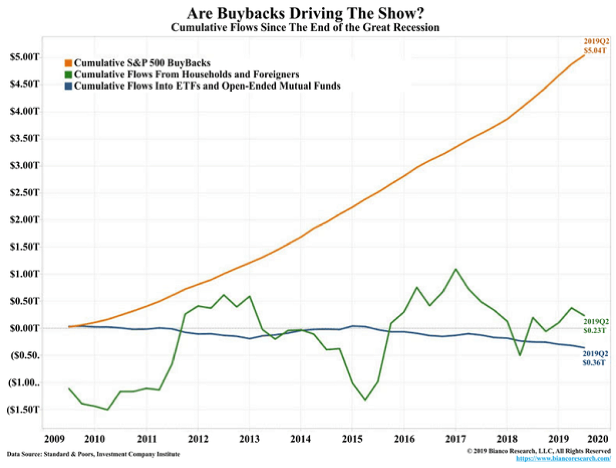
The other key factor was the role of stock buybacks. Up until 1982, stock buybacks were prohibited, given that they were viewed as stock price manipulation. Then, during the Reagan administration, the SEC implemented Rule 10b-18, which permitted corporations to buy back their own stocks. When a corporation purchases its own stock, the number of shares is reduced, raising the earnings-per-share or EPS). The shift toward buybacks was engineered in response to the emergence of shareholder value maximization and the need for CEOs to “meet their numbers.” In time, this pressure was directly linked to compensation for CEOs and other senior executives (e.g., stock options). Given this incentive structure, buybacks became a key arrow in the financial engineering quiver. Incredibly, from 2010-2019, more than $5 trillion in buybacks were engineered. And as the chart below illustrates, corporations have basically been the only sector buying stocks. Even pension funds have been net sellers of stock.
The combination of Fed largesse and stock buybacks elevated stock prices throughout the 11-year recovery, despite weak growth, stagnant wages and five years of flat corporate profits. This had very little to do with the underlying fundamentals of companies. It was driven by financialization with the support of the Federal Reserve. Additionally, corporations issuing debt at very low interest rates financed most of these buybacks. More than half of all corporate debt at the end of 2019 was rated BBB, which is the lowest investment-grade rating.
At the end of 2019, the stage was set.
The liquidity-driven bubble was inflating, and market participants were mesmerized by the Fed’s actions. All that was needed was a pin. Unfortunately, what then arrived was an unprecedented event, namely the arrival of the coronavirus. The S&P 500 continued to rise throughout January and into February, as politicians chose to ignore the COVID-19 pandemic. However, on February 19, 2020, the news began to seriously impact the U.S. economy, first in Washington State, then New York, New Orleans and elsewhere. From February 19 to March 23, the S&P 500 fell by 34%. The U.S. government and Federal Reserve stepped in and the S&P rallied from March 23 to March 26 by about 18%. As of April 6, the S&P was down 24% on the year; and other stock markets, including those in Europe, Japan and emerging markets are down by roughly similar amounts.
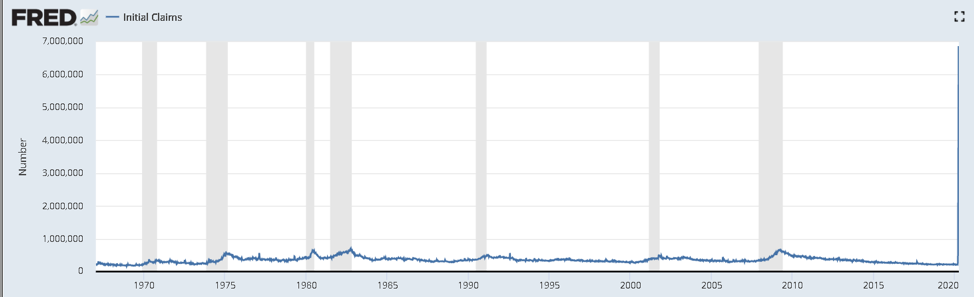
This is the first time that the world has experienced a pandemic in a fully financialized economic system. The pandemic is itself a health-related crisis that has impacted financial market valuations, especially given the quarantines and lockdowns that either have been or will be imposed by various countries. This is completely uncharted territory; scenario analysis can be utilized, but this situation cannot be quantitatively modeled. We do not know how long COVID-19 pandemic will persist nor how the world will evolve as it fades. What we do know is that the data over the past four weeks has been astounding. The initial unemployment claims have jumped more than 30-fold from 211,000 on March 7 to 6.648,000 on March 28 and then 6,606,000 on April 9.
In response, the government and the Federal Reserve have responded that they are prepared to do “whatever is necessary.” Congress approved the Coronavirus, Aid, Relief and Economic Security (CARES) approved during the GFC) for a series of programs that include stimulus checks for households, extended unemployment insurance, lending to distressed businesses, forgivable loans to small businesses, funding for state and local government, etc.
This act is designed only to stabilize, not stimulate the economy. More will be forthcoming. The Federal Reserve has already added more than $1.5 trillion in assets to its balance sheet and either has or is prepared to create seven facilities to purchase a potentially infinite amount of additional debt. It also announced last week that it was establishing a Main Street Loan Facility to support loans to small business. The Fed’s balance sheet, which currently stands at $5.575 trillion, will cross the $10 trillion mark within the next 12 months, if not less.
There have been a number of bumps in the road as the CARES Act has unfolded, given the unprecedented magnitude of the expenditures and lapses in communications (e.g., between the Treasury and the Small Business Administration). It seems likely, if the slowdown in the U.S. economy persists and the lending component of the CARES Act (which requires coordination between the Treasury and the ill-equipped Small Business Administration framework) fails to stabilize employment, that the Fed (working with the IRS) will simply provide the bank accounts of each employee with, say, 80% of the employee’s salary, (perhaps with the amount capped at the median salary) in order to stave off a depression. Given the nature of how money actually operates, this is possible (and I will discuss it in a subsequent article). Eventually, the COVID-19 pandemic will peak and then fade, though precisely when is far from clear.
Transition to modern monetary theory?
Modern monetary theory (MMT) has been much discussed. The CARES Act and the Main Street program by the Federal Reserve speak to the Fed taking steps it had previously refused to take in 2010 when Bernanke was chair. He refused to consider lending to non-financial institutions or to homeowners with underwater exposure to real estate, despite Section 13(3) authority, which clearly would have permitted him to do so. The Fed remains resistant to extending credit to households, though it has stepped up to provide support to non-financial businesses.
Up until this year, the Fed had focused on assisting banks and the financial sector, including the nightmarish decision by FRBNY President Tim Geithner to provide $85 billion to AIG to fund at full value its CDS exposures with Goldman Sachs, JP Morgan Chase, et al. In any case, within the past several weeks, The Fed has taken an important step in collaborating with the Treasury to support the funding of small business. This is an initial step toward MMT, where the Fed and Treasury collaborate in developing solutions, much as was done during World War II. Alternatively, perhaps the government will move toward creating a version of the Reconstruction Finance Corporation (RFC) that utilizes the government’s balance sheet to finance jobs programs, infrastructure improvements, green energy, et al., much as was wisely done during the Great Depression.
The coronavirus alone did not cause this crisis. The global economic system has become increasingly vulnerable with the financialized accumulation of enormous amounts of debt over the past four decades. Total debt outstanding is $253 trillion or 323% of global GDP. We did not get here overnight, and it will take time to work through these challenges. In time, policymakers may find they have little option but to apply constraints (as was done during the Great Depression) to financial institutions and to provide significant debt relief (e.g., return to the future with another Brady debt program that was utilized successfully during the 1990s for various Latin American countries), within the U.S. and more broadly across the globe.
The Fed recently has purchased increasing amounts of Treasury debt. The Treasury pays interest to the Fed on this debt that is then returned by the Fed to the Treasury as part of the Fed’s annual surplus. Thus, there is no net cost to debt issued by the Treasury that is held by the Fed. And eventually, the Fed and Treasury may agree to eliminate the principle payment on this debt. The transition away from the financialized economic system toward an MMT framework is inevitable, now that the precedent was set (e.g., AIG, et al). And given the enormity of the COVID-19 challenge, there may be no alternative.
Investment implications
Investing is subject to enormous uncertainty. There is no recent precedent to guide investment decisions. It is difficult to forecast the path that the economic and financial system will take. It could either be deflationary or inflationary. Compelling arguments can be marshaled for either direction. Long-duration U.S. Treasury bonds tend to do well in a deflationary environment (though there may well be a limit as to how negative yields will go), while TIPS and hard assets tend to do well in an environment of rising inflation. Given the shift toward MMT, and the need for those funds, unlike QE, to make it into the pockets of the bottom 90% (either via an infrastructure program or directly), higher inflation will come further out in time, since it will reduce the real value of the debt.
Finally, some seem to think we are back in a bull market, which is wishful thinking. There is no precedent for where we are, though the Great Depression and the GFC come the closest. Interestingly, in 2008, the S&P 500 lost 40% in value, yet it experienced at least three periods during which it rose more than 10%. Similarly, during the Great Depression, the S&P 500 lost more than 80%, and yet it too increased five times by a similar amount. Head-fakes are common in these times for investors, and we are often lured into rising markets just before they fall sharply, a thought worth keeping in mind, especially given the inherent bullishness of the mainstream media. However, remaining on hold and waiting to see where life takes us over the next two to three months (or perhaps longer) is prudent. Patience will prove to be a virtue in these highly uncertain times.
John Balder is working on a book titled: Beyond the Free Market Myth: Restoring Shared Prosperity. He spent more than twenty-five years as a global strategist building innovative investment strategies at firms that included GMO and SSgA. Prior to that he worked with the U.S. Treasury and the Federal Reserve Bank of New York having begun his career with the House Committee on Banking, Finance and Urban Affairs in Washington D.C. He currently works part-time as a global strategist with Wellesley Investment Partners. These views are strictly his own and do not represent any organization with which he has been or is affiliated.
Membership required
Membership is now required to use this feature. To learn more:
View Membership BenefitsSponsored Content
Upcoming Virtual Events View All


