Advisor Perspectives welcomes guest contributions. The views presented here do not necessarily represent those of Advisor Perspectives.
The methodology behind the “golden-cross trigger” is perceived by many as a reliable guide to equity investment. But it is not that good – since 1990, there were many periods when it would have been better to ignore the signals from this trigger.
One can do much better with a simple improvement to that trigger by including signals from a recession indicator, such as the Conference Board Leading Economic Index (CB-LEI). This reduces the number of trades and produces higher returns.

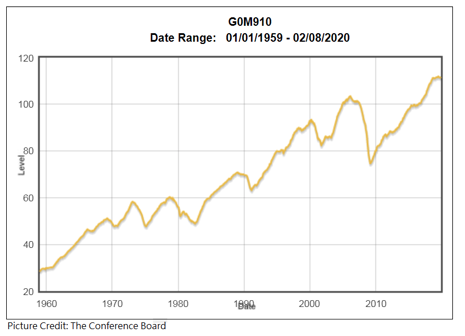
In this analysis, I used the six-month smoothed compound annualized growth rate of CB-LEI as a recession indicator. The CB-LEI is not a secret dataset to which only I have access, but it does cost $250 to purchase the index. The formula to calculate this growth rate is given in Appendix 2 of my 2012 article, Evaluating Popular Recession Indicators.
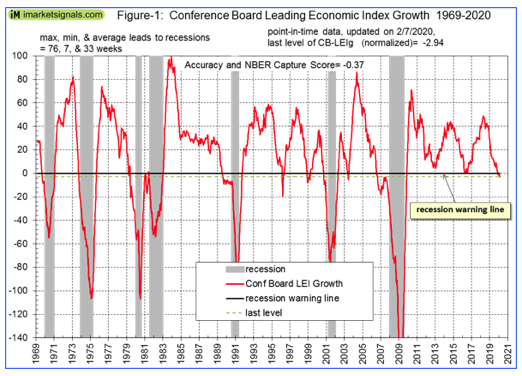
The normalized growth rate of this index from 1969 to 2020 is shown in Figure 1 and is warning of an oncoming recession.
But do not panic.
This indicator has had three false-positive signals, so, in accordance with the strategy described below, we have to wait for a death-cross signal from the S&P 500 to exit stock market investments. The next update of CB-LEI is scheduled for February 20, 2020.
Basics for the MAC-REC system
I simulated a hypothetical stock fund SPY* based on the performance of the S&P 500 with dividends reinvested by splicing the data from the SPDR S&P 500 ETF (SPY) from 1993 to 2017, the Vanguard 500 Index Fund (VFINX) from 1980 to 1993, and before that from 1965 to 1980 daily data of the S&P 500 with dividends taken from the Shiller CAPE data.
I also simulated a hypothetical money market fund SHV* with the federal funds rate from 1965 to 2007 and thereafter spliced the iShares Short Treasury Bond ETF (SHV) to it.
I used daily data from January 4, 1965 to January 31, 2020. Investment results are with dividends reinvested. Moving averages were calculated with trading days, not calendar days.
The basic golden-cross trigger occurs when the 50-day, short-term average (SMA50) of a stock or index moves above its 200-day, long-term average (SMA200) (and vice versa for a death-cross), which produced 58 trading signals since 1966. I modified this by including the signals from a recession indicator to get the ”MAC-REC trading system,” which produced only 14 trading signals over this period, one near the beginning and end of the seven recessions as shown in figure 2. (In the system’s name, “MAC” is short for moving average crossover, and “REC” stands for recession.)
The investment strategy
The MAC-REC trading system has a buy and a sell signal triggering shifts from investment in the markets to the safer, money-market-fund-like reserve.
Buy signal for stocks:
- A buy signal occurs when SMA50 of the S&P 500 index moves above its SMA200.
Sell signal for stocks:
- A sell signal occurs when SMA50 of the S&P 500 index moves below its SMA200, but only if the recession indicator signals recession at the same time.
This strategy ensures that signals can occur only near recessions; all other moving average crossover signals are eliminated, as well as false positive signals from the recession indicator, unless confirmed by a death-cross.
Results shown are for the investment going into an S&P 500 index fund when a buy signal occurs, and when a sell signal arises the funds are moved from the S&P 500 index fund to a money market fund. (Higher returns could have been had by switching to a 10-year Treasury bond fund instead of a money market fund.)
Results from the MAC-REC system
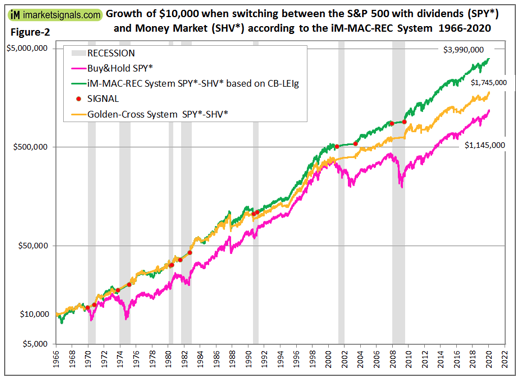
The backtest shows that an asset allocation strategy based on the MAC-REC trading system would have provided good results; on average, a 130% higher return than the basic golden-cross trigger would have offered from 1966 to 2020. Historical investment results from this system would have been, on average, 3.5-times higher (and obviously less risky) than a buy-and-hold (B&H) investment in an S&P 500 index fund with dividends.
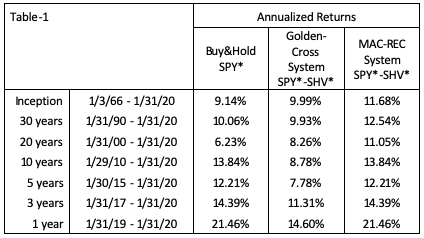
Performance from 1966 to 2020 (SPY*-SHV*)
In table 1 and figure 2, the performance for the switching strategy SPY* - SHV* according to the MAC-REC system and the golden-cross system can be compared with SPY* buy-and-hold. It is evident that a switching strategy from equity to fixed income according to the MAC-REC system provided the highest returns over longer periods, and matched returns of the stock market over shorter periods.
Also the performance of the system confirms that it is advantageous to be out of equities during recessions.
Conclusion
The MAC-REC system’s strategy is simple: equity and fixed income investments target the periods between and during recessions, respectively.
This technical timing model is simple and rule-based. One only has to follow signals from a reasonable recession indicator and from the S&P 500 golden/death-cross trigger to protect investments.
Georg Vrba is a professional engineer who has been a consulting engineer for many years. In his opinion, mathematical models provide better guidance to market direction than financial "experts." He has developed financial models for the stock market, the bond market, yield curve, gold, silver and recession prediction, which are updated weekly or monthly at http://imarketsignals.com/. Georg can be reached at [email protected].
Read more articles by Georg Vrba