Advisor Perspectives welcomes guest contributions. The views presented here do not necessarily represent those of Advisor Perspectives
Much has been written on measuring equity market valuations – but precious little on developing effective strategies to capitalize on the imbalances.
Measuring valuation
“Overvalued” and “undervalued” are two of the most frequently used words in the investment industry. Turn to any business channel and chances are you will hear talk about an undervalued stock or an overvalued market, or vice versa.
In addition to stock markets, participants in commodities, real estate, and bond markets are all focused on determining valuation levels. The popularity stems from the understanding that an undervalued market implies a higher likelihood of positive future returns.
Price to earnings ratio (P/E)
If you are considering purchasing stock and, therefore, becoming part business owner, the cost of company earnings is a key piece of information to evaluate. P/E ratio is one way to determine whether you are paying a fair price for current earnings. A straightforward calculation, the P/E ratio is the stock price divided by trailing 12-month earnings. P/E is the most frequently referenced financial ratio when determining stock market valuation. The calculation for earnings can vary, however, by using forward earnings, operating earnings or reported earnings – all are used in the ratio denominator. (The P/E ratios referenced in this article are based on as-reported earnings).
Individual stock P/E ratios can vary widely by industry and expected earnings growth. This article will focus on P/E ratios for the S&P 500 index.
Figure 1 shows the historical P/E ratio of the S&P 500 based on trailing 12-month earnings over the last 50 years. ¹ In general, the P/E ratio peaks along with market highs. However, the absolute P/E levels vary greatly from the S&P 500 index peak-to-peak and trough-to-trough. Historical P/Es alone are not useful in creating successful buy/sell signals.
Figure 1
Figure 1: Created by author. S&P 500® Earnings Data Source; 2020 S&P Dow Jones Indices LLC. S&P 500® Historical Data. (^GSPC) (2019). Yahoo!Finance.
Higher P/E ratios over the last 25 years
In Figure 1 we can see that the average P/E ratio during the past 50 years was 19.8. However, the average P/E for the first 25 years was only 15.1; since 1994, average P/Es have increased to 20.4. P/E ratios have been considerably higher in the last two decades versus preceding decades, which raises the question: What is different about the most recent 25 years?
One thing noticeably different between the 25-year period ending 1994 versus the 25-year period ending 2019 were rates of inflation. On average, inflation (CPI) was much higher through 1994 at 6% versus only 2% in the most recent 25-year period.
Inflation Impacts Equity Valuation
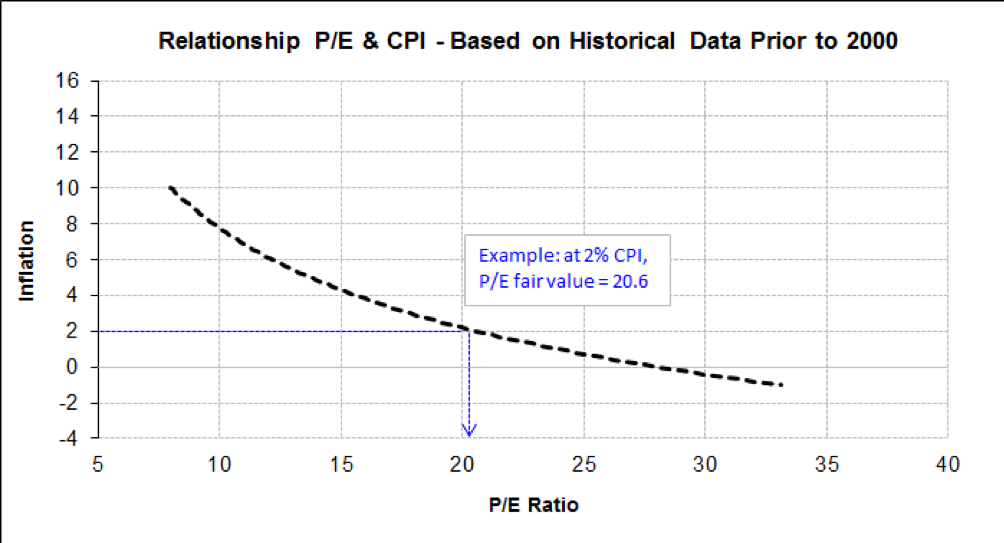
About 25 years ago, I came across a graphic that offered evidence of a close relationship between inflation (CPI) and P/E. The graphic consisted of a scatter plot with S&P 500 P/Es on the horizontal (X) axis and CPI on the vertical (Y) axis. Between the data points was a line of best fit revealing that equity markets will support significantly lower P/Es at higher CPI rates.
In Figure 2, the position and shape of the line is based on data points from the original graphic. Each position on this line represents a fair value P/E level at a given inflation rate. Going forward “CPI P/E” will be used to identify the P/E ratio associated with the corresponding CPI rate² (see example in Figure 2).
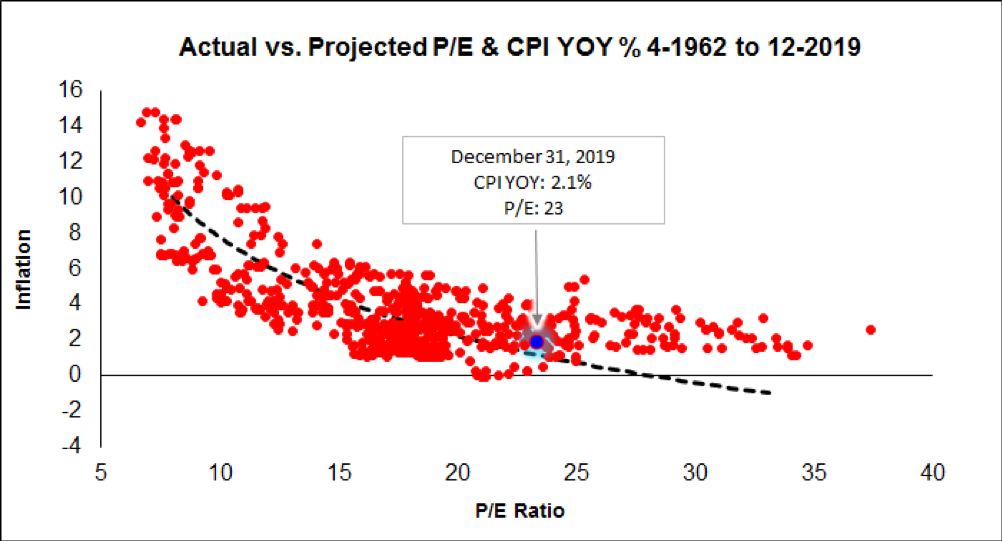
The actual scatter plot data points in relation to the original line are shown in Figure 3. The relationship between inflation and valuation was consistent with both in-sample and out of sample data. It appears that a fair market P/E valuation (CPI P/E) can be accurately estimated using 1-year CPI growth rates.
Figure 2
Figure 2: Created by author. Based on hypothetical values.
Figure 3
Figure 3: Created by author. U.S. Bureau of Labor Statistics. Release: CPI for All Urban Consumers (CPI-U), 12-month% change. S&P 500® Earnings Data Source; 2020 S&P Dow Jones Indices LLC. S&P 500® Historical Data. (^GSPC) (2019). Yahoo!Finance.
Allocation timing model using CPI P/E to P/E Ratio
It’s easy to proclaim that equity markets are “overvalued,” but more challenging to develop a successful strategy based on index valuation.
The CPI P/E ratio is calculated by dividing CPI P/E by P/E, generally a number above one is undervalued and below one is overvalued.
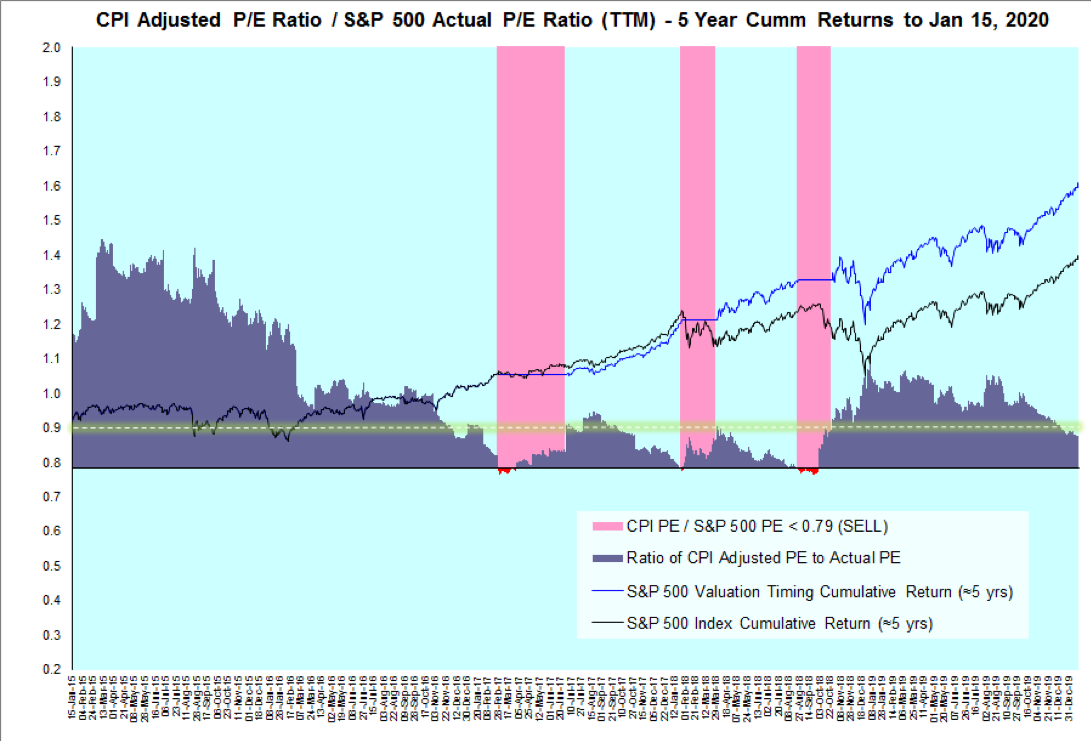
Figure 4 shows the last five years of values based on the ratio of CPI P/E to P/E. The areas in pink are periods when the CPI P/E ratio fell below 0.79, triggering a sell signal. The yellow line (0.9) indicates the index price is within the acceptable P/E range and is the level where the sell signal ends.
When the P/E adjusted for inflation divided by P/E is lower than 0.79 this is roughly equivalent to the index priced 20% above fair value. In other words, assuming earnings and CPI remain constant, the S&P 500 index would need a bear market equivalent selloff (-20%) to reach fair value. While equity markets sometimes continue to advance despite high valuations, equity positions are increasingly at risk as the valuation gap increases.
The role valuation played in the crash of 1987
There is a general perception that the crash of October in 1987 (Black Monday) was primarily due to the unintended consequences of program trading. While program trading undoubtedly played a role, there were other significant market risks in mid-late 1987. Among them: rapidly rising inflation, rising commodity prices and a treacherous spike in interest rates. In 1987 the equity markets were at great risk for a sell-off regardless of other aggravating circumstances.
For starters, these were some of the conditions at the end of September in 1987: ³
- CRB Spot Raw Industrials Index 6-month increase: +18.7%
- 30 Year Treasury yields 6-month increase: +25%
- A big rise in inflation (CPI) from January to September from1.1% to 4.3%
At the start of 1987 the S&P 500 P/E ratio was only 17, well below the CPI adjusted fair value P/E of 23. By August 1987 the S&P 500 P/E ratio had reached 23, slightly higher than historical averages. However, when the S&P 500 P/E was compared against its inflation adjusted target P/E, the price level had skyrocketed 30% above value. Using CPI P/E as a yardstick, mid-late 1987 was one on the most overvalued periods in S&P 500 history.
Figure 4
Figure 4: Created by Author. U.S. Bureau of Labor Statistics. Release: CPI for All Urban Consumers (CPI-U), 12-month% change. S&P 500® Earnings Data Source; 2020 S&P Dow Jones Indices LLC. S&P 500® Historical Data. (^GSPC) (2019). Yahoo!Finance.
Earnings momentum
The CPI P/E ratio fair value is a moving target because, along with index price volatility, changes in earnings growth and CPI rates are in constant rate of flux.
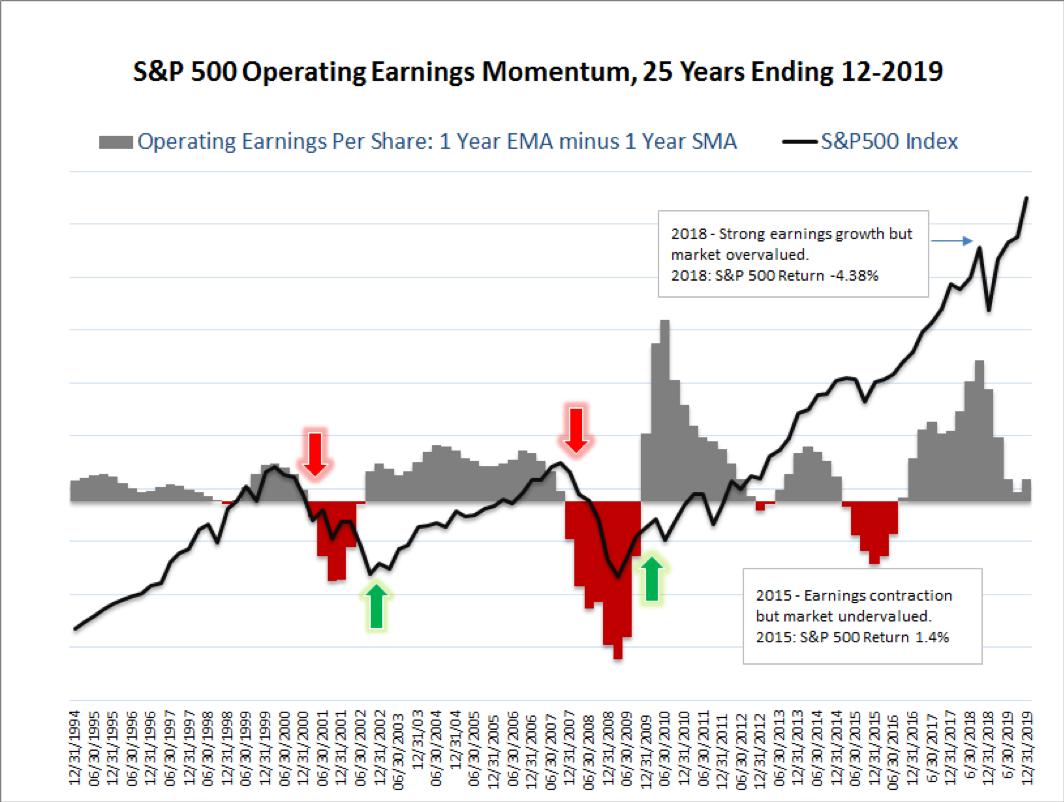
Figure 5 highlights quarterly changes in earnings growth by comparing the one-year exponential moving average of S&P 500 earnings with the simple one-year moving average.
The combination of an earnings decline and high valuation are significant factors that tend to precede market downturns, as shown in 2000 and 2008.
Since the recession of 2008, the impact of earnings growth and contraction on market prices can be shown in two examples in Figure 5:
- 2015: One-year earnings were contracting during most of 2015 – however the S&P 500 index managed to rise slightly. The CPI P/E ratio did not exceed the threshold required to trigger a signal.
- 2018: The most recent periods of significantly overvalued markets (valuation gap -20%). Even though the S&P 500 index fell sharply, equity prices quickly rebounded as earnings growth remained strong. Interestingly, the S&P 500 price index fell -20% intraday from Sep 21, 2018 to Dec 26, 2018 (technically a bear market).
Figure 5
Figures 5: Created by author. Based on quarterly data. S&P 500® Earnings Data Source; 2020 S&P Dow Jones Indices LLC. S&P 500® Historical Data. (^GSPC) (2019). Yahoo!Finance.
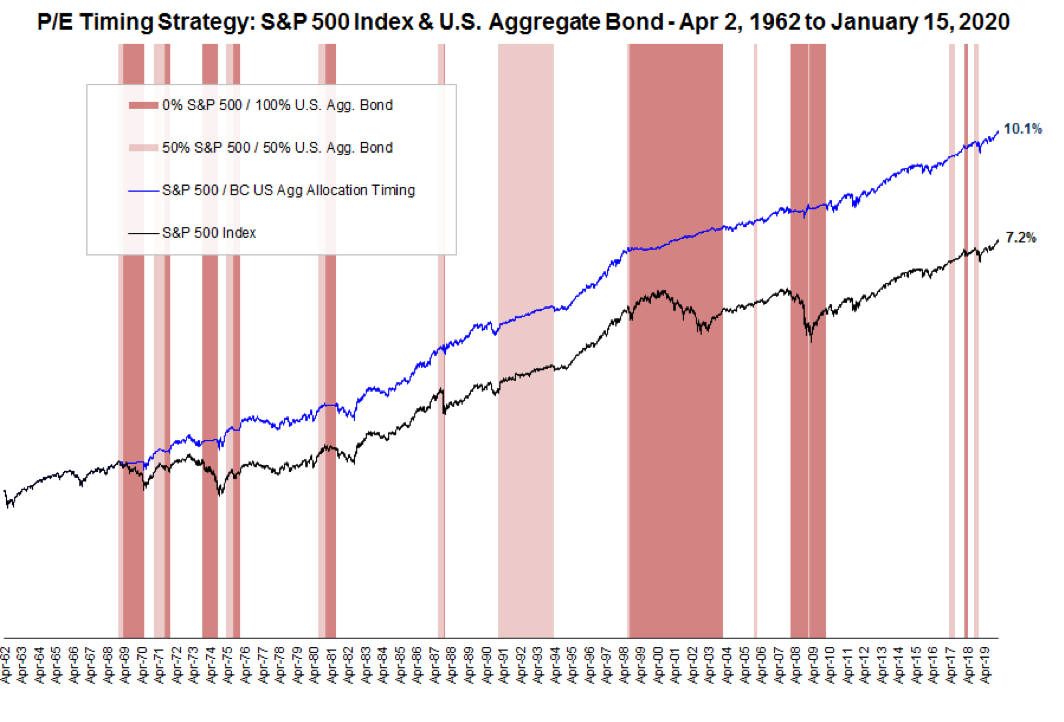
Allocation timing model using CPI P/E ratio⁴
As shown in Figure 6 and mentioned previously, the CPI P/E ratio is calculated by dividing the inflation adjusted value P/E by P/E (TTM) of the S&P 500 index. CPI P/E ratio readings below 1.0 signifying an overvalued market and below 0.8 at increased risk of a correction or bear market.
Allocation strategy rules used in Figure 6:
-
If: CPI P/E ratio is at or above 0.79, then: 100% of assets will be invested in the S&P 500 ETF (Ticker: SPY).
-
If: CPI P/E ratio falls to 0.78 or lower, then: 50% of assets will be invested in the S&P 500 and 50% of assets invested in BC US Agg Bond ETF (Ticker: AGG) until the CPI P/E ratio rises above 0.90 at which time 100% of assets will be invested in the S&P 500 ETF (SPY).
-
If: S&P 500 index falls 9% or more from its most recent peak while CPI P/E ratio is 0.78 or lower, then: 100% of assets will be invested in BC US Agg Bond ETF (Ticker: AGG) until the CPI P/E ratio rises above 0.90 at which time 100% of assets will be invested in the S&P 500 ETF (SPY).
When market valuations become stretched, there are three paths that will restore fair value. One is for the index price to fall, for earnings to grow or for CPI to fall.
High equity valuations may indicate that the index prices will fall to restore fair value, but this is not always the case. For example, in January of 1992 the market was overvalued by 31% according to our CPI P/E ratio model. However, the price never dipped more than 9% during the following two years. Earnings growth finally closed the valuation gap in early 1994 and the S&P 500 index assumed its ascent until the dot-com bubble burst in 2000.
Figure 6
Figure 6: Created by author. S&P 500® Historical Data. (^GSPC) (2019). Yahoo!Finance. iShares Core U.S. Aggregate Bond ETF (Ticker: AGG) Historical Data. (^AGG) (2019). Yahoo!Finance. Return Data Prior to 10-1-2003 based on Barclays Capital U.S. Aggregate Bond Index, iShares by Blackrock. Return data prior to 1-1-1989 is based on a fixed 3% annualized rate of return. 5
Conclusion
Every bear market in the last 50 years has been preceded by either an earnings dip, an economic downturn or high valuation. Most bear markets have elements of all three factors. Since 1966, every bear market has been preceded by excessive valuation or was the result of economic contraction.
Based on this model, investors should be 100% in equities (as of January 27, 2020).
Equity markets tend to revert to the mean over the long run. The CPI P/E ratio signal is a way to identify when an equity market reaches excessive valuation. Using this information to re-position assets away from the stock market into aggregate bonds is a successful investment strategy.
Drake Vader [email protected] currently resides in Santa Clara, CA and was formerly employed as an Investment Analyst with 30+ years of experience in the Investment Management & Financial Services industries.
Footnotes & Sources:
The material in this article is for informational purposes only and is prepared with no regard to the investment objectives, financial situation or needs of any specific reader. If you are an individual investor contact your financial advisor or other fiduciary about whether any given investment idea or strategy may be appropriate for your circumstances. All investments involve risk, including loss of principal. The performance data shown represent past performance, which is not a guarantee of future results.
1. Source: 2020 S&P Dow Jones Indices LLC. https://us.spindices.com/indices/equity/sp-500
2. Source: U.S. Bureau of Labor Statistics. Release: CPI for All Urban Consumers (CPI-U), 12-month% change. https://data.bls.gov/timeseries/CUUR0000SA0?output_view=pct_12mths Note: I only use information which would have been available on date of record, for this reason CPI YOY % was based on prior months data.
3. Sources: Board of Governors of the Federal Reserve System (US). https://fred.stlouisfed.org/series/GS30 U.S. Bureau of Labor Statistics. Release: CPI for All Urban Consumers (CPI-U), 12-month% change. https://data.bls.gov/timeseries/CUUR0000SA0?output_view=pct_12mths 2020 Moody's Analytics, Inc., Economy.com, https://www.economy.com/store/shop.aspx?searchTerm=crb%20spot%20raw
4. Source: U.S. Aggregate Bond Returns represented in the graphic are based on a composite consisting of - iShares Core U.S. Aggregate Bond ETF (Ticker: AGG). https://finance.yahoo.com/quote/AGG/history?period1=1064966400&period2=1577750400&interval=1d&filter=history&frequency=1d Data prior to 10-1-2003 based on Barclays Capital U.S. Aggregate Bond Index, Data source for returns (discontinued): https://www.ishares.com/us/products/etf-investments?ticker=AGG Return data prior to 1-1-1989 is based on a fixed 3% annualized rate of return.
5. Performance history comes from third party sources believed to be accurate and reliable, total return figures have not been validated. In addition, Performance data do not reflect the deduction of any commissions or account service fee that may be applied. If additional fees were included, performance would be lower.
More ETF Topics >
 Advisor Perspectives welcomes guest contributions. The views presented here do not necessarily represent those of Advisor Perspectives