Quantitative value investors have traditionally relied on price-to-book as the metric to classify stocks. But new research shows that price-to-enterprise value is a more powerful tool to construct portfolios. That research also sheds light on the question of whether the value premium is risk- or behaviorally-based.
Among the reasons investors have confidence in a value premium in equities are that it has been persistent across economic regimes; pervasive around the globe, industries and even asset classes; and robust to various definitions, including price-to-book, price-to-earnings, price-to-cash flow, price-to-sales and price-to-dividends. The research on the value premium was extended to the use of the enterprise multiple as the value metric by Tim Loughran and Jay Wellman in their 2010 study, “New Evidence on the Relation Between the Enterprise Multiple and Average Stock Returns.” The paper was published in the December 2011 issue of the Journal of Financial and Quantitative Analysis. Loughran and Wellman found that the enterprise multiple (equity + debt + preferred stock - cash) / (EBITDA) – earnings before interest, taxes, depreciation and amortization – is a strong determinant of stock returns, generating a return premium of 5.3% per year. They interpreted the enterprise multiple as a proxy for the discount rate. “Firms with low enterprise multiple values appear to have higher discount rates and higher subsequent stock returns than firms with high enterprise multiple values.”
Christian Walkshäusl and Sebastian Lobe extended the research on the enterprise multiple to international markets in their study “The Enterprise Multiple Investment Strategy: International Evidence,” which appeared in the August 2015 issue of the Journal of Financial and Quantitative Analysis. They found: “The enterprise multiple (EM) predicts the cross section of international returns. The return predictability of EM is similarly pronounced in developed and emerging markets and likewise strong among small and large firms. An international portfolio of low-EM firms outperforms a portfolio of high-EM firms by about 1% per month. The EM value premium is individually significant for the majority of countries, remains largely unexplained by existing asset pricing models, is robust after controlling for comovement with the respective U.S. premium, and is highly persistent for up to 5 years after portfolio formation, making it a promising strategy for investors.”
Steven Crawford, Wesley Gray and Jack Vogel contribute to the literature with their study “Why Do Enterprise Multiples Predict Expected Stock Returns?” which was published in the November 2019 issue of The Journal of Portfolio Management. They investigated why EM is a more powerful predictor of expected average returns relative to traditional value measures such as book-to-market. “A key question in asset pricing is whether high average expected returns associated with value stocks and low average expected returns earned by glamour stocks are compensation for risk or a result of systematic mispricing.”
The debate about whether the source of the value premium is risk or behavioral errors has been raging for 25 years, with many published papers showing support for both explanations. This has led me to conclude that the explanation likely isn’t black or white, but gray (the value premium is partly explained by risk and partly by behavioral errors, with limits to arbitrage preventing sophisticated investors from correcting mispricings).
To test whether the EM premium was risk- or behavioral-based, Crawford, Gray and Vogel created test portfolios by sorting stocks on EM and 11 proxies for the ex-ante fundamental value of the stock first used by Robert Stambaugh, Jianfeng Yu and Yu Yuan in their study “The Short of It: Investor Sentiment and Anomalies,” which appeared in the May 2012 issue of the Journal of Financial Economics. The 11 proxies Stambaugh, Yu, and Yuan used are all anomalies from the traditional finance view that risk and return should be related. Their variables are: financial distress (firms with high failure probability have lower, not higher, subsequent returns), net stock issuance (issuers underperform non-issuers), accruals (firms with high accruals earn abnormally lower returns on average than firms with low accruals), net operating assets (defined as the difference on a company’s balance sheet between all operating assets and all operating liabilities scaled by total assets, it is a strong negative predictor of long-run stock returns), momentum (high past recent returns forecast high future returns), the gross profitability premium (more profitable firms have higher returns than less profitable ones), asset growth (companies that grow their total assets more earn lower subsequent returns), return on assets (more profitable firms have higher expected returns than less profitable firms) and investment-to-assets (higher past investment predicts abnormally lower future returns).
Crawford, Gray and Vogel created a 12th variable by combining scores from the 11. Their breakpoints for value and growth were the 20th and 80th percentiles for each of the variables. Their database covered the period July 1972 through December 2015. Following is a summary of their key findings:
- The EM effect is primarily attributable to mispricing and cannot be explained by higher systematic risk. The four-factor (beta, size, value and momentum) alphas of the low mispricing variables were indifferent from zero. On the other hand, the four-factor alpha estimates for the high-mispricing portfolios are positive and significant at the 5% level in every instance.
- The returns and alpha estimates increase across the fundamental value quintiles.
- Earnings announcement returns, forecast errors and forecast revisions all support the notion that the EM effect is driven by mispricing associated with predictable investor expectation errors. For example, in every EM quintile, earnings announcement returns are larger for firms in quintile five of the composite fundamental value measure than for firms in quintile one, suggesting that the market is positively surprised by subsequent earnings announcements for firms with high fundamental value. They also found small negative earnings forecast revisions for value firms with high fundamental value relative to glamour firms with low fundamental value.
- The EM effect is stronger during times of strong market sentiment, which is further evidence that the effect is driven by mispricing.
- Over 80% of the alpha associated with the best EM portfolio is generated by the short leg. If managing short positions is costly, these results suggest that the mispricing associated with the high-mispricing EM portfolio is difficult to exploit profitably.
- The findings were robust to multiple tests including various formation periods, performance against various asset pricing models, and calendar (specifically, January) effects.
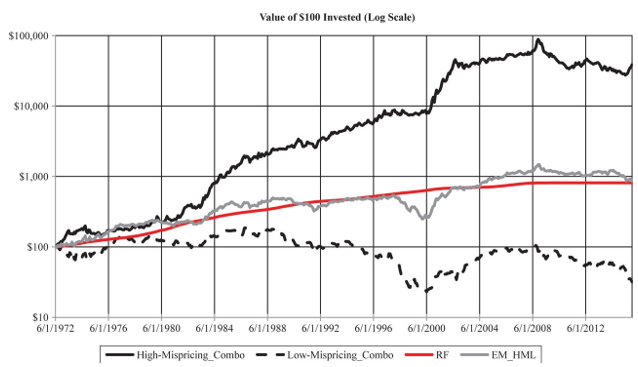
The following chart from the paper shows the impressive performance of a long-short portfolio relative to the risk-free return.

Their findings led Crawford, Gray and Vogel to conclude: “The evidence from this analysis supports the notion that the EM effect is driven, at least in part, by mispricing associated with predictable investor expectation errors.”
The finding that most of the EM premium is generated by the short side, which can be expensive to trade, does not mean that the finding doesn’t provide valuable information. Long-only investors can still benefit by avoiding purchasing stocks in the short leg, stocks which are owned by total market portfolios. As the authors noted: “The empirical results suggest that the absolute pricing is concentrated in the long leg of the high-mispricing EM portfolio; however, on a risk-adjusted basis, the mispricing is concentrated in the short portfolio of glamour firms for the majority of the high-mispricing portfolio constructs.” They added: “Returns associated with short-selling strategies are often difficult to obtain in practice. … If costly market frictions continue to exist and investor expectation errors persist, we can expect that the EM effect may continue in the future.”
Their research led the money management firm Alpha Architect, of which Gray and Vogel are managing members, to build portfolios that focus on the EBIT/TEV (total enterprise value) metric. Alpha Architect manages both ETFs and separate accounts, with about $800 million under management.
Findings such as these are why since 1992, when Fama and French published their paper “The Cross-section of Expected Stock Returns,” many value fund managers have moved away from using book-to-market as the measure of value, or the only measure of value, with many using multiple metrics, believing that no one measure is “the best.” Crawford, Gray and Vogel also presented evidence demonstrating that while the value premium may not be a free lunch (they did not rule out risk-based explanations for at least part of the premium), it seems like it might be at least a free stop at the dessert tray.
Larry Swedroe is the director of research for The BAM Alliance, a community of more than 140 independent registered investment advisors throughout the country.
More Active Management Topics >