Advisor Perspectives welcomes guest contributions. The views presented here do not necessarily represent those of Advisor Perspectives
If you invested in stocks whenever there was a Democratic president and bonds when there was a Republican one, since 1949, your return would be 20 times greater than the opposite strategy. Most of that gap occurred after 1980, when the divergence between Democratic and Republican fiscal and tax approaches widened.
Historically, the Republican Party has been associated with big business, capitalism and business-friendly policies. Over recent decades, its platform has included the promotion of lower tax rates on corporations and individuals. In addition, it has advocated balanced budgets and smaller governments with the argument that a smaller and more fiscally responsible federal government will accelerate growth, incentivize the private sector and lead to broader wealth creation. Republicans have also tried to restrict the growth of entitlements on the argument that these are both unaffordable and create outright disincentives to individual participation in the private economy.
Statistically speaking, one could describe the historical Republican economic strategy as an effort to raise the median income and wealth by increasing the extremes of income and wealth in any given period. The idea being that the upper extreme will increase more than the lower one. Over time, it will raise the lower end in a process described as “trickle down” as well as through incentive effects.
The Democratic fiscal and tax policy strategy has been quite different over most of the last half century, with a significant parting of ways after 1980. For the most part, the focus of the Democratic approach to economic growth has been to directly raise the living standards of the lowest income and wealth deciles of our distribution through programs designed to supplement incomes and offset costs. These have included unemployment benefits, the supplemental nutrition program for women, infants and children (WIC) and Medicaid. They have also promoted initiatives designed to retain members of disadvantaged groups in the economic mainstream including sentencing reforms, more lenient treatment of narcotics convictions and the like. These were to be paid for by increasing tax rates on higher income deciles. In general, the Democratic platforms have been more fiscally expansive where the prospect of deficit financing has been concerned, if that was necessary – although as I discuss in my conclusions, that distinction has been more a feature of platforms and rhetoric than of reality.
From a distributional standpoint, one could characterize the Democratic strategy as focused on raising the median by reducing the extremes and using tax funding to outright raise the bottom and, hopefully, invest enough in the lowest deciles to create an “escape velocity” that would allow people to pull themselves out of poverty.
From the perspective of non-tax business regulations, the Republican Party is usually thought to be a promoter of less onerous regulations. The Democrats have been accused of being too prone to impose costly regulations and to interfering excessively with markets, to the detriment of business and the economy.
Examining historical market outcomes
Naturally, there is controversy over which of these policy approaches is better at achieving the objective of increasing total wealth. There are many different ways to measure wealth and the contribution of political strategies to the currents of rising and declining prosperity. As measures of wellbeing and prosperity, one could look at total private wealth, incomes, income distributions, literacy, health outcomes and a multitude of other measures. Here, I focus on one way to compare the success of Republican and Democratic policy strategies: Compare investment strategies that ought to be better or worse according to the success of the policy strategies to promote the growth of private business.
Below, I asses the returns to stocks and bonds during periods when a Republican or a Democrat was president.
Going back to the beginning of 1949, when Democratic President Truman was inaugurated, Democrats have held the presidency for 32 years and Republicans for 38 years.
Looking at those 70 years and two months since Truman’s Inauguration, until the end of March 2019, the US large-capitalization stock index (think S&P 500) has risen about 1,960-fold. In other words, a dollar invested in the stock index at the end of January 1949 would be worth $1,960 today with dividend reinvestment and ignoring taxes and investment costs. Over the same period, a broad bond index would have returned about $42 for each dollar invested.
But were the performances of stocks and bonds any different depending on the occupant of the White House?
As a simple test, I compared two investment strategies:
Strategy 1: When a Republican is in the White House, invest in the stock index. When a Democrat is president, invest in the bond index.
Strategy 2: Flip the strategy – Buy the stock index when a Democrat is president and bonds, when a Republican is president.

The reasoning behind the allocation switches is straightforward. If government policy creates a better environment for business and growth of corporate earnings, one would expect that to be reflected in stock market performance in fairly short order.
With the bond market, however, things are more ambiguous. Bonds do well as nominal yields decline. However, nominal yields may decline because expected real yields fall – as would be the case in a recession. They may also decline due to falling expected inflation rates. We’ve seen both in the last few decades with bond bull markets under Reagan and Clinton due to declining expected inflation, as well as good bond performance under George W. Bush due to recession.
If the incumbent has no effect on the fortunes of the stock market, you’d expect the performance of these strategies to be about the same. Otherwise, you’d expect the better performance under a more business-friendly presidents.
Results
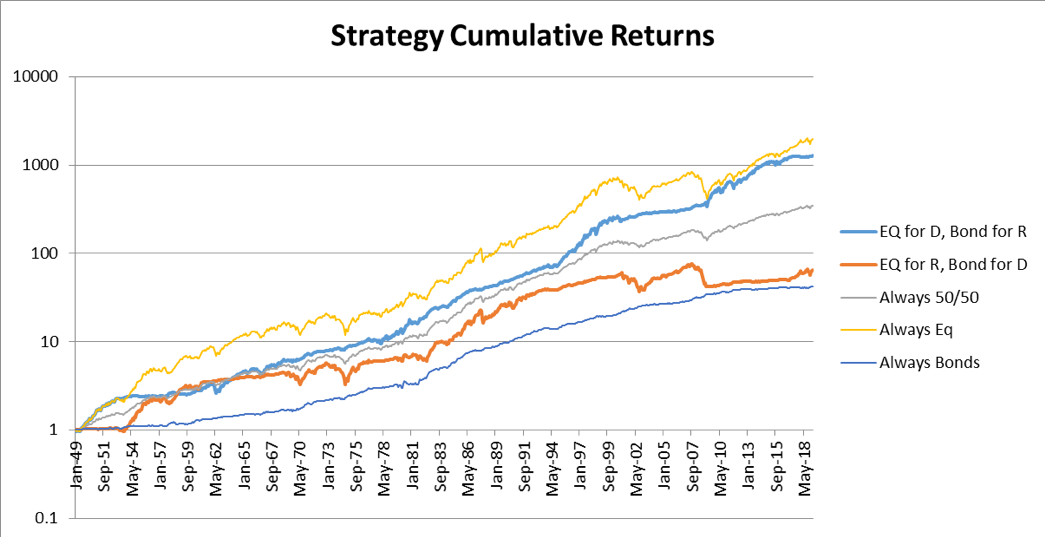
What do the results tell us? Strategy 1 returned about $65 on April 1, 2019 for every dollar invested in 1949. Strategy 2 returned $1,282 or nearly 20 times as much.
In terms of average annual returns, strategy 1 returned 6.1% per year. Strategy 2 returned 10.8% per year. A 4.7% per year difference might not sound like a lot but it compounds quickly. After a four-year term, the difference would be 20%. After 20 years, a difference of about 150%.
Investing in the equity index alone for the 70 years and two months would have generated an average annual return of 11.4%, while 100% in the bond index would have returned 5.5% annualized. A 50/50 portfolio held throughout and rebalanced monthly would have yielded $348 at the end for each dollar at the start; an annualized return of 8.7%
The $1,282 versus $65 comparison is a little skewed, however, because Republicans held the White House for 38 years versus 32 for the Democrats. Given the stock/bond return spread, the null hypothesis that the incumbent’s party doesn’t matter would have produced a result with the Republican strategy (strategy 1) outperforming by 31%.
The simple investment strategy implied by the strategy is to invest in stocks whenever the president is a Democrat and bonds for a Republican. Democratic presidencies have been far and away better for business and investors.
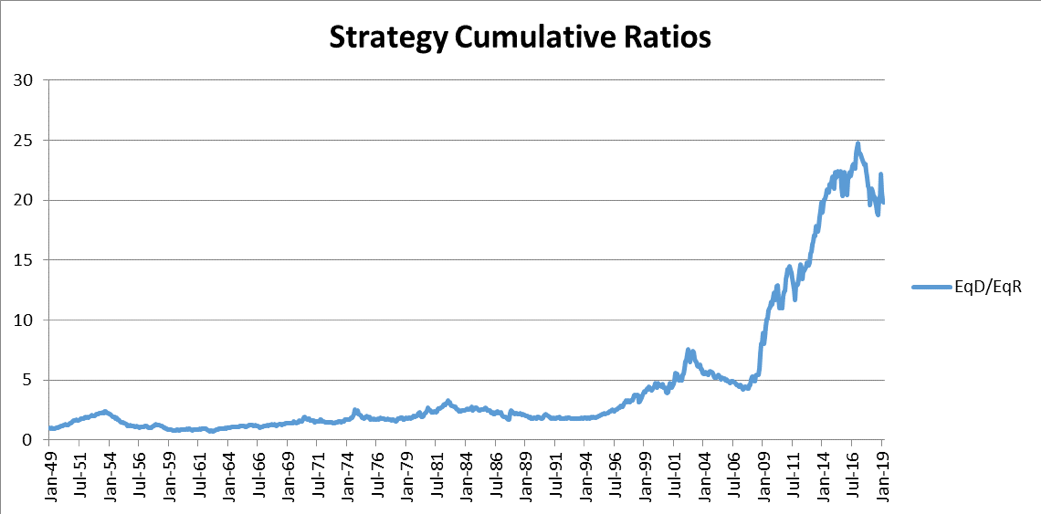
The chart below illustrates the historical evolution of the ratio of the returns to the two strategies. Prior to the Nixon era, the ratio, while favoring Democrats, isn’t pronounced. By Nixon’s first inauguration, returns favored the Democrats only by 38%. Even that difference can be attributable in part to the higher number of years of Democratic presidencies (12) versus Republican (8). In the first 50 years, the cumulative Democratic advantage was about 5:1. After 2001, the cumulative Democratic advantage expanded by another nearly 4:1.
The Nixon, Ford and Carter years all favored strategy 2, with the ratio at the end of the Carter years (Jan 1981) sitting at 2.44.
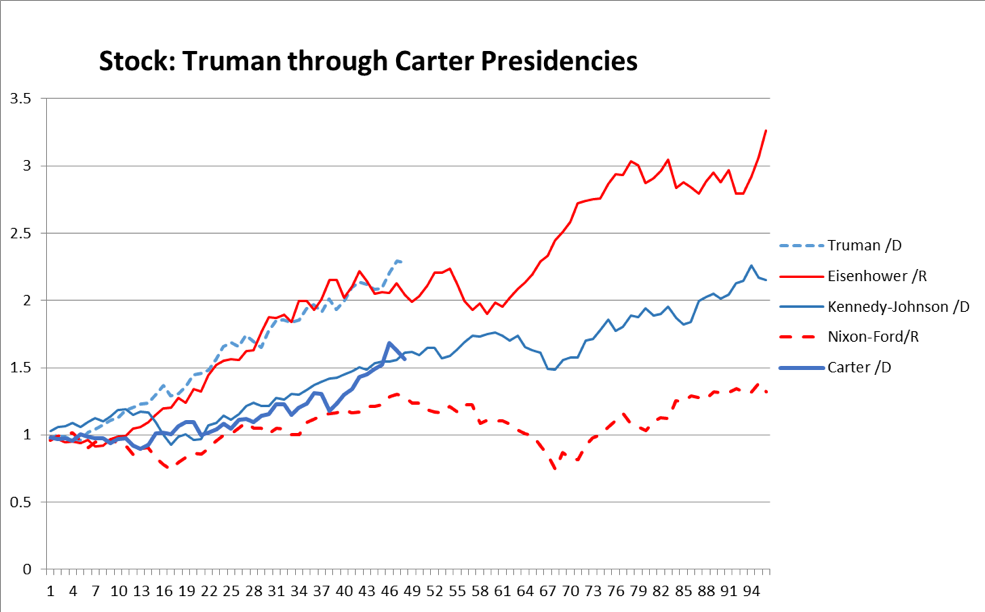
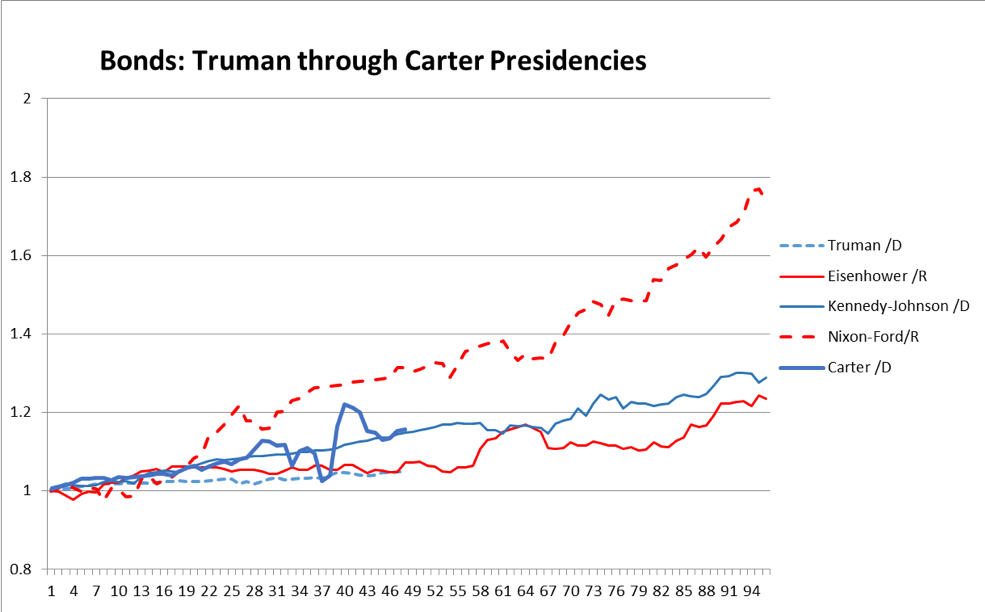
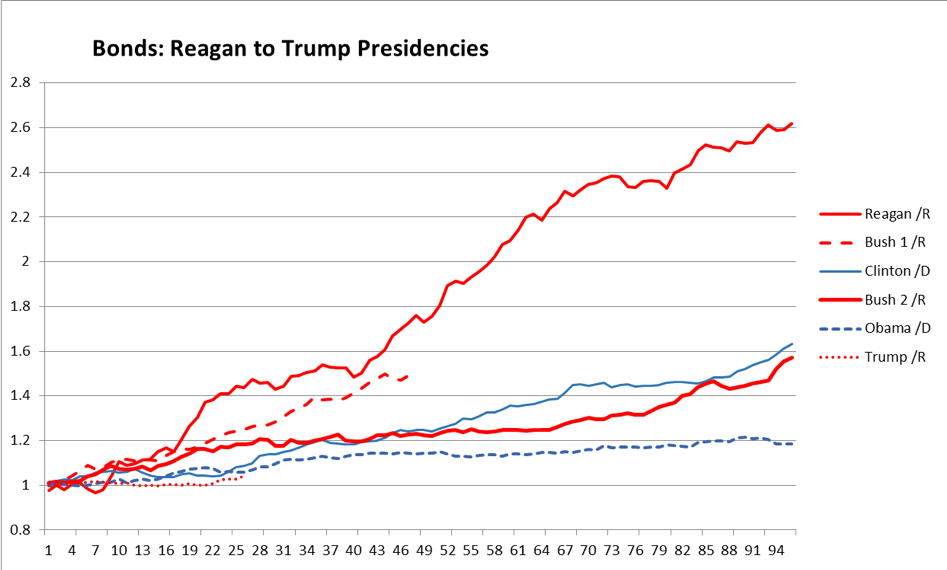
In Chart 2, below, I show the relative stock market performances under Presidents Truman (February 1949) through Carter (January 1981). Stock market performance was nearly identical in Truman’s term and President Eisenhower’s first term. Eisenhower’s second term continued with good stock market performance. Kennedy’s and even Carter’s were overall positive for the stock market. Of this group, Nixon/Ford’s was the poorest. Indeed, while stocks were up 32% over those years, the bond index rose 74%.
There was arguably a sea change in the Republican platform concerning taxation and fiscal policy beginning with President Reagan. These included a focus on reducing top income tax rates, justified by the Laffer Curve idea, while simultaneously running deficits in previously unheard-of magnitudes with the idea that the lower taxes would spur economic growth sufficient to pay back the borrowed funds.
The Reagan years proved to be very good for the stock market, and thanks to an aggressive and successful battle against inflation, good for the bond market as well. The stock market was up a cumulative 223%. However, the bond market was actually not far behind at +162%. Consequently, the performance gap in our two investment strategies declined only from 2.44 to 1.98.
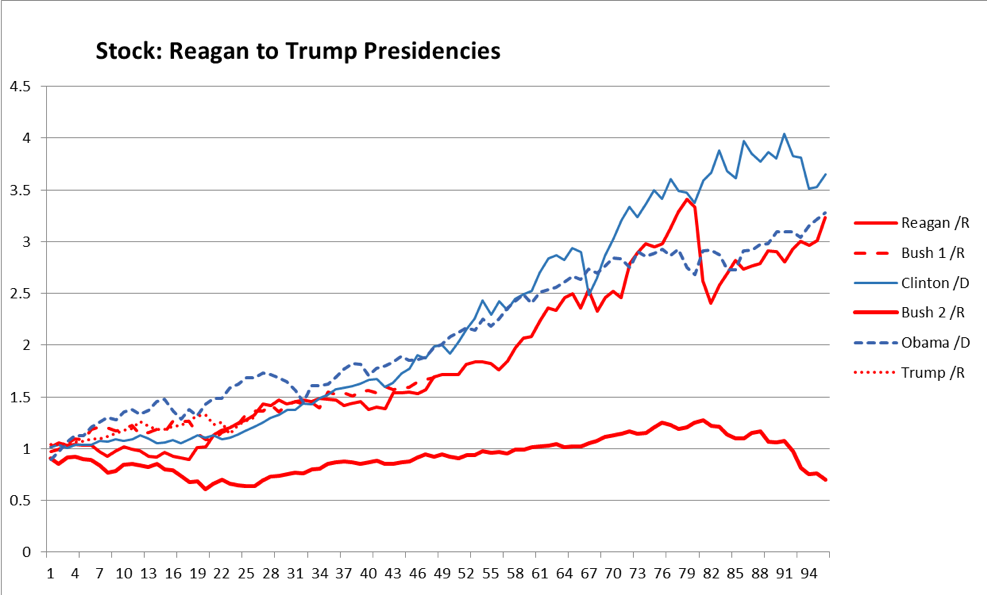
Chart 4 shows the performance of the equity markets during the presidencies of Reagan (February 1981) through Trump (March 2019). Under George H.W. Bush, the stock market did somewhat better than the bond market so the ratio of the strategies went from 1.98 (98% Democratic advantage) to 1.78. It was after the years of Bush 1 that we see the pronounced performance difference – through the succeeding 25 years. Clinton’s and Obama’s presidencies saw notable equity outperformance, while George W. Bush’s years saw the worst cumulative equity performance of any presidency in the last 70 years.
Chart 5 shows the performance of the bond market during the presidencies of Reagan through Trump. The most notable outperformance was during the Reagan years as inflation dropped bringing interest rates down. The Clinton years also saw outperformance in the bond market as inflation fell further, while in the G.W. Bush years, the good bond market performance was due first, to further declines in inflation, and then in its last year because of the recession.
Under Clinton, the ratio of the performance of the two strategies went from 1.78 to 3.99. Under G.W. Bush it rose to 8.97 (The stock market index was down 30% while the bond index was up 57%). Under Obama, it rose further to 24.78 due to a 228% rise in the stock index and a 19% rise in the bond index.
The first 26 months of the Trump presidency saw the ratio fall to 19.84 with a 30% cumulative rise in the stock market and a 4% rise in the bond index.
Chart 7, below, summarizes the performance of the two strategies as well as the equity index, bond index and a 50/50 monthly rebalanced equity/bond allocation. The vertical scale is logarithmic.
The role of other factors
Could factors other than business-friendly policies account for this difference? How about GDP growth, or deficits? Nominal GDP growth, arguably a key driver of profits, had almost identical averages under Democratic (6.3%) and Republican (6.4%) presidencies. Some people have tried to argue that economic and market performance under the Democrats is due to a “sugar high” fueled by runaway deficits. However, if you compare the average deficits as a percent of GDP under Democratic (2.1%) and Republican (2.3%) presidencies, it is actually a little higher under Republicans.
The president doesn’t unilaterally control the nation’s policy agenda. Consequently, one might argue that looking at the performance of stock and bond markets depending only on the presidency over simplifies the problem. It doesn’t account for the two houses of Congress and their roles. I also compiled data on Democratic and Republican majorities in the House and Senate and ran preliminary statistics on those as well. The results were inconclusive.
In part, that is because for many decades majority turnover in the House was rare, with the Democrats dominating for the period until 1995, and the Republicans since then, until the beginning of 2019. More recently, the combinations of presidencies coupled with the varying leaderships in the House and Senate created too many individual cases over a short period of time to be able to draw any statistical conclusions with confidence.
From 1949 to 1981 the Senate Democrats held the Senate majority for all but one session. After that, there were typically switches every six to eight years. It was even more lopsided in the House, where the Democrats held the majority from 1949 to 1995, except for one session, from 1953-55. Since then, we have had Republican majorities in all but three sessions.
Eric Stubbs has worked in financial services in New York for 30 years, most recently managing a global investment strategy. He earned a Ph.D. in economics from Harvard. The quantitative results are based on a monthly total return series for the S&P 500 to represent stocks, and intermediate government bonds to represent bonds. Nominal GDP and deficit figures are from FRED. Calculations were made by the author.
More Fixed Income Topics >