Advisor Perspectives welcomes guest contributions. The views presented here do not necessarily represent those of Advisor Perspectives.
"When a company is selling a product with commodity-like economic characteristics, being the low-cost producer is all-important."
Warren Buffett, Berkshire Hathaway shareholders letter, 2000, emphasis ours
“In many industries (reference to commodities), differentiation simply can’t be made meaningful. A few producers in such industries may consistently do well if they have a cost advantage that is both wide and sustainable. By definition such exceptions are few, and, in many industries, are non-existent. For the great majority of companies selling “commodity” products, a depressing equation of business economics prevails: persistent over-capacity without administered prices (or costs) equals poor profitability.” - Warren Buffett, Berkshire Hathaway shareholders letter, 1982, emphasis ours
This is the eighth article in our series of articles discussing our analytical framework for identifying and assessing the existence and persistence of competitive advantages. In this article, we discuss a very limited form of moat – one driven by low cost advantage that is not a result of scale of operations.
Defining low-cost producer (LCP) moats
LCP moats exist when the business is one of, if not the, lowest cost producers in its industry. Importantly, the cost advantage should not be a result of economies of scale (EoS). Instead, the advantage that we are interested in here is a result of advantaged source of production or advantaged access to raw materials used in production. This is especially the case with natural resource producers or companies that use natural resources as their raw materials.
LCP moats are not the same as economies of scale
Frequently, analysts classify such moats as economies of scale because of the basic characteristic of both these moats; low costs in relation to competitors. However, LCP-based moats are a specific case of competitive advantage where the cost of production isn’t just a factor of the scale of production or the type of production technology employed. These in turn are the primary determining factors for economies of scale (EOS) moats as the per-unit fixed cost declines as output increases and the per-unit variable cost reduction is a factor of operational efficiencies and synergies.
LCP moats – differentiating characteristics
The distinguished source of advantage for LCP moats as compared to EoS moats gives birth to two important differentiating factors. Firstly, as the cost advantage of LCP moats is not a factor of scale, they are harder and frequently impossible to replicate. On the other hand, a motivated entrant with access to capital always has the possibility of replicating the EoS advantages.
In this respect, LCP-based moats have a wider advantage as compared to that of EoS-based moats. Secondly, much as it is difficult for a new entrant to replicate the advantaged capacity of the incumbent, for the incumbent it is hard to translate their cost advantages to their new capacities, especially so for greenfield capacities. This factor limits the business-value growth possibilities for such moats. The limited ability to grow business values is the primary reason why we classify such moats as the weakest source of competitive advantages.
Analytical framework: LCPs and sustainable competitive advantages
For low cost of production to lead to sustainable competitive advantages, two critical elements need to be present, namely wide distribution of industry’s cost curve and limited availability of low-cost sources of supply.
- Wide distribution of Industry’s cost curve
The most important element that dictates the extent of competitive advantage of LCP-based moats is the variance in costs of production of the industry. The wider the distribution of production costs across available capacities within the industry, the wider the competitive advantage for low cost producers.
- Limited availability of low-cost sources of supply
The second factor that determines the extent as well as the durability of the competitive advantage of LCP-based moats is the availability of supply at advantaged costs as a proportion of the industry’s total supply curve. In general, less than half of the overall supply curve should be covered by low-cost sources of supply.
The analyst should pay special attention to the current demand for the industry’s products in relation to full-cycle demand levels. Preferably, the amount of supply provided by low-cost suppliers will be less than the worst-case demand scenario for the industry’s products.
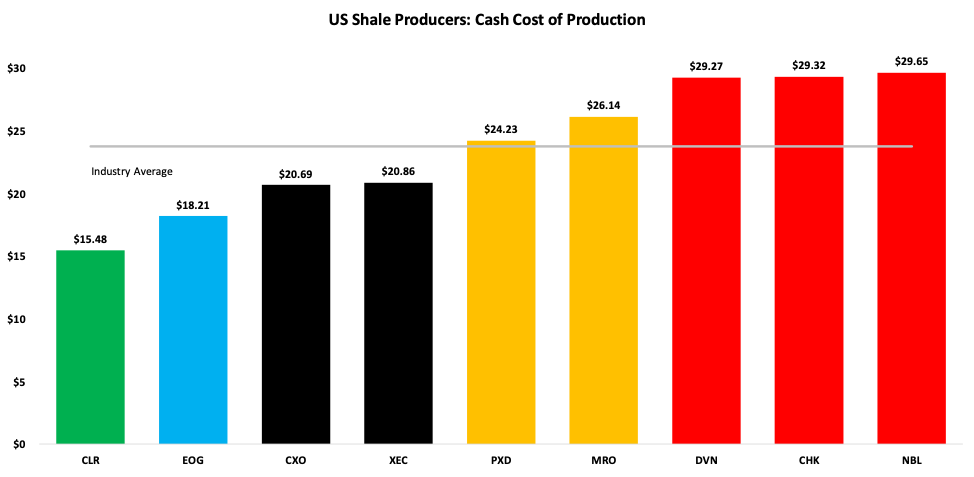
Consider the case of EOG Resources. EOG is the third-largest oil producer in the U.S. and is the leader in extracting oil from tight shale formations. It is amongst the lowest-cost shale oil producer in the U.S. upstream segment driven by its highly productive premium acreage in a number of shale plays (primarily Eagle Ford and Permian). EOG’s premium drilling locations produce twice as much gross oil as the non-premium locations and operate at much lower finding and development costs.
The only other player with a lower cost of production is Continental Resources. Continental’s cost leadership emanates from its ownership of low-cost oil-rich assets in the Bakken field where it is a top operator.
Figure 1 shows our estimate of cash cost of production for U.S. shale oil producers. As is seen, EOG and Continental are the lowest cost producers with a reasonably wide distribution of industry cots curve that spans from $15 to $30 per barrel.
Figure 1. Cash cost of production for U.S. shale oil producers

Source: Company data and MAEG calculations1
Analytical framework: Ancillary elements
In addition to the primary components of the analytical framework discussed above, the analyst should pay heed to additional factors as discussed below. What follows is not an exhaustive list of ancillary factors.
- Remaining production life
As the competitive advantage of the LCP business is driven by access to advantaged sources of supply, it is important to understand the remaining production life or reserve life of such advantaged sources of supply. The remaining production life is an important element in the evaluation of the most as well in the valuation process as it will dictate the duration of competitive advantage of the business.
- Loss of source of production
Since a company’s source of competitive advantage hinges on access to the production source, the primary risk emanates from loss of source of production – either because of exhaustion or because of regulatory factors. The analyst needs to pay heed to the future production of commodity from available reserves and the replacement of existing reserves to maintain or increase production. Exhaustion of the advantaged source of production and replacement of existing reserves with higher cost projects could result in narrowing of the cost advantage in relation to its peers.
- Balance sheet strength/Financial leverage
Undue financial leverage, even for businesses with widest and most durable of moats, gives rise to the possibility of permanent losses of capital. However, it is particularly important for LCP-based moats. As these businesses tend to be price takers and their industries tend to be characterized by high cyclicality, even moderate financial leverage may be enough to kill the business during deep industry downturns.
Thus, it is of utmost importance that the balance sheet of such a business is structured to survive the worst of the environments. As Peter Lynch said in Beating the Street, “the most important question to ask about a cyclical is whether the company's balance sheet is strong enough to survive the next downturn.”
- End use of commodities/Demand for end product
As discussed in our earlier article on economies of scale, no matter how low one’s cost of production is in relation to competitors, it will be a poor business if the customers don’t need the product or service. Commodities find various end uses and serve as raw materials for manufacturing of finished goods. Accordingly, the analyst needs to maintain a close tab on demand for end products which uses the commodity.
Consider the case coal producers such as Cloud Peak Energy (spun off coal unit from Rio Tinto). Coal is the second largest source of energy accounting for 40% of electricity generation worldwide. However, the share of coal-fired generation is likely to decline substantially, declining to 25% of world’s electricity production in 2040. Clearly, thermal coal is likely to be displaced with natural gas and renewable energy sources taking its place in electricity production process and will thus act to reduce demand for thermal coal.
Application of the framework: ExxonMobil
ExxonMobil Corp., an integrated oil and gas company, was formed in 1999 by the merger of Exxon and Mobil. The Company is engaged in the exploration, production, transportation and sale of crude oil and natural gas, and the manufacture, transportation and sale of petroleum products. Exploration and production segment of crude oil and natural gas accounts for nearly 60% of company’s net profits.
Distribution of industry’s cost curve and supply of low-cost sources
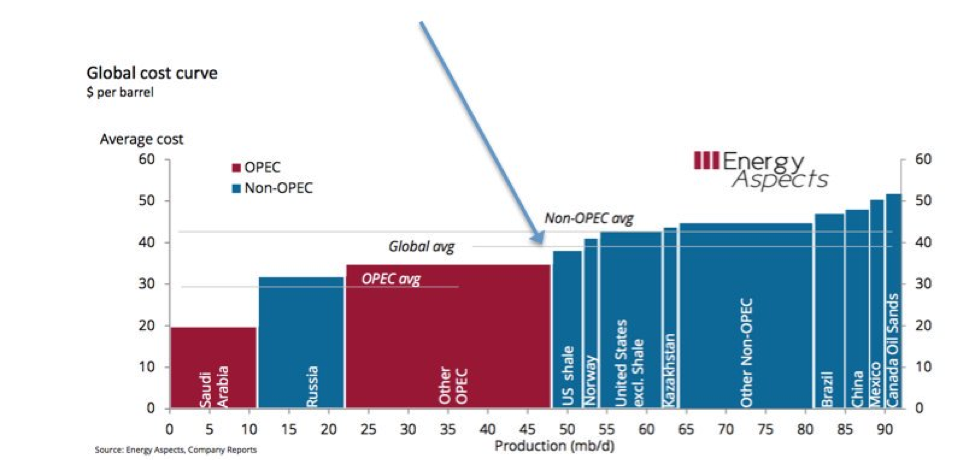
Figure 2 shows the overall cost curve for global oil industry as estimated by Energy Aspects2. As is seen, the cost curve of the industry has a rather wide distribution spanning from $20 per barrel to $50 per barrel. Additionally, just about half of the industry’s supply is met by low cost sources of supply.
Figure 2. Global cost curve for oil producers
Source: Energy Aspects3
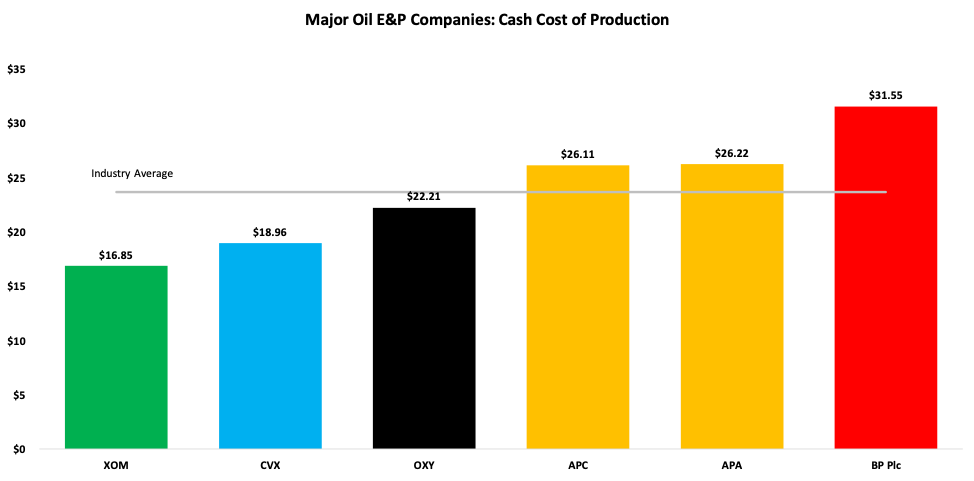
Exxon’s positioning in relation to competition
Figure 3 shows our estimate of cash cost of production for Exxon and other conventional producers. Clearly, Exxon occupies the pole position of all E&P majors with the company having the lowest cash cost of production.
Figure 3. Cash cost of production for conventional oil producers
Remaining reserves life
ExxonMobil's proved reserves totaled more than 22 billion oil-equivalent barrels at year-end 2018, 64% of which are liquids. As a result, ExxonMobil’s has a long reserves life of about 15 years at current production rates.
Replacement of sources of production
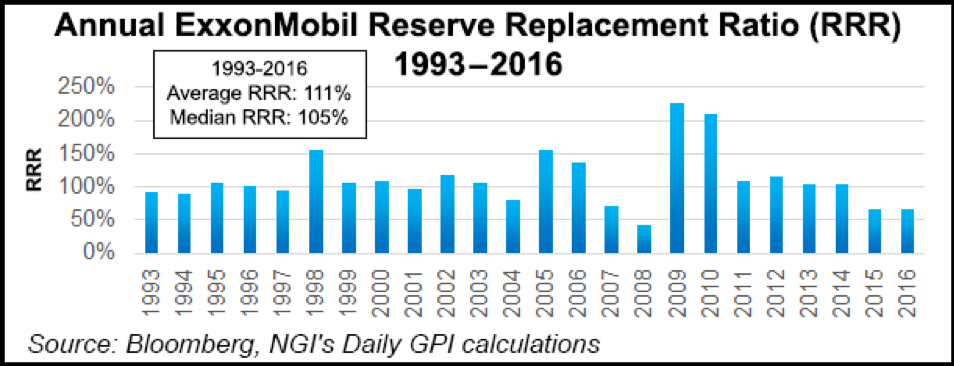
Exxon has a successful track record of profitably replacing its reserves through drilling and acquisitions. In 2018, the upstream business produced 3.8 million oil-equivalent barrels per day and company added 4.5 billion oil-equivalent barrels of proved reserves during the year resulting in a reserve replacement ratio of more than 100%.
Figure 4 shows Exxon’s reserve replacement ratio over the last 25 years. As is seen, Exxon’s reserve replacement ratio has averaged over 100% with deceleration over the past few years.
Figure 4. Exxon Mobil, Reserves replacement ratio
Source: Natural Gas Intel
Financial leverage
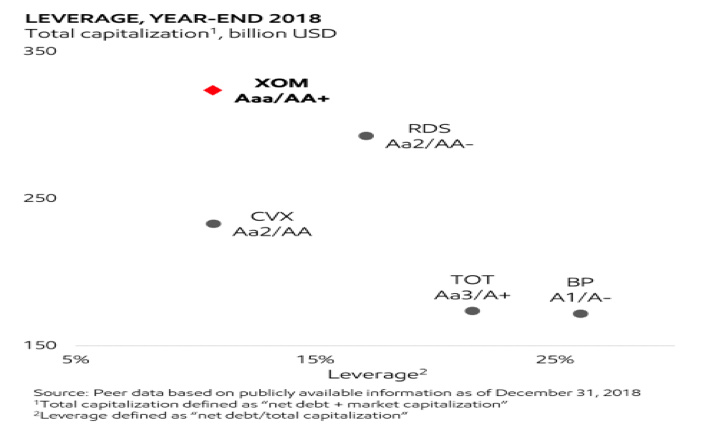
Lastly, Exxon has a strong balance sheet with an 11% debt-to-capital ratio and an AA+ credit rating. Figure 6 shows leverage as proportion of total capitalization for Exxon and its competitors.
Figure 5. ExxonMobil’s leverage comparison with peers
Source: ExxonMobil 2019 Investor Day
Exxon satisfies each one of our moat assessment criteria for LCP-based moats with low cash cost of production and a wide distribution of industry’s cost curve. Additionally, it currently sports a fairly long reserve life of nearly 15 years and a strong balance sheet. Accordingly, we classify ExxonMobil as a business that possesses sustainable competitive advantage driven by low cost of production.
Summary
Low cost of production in relation to that of a company’s competition can endow a business with durable competitive advantages within commodity businesses. While LCP moats are similar in nature to EoS moats with low costs being the primary factor, there are important distinguishing factors that necessitate the application of a differentiated analytical framework. We hope that the framework we have discussed here will help the analyst appropriately identify and evaluate such moats.
Baijnath Ramraika, CFA, is a cofounder and the CEO & CIO of Multi-Act Equiglobe (MAEG) Limited and is the Executive Director at Sapphire Capital. As a portfolio manager, he manages the Global Moats Fund and the India Moats Fund. Contact him at [email protected]. Baijnath’s thoughts and ideas can be read at his blog at www.symantaka.com
Prashant K. Trivedi, CFA, is a cofounder of MAEG and the founder and chairman of Multi-Act Trade and Investments Pvt. Ltd.
MAEG is an investment manager and manages the Global Moats Fund, an investment fund that invests in a global portfolio of high-quality businesses with sustainable competitive advantages. Sapphire manages the India Moats Fund, an investment fund that invests in a portfolio of high-quality Indian businesses with sustainable competitive advantages.
Multi-Act is a financial services provider operating an investment advisory business and an independent equity research services business based in Mumbai, India.
1 To calculate cash cost of production per barrel of oil equivalent, we converted annual production of oil, NGL, and gas to their respective oil barrel equivalent for each company. We then dividend each company’s total cash cost of production (calculated as cost of goods sold plus operating expenses minus depreciation and amortization) by production in barrels of oil equivalent. It is important to note that there are differences in each company’s mix of production in terms of oil, NGLs, and gas which in turn affects the costs as well as revenues per barrel of oil equivalent. To ensure that the calculated cash cost of production numbers were comparable across companies, we scaled the cash cost of production per barrel thus calculated by the ratio of realized prices per barrel of oil equivalent for the company and average realized prices for conventional oil producers under our coverage.
2 It appears that Energy Aspects tracks the overall production cost and not cash cost of production.
3 Sourced from https://twitter.com/javierblas/status/714366484403892224
More Factor-Based Investing Topics >