Advisor Perspectives welcomes guest contributions. The views presented here do not necessarily represent those of Advisor Perspectives.
This article was edited on April 12 at 9:30am to correct some formatting errors.
Interest rates
Because bond yields remain low relative to the experience of the previous half-century and because the yield spread between short- and long-term bonds is close to zero and even slightly negative or “inverted” in spots, many investors’ natural inclination is to hold a bond portfolio with a very short average maturity. Why commit to longer maturities when you are not rewarded for doing so in the form of higher yields and it appears unlikely that interest rates can fall much lower than they already are? While I don’t think that following this “common sense” inclination would be a huge mistake, that’s not what I’m doing in my own portfolio. Here’s why.
Financial PTSD
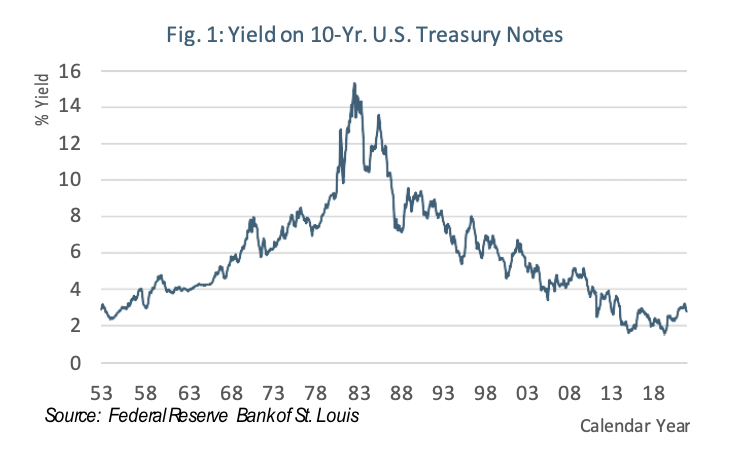
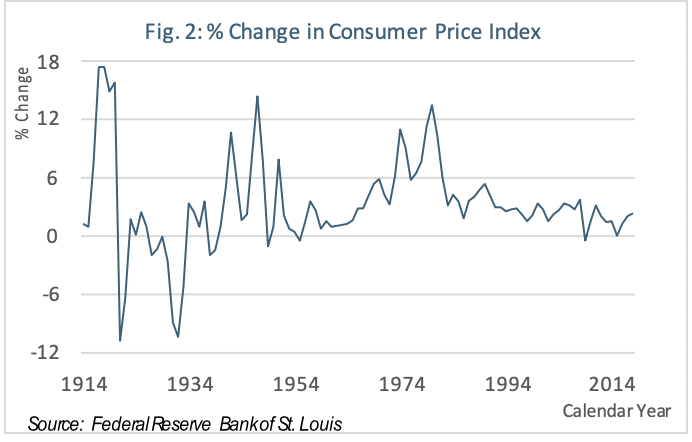
The period between the late 1960s and the early 2000s was an extremely unusual time in fixed-income markets (Figure 1). Initially, during the Vietnam War, interest rates increased as inflation rose (Figure 2) and investors demanded compensation in the form of higher bond yields for the declining purchasing power of their principal. In contrast to previous post-war experiences, inflation and interest rates kept increasing through the late 1970s. The Federal Reserve pushed rates even higher in the early 1980s to engineer a deep recession in an ultimately-successful effort to bring inflation down. Rapidly and sharply rising interest rates through the 1970s and early 1980s wreaked havoc with the market value of long- term bond portfolios. In the wake of this experience, post-traumatic stress disorder (“PTSD”) among investors was manifest in an extreme aversion to holding bonds with maturities longer than about five years. From the mid 1980s through the early 2000s, when the trend in interest rates was consistently downward, this aversion cost investors who succumbed to it a lot of forgone opportunities to lock-in relatively high interest rates for long periods of time.
But does extending maturities still make sense now that bond yields are about as low as it seems possible for them to go?
Actually, the most relevant bond yields are not particularly low.
The bond yield that should matter to an investor is neither the coupon interest rate nor the yield to maturity. The latter is the coupon rate adjusted for any premium or discount to the bond’s par value incorporated into the security’s purchase price. What should matter to investors instead is the yield to maturity minus the inflation rate over the security’s term, that is, the real yield. And at present, given that inflation has been low and stable for the last 20 years, real interest rates are not particularly low. The longer line in Figure 3 represents what an investor who purchased a constant maturity 10-year U.S. Treasury Note[1] at par at any time prior to December 1, 2008 and held the security to maturity would realize after inflation. The shorter line represents the market yield on constant maturity 10-year Treasury Inflation Protected Securities (TIPs), which were first issued in 2003. These yield series are only roughly comparable because investors who purchased 10-year fixed rate Treasury Notes were not guaranteed any particular real yield; what they realized depended on what inflation turned out to be.
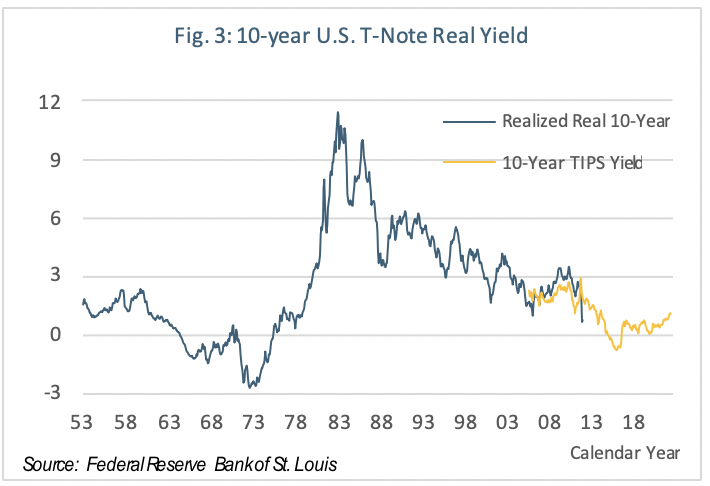
Thus, realized real yields were negative during the 1970s, when inflation was rising much faster than anticipated, and then extremely high, when inflation was decreasing surprisingly rapidly. Investors in TIPs are, by contrast, assured that they will realize the real yield associated with their purchase price. Thus fixed-rate Treasuries are riskier than TIPs and, accordingly, the yield on the latter should be somewhat lower. Thus, it is reasonable to assert that, at between one and two percent, real yields on 10-year U.S. government securities are about where they were the last time inflation was simultaneously low and stable.
Bond risk and the yield curve
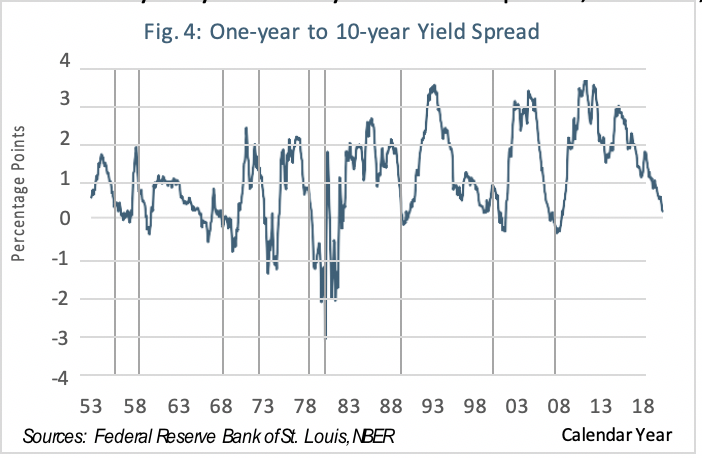
When interest rates go up, bond prices go down. For any given change in rates, the longer the maturity of a bond the greater the associated percentage change in its price. For example, the price of a 30-year bond will decline about 2.3 times more than that of a ten-year note if the yield on both rises by the same amount. Ordinarily, investors are compensated for this additional risk by higher yields on longer-term securities; that is, by the steepness of the yield curve. Since 1953 the yield on 10-year treasuries has averaged about one percentage point higher than the one-year Treasury Bill yield. This yield curve slope has, however, ranged between-3.07 and +3.40 percentage points.
One would think, therefore, that given the greater risk of longer-term bonds, instances when 10-year yields are lower than two-year rates – when the yield curve is “inverted” – would be a good time to shorten bond portfolio average maturity. Historically, just the opposite has more often been the case. The best time to buy longer-term bonds over the past 65 years was in September 1981, when the yield on 10-year Notes peaked at 15.32%. At that time the yield on one-year T-Bills was 16.52%. Accepting the higher risk of longer-term bonds and foregoing the extra 1.20% of yield was, in retrospect, the bond trade of the century.
It isn’t surprising that the yield curve was inverted in the late summer of 1981. The level of long-term rates at any given time reflects, among other things, fixed-income market participants’ collective expectations regarding the future path of short-term rates. If investors expect that the Federal Reserve will be raising the short-term rates it controls directly, they will demand higher yields on long-term securities as compensation for buying bonds now rather than staying in cash and waiting for what might be higher rates in the future. Under such circumstances the yield curve will e relatively steeply upward sloping. If, however, bond buyers in the aggregate anticipate a recession and more accommodative Fed policy, they will be willing to lock-in relatively low yields on longer-term bonds in the expectation that interest rates will fall even further in the future. Thus, the yield curve was inverted in the months leading up to and early after the onset of the severe recession which began in August 1981 and didn’t end until December 1982. Figure 4 illustrates a persistent pattern of flat or inverted yield curves preceding recessions. Thus, the current, essentially flat yield curve can be taken as reflecting a consensus expectation among investors in U.S. fixed income markets that interest rates are equally likely to rise or fall in the near term and, perhaps, most likely to remain close to where they are for a long, long time to come. I share that consensus expectation.
Bonds as a hedge
Bond prices rise when interest rates decline. Large decreases in interest rates tend to occur (i) when inflation or inflation expectations decrease and (ii) when economic growth is low or in recession. Stock prices tend to rise when economic growth is rapid. So, it is frequently the case that bond prices are rising when stock prices are going down and vice versa. The exceptions to this generalization have been times when inflation is either rising or falling sharply. If investors perceive that inflation is “out of control” they will sell both stocks and bonds and put their money in cash or hard assets. And when policymakers are successful at bringing inflation “under control,” fixed-income and equity markets can rally simultaneously. The period since 1953 has followed these patterns as reflected in Table 1.
Table 1: Movements of Stock Prices, Bond Yields, and Bond Prices through 10 Bear Markets
|
Peak Month |
Trough Month |
Peak to Trough S&P 500 Change |
Peak Month 10 Year Yield |
Trough Month 10 Year Yield |
Indicative* 10 Year Price Change |
|
Dec-68 |
Jul-70 |
-29% |
6.25% |
7.57% |
-9.1% |
|
Jan-73 |
Dec-74 |
-43% |
6.60% |
7.50% |
-6.3% |
|
Nov-80 |
Jul-82 |
-19% |
12.84% |
13.06% |
-1.2% |
|
Aug-87 |
Dec-87 |
-27% |
9.42% |
8.67% |
4.9% |
|
Jul-90 |
Nov-90 |
-13% |
8.44% |
7.73% |
4.9% |
|
Jul-98 |
Oct-98 |
-11% |
5.34% |
4.54% |
6.4% |
|
Aug-00 |
Apr-03 |
-44% |
5.80% |
3.81% |
16.4% |
|
Oct-07 |
Mar-09 |
-51% |
4.15% |
2.93% |
10.5% |
|
May-19 |
Jan-19 |
-10% |
2.20% |
1.89% |
2.8% |
|
Sep-19 |
Dec-19 |
-12% |
3.15% |
2.71% |
3.8% |
* This is the instantaneous price effect of the yield change on a 10-year bond that occurred over the course of the decline. For the longer declines, this calculation understates the total return.
The table shows what happened to stock and bond prices during the 10 occasions over the past 50 years when S&P 500 Index has declined by 10% or more from its previous all-time high to the subsequent low point. From the late 1960s through the mid-1980s, when inflation was seriously problematic, stock and bond prices declined simultaneously. Since then, however, there has been a consistent pattern of bond market price gains partially offsetting equity losses. Of course, 10-year bonds are not as volatile as stocks, so most portfolios would have lost value in these bear markets. But bond allocations, provided they have a long-enough maturity, have been able to reduce overall portfolio volatility with reasonable reliability through post-1980s bear stocks markets.
Longer-term bonds would have been an even more effective hedge. Consider, for example, the most recent episode, when 10-year Notes rose in price by around 3.8% over the course of last year’s fourth quarter. Over the same period of time, the yield on 30-year Treasury Bonds declined from 3.34% at the beginning of October to 3.04% by year-end, and that yield change would have been associated with a price increase of about 5.9%.
So, a bond portfolio can be a moderately effective hedge for equities, and the longer the average maturity the greater the potential effectiveness.
Conclusion
This article summarizes the four main reasons why, despite levels of seemingly low interest rates and despite the flatness of the yield curve, I have not shortened the target average maturity of my family’s bond portfolio. What would it take to change my mind? If I saw any signs that inflation was rising rapidly and that the Federal Reserve could not or did not want to bring it under control, I would certainly consider moving a lot of my fixed-income allocation into short-term bonds and cash. I do not, however, see any such signs at this time.
As with other aspect of investment strategy, the right average maturity for any given family’s or institution’s bond portfolio depends on the investor’s short- and long-term objectives and risk tolerance. A good place to start the discussion might be the average maturity of the total U.S. investment-grade bond market, which is about eight years. Risk-tolerant investors, who have large allocations to growth assets, should probably tilt somewhat longer. Risk-averse investors who hold lots of bonds and don’t like to see much fluctuation in their portfolio’s market value might want to target something less than eight years. But not too much less.
One final point. This discussion has referenced prices and yields on U.S. Treasury Bills, Notes, and Bond because more and better data is readily available for these securities. The same conclusions, however, apply to investment-grade municipal bond portfolios. If anything, because the tax-exempt yield curve tends to be steeper than the Treasury curve and because, unlike Federal government securities, most long-term state and local bonds can be called for early redemption, most investors’ target municipal bond portfolio average maturity should probably be a bit longer than the eight years suggested in the previous paragraph.
Aaron Gurwitz, PhD, is a senior advisor to Summit Trail, a New York-based registered investment advisor.