The market for fixed-indexed annuities (FIAs) – previously known as equity-indexed annuities – is growing rapidly, with sales of more than $60 billion annually. We did a careful analysis of two products that are available on the market. Our conclusion is that these products are not a bad choice for an investor who is extremely sensitive to loss of capital. But a simpler, do-it-yourself alternative is better.
We caution against extending our conclusions to FIAs in general. Our analysis was limited to two products that were the basis of a recent research study by Roger Ibbotson. Those products have higher costs than FIAs in general, and those costs adversely affect their performance.
Explanation of FIAs
Although the details vary, and optional riders are available that further complicate the product choices (we will not consider the optional riders in this investigation), FIAs have certain common features. Those features are governed, in part, by the participation rate, the cap and the surrender fees, each of which I will explain.
The main feature is that FIAs guarantee that the “paper” value of the investor’s account will not fall below a given minimum. Most often, that minimum is the amount that the investor originally put into the account. Thus, the investor is guaranteed not to suffer a loss of principal.
At the same time, the investor participates in a percentage of the growth of an equity index, such as the S&P 500. (Many other indices are available; according to an industry source, more than 100.) For example, the investor might gain 50% of the growth of the index. This percentage is called the participation rate. In the case of an FIA indexed to the S&P 500 or other similar indices, the investor usually participates only in the growth of price, not in dividends.
We emphasize that it is the “paper” value that is guaranteed not to have declined – or not to decline below a pre-set minimum – by the end of certain fixed sub-periods of the term of the annuity; for example, two-year or three-year sub-periods. The reason for this emphasis is that during the term of the annuity – in the example we shall study below it is 12 years – the entire paper value cannot be withdrawn without paying a surrender charge (sometimes the annuitant is allowed to withdraw a small percentage without penalty, or more in the case of extreme hardship). The surrender charge generally declines annually until it is zero at the end of the term of the annuity; at this point the paper value can be withdrawn without penalty.
Thus, the net result is that the value of the annuity that can actually be fully realized is guaranteed not to be less than a pre-set minimum only at the end of the term of the annuity. On the upside, the value may be as much as the participation rate times the gain in the price of the index, in addition to return of the principal paid to purchase it – or substantially more, as we shall see below. However, some FIAs come with a cap on the amount that can be realized from participation in the rise of the index.
The Ibbotson study
Ibbotson, the Yale emeritus professor who is also chairman of Zebra Capital, an investment management firm, has done a study of FIAs that has been cited by the financial media. The chief conclusion cited is that a simulation showed that over the 90 years from 1927-2016, a FIA’s annualized rate of return would have exceeded that of a bond portfolio by about half a percent. In other words, FIAs were a superior investment to bonds over a long historical period.
A deficit of the Ibbotson study is that it analyzed a hypothetical FIA, not one that is (or, to our knowledge, was) actually offered in the marketplace. A hypothetical FIA might be superior to one that can actually be purchased. The hypothetical FIA could have been engineered to make it look good compared to alternatives, especially if the designer had an interest in the result. The only way to tell if the FIA could have been one that would be offered by an insurance company would have been to test whether it was profitable for the offerer as well as for the investor. Unfortunately, that was not done in the Ibbotson study.
Also, in the Ibbotson study, there are some opaque features of the hypothetical FIA, making it difficult to replicate or to check. For example, it uses a “dynamic participation rate.” Instead of the investor’s participation in the rise of the index being a fixed number – for example 50% – it changes over time, according to a formula that is explained in principle but not fully revealed. The changes in that participation rate generated by the formula are, however, shown in a graph in the Ibbotson study, making it at least possible to estimate what the average participation rate was.
The Ibbotson study was not underwritten by any insurer or issuer of FIAs, according to disclosures in the study and our email correspondence with Ibbotson. However, Ibbotson acknowledged that he received input on the study from employees at AnnGen Development, LLC and Annexus, as well as Genesis Financial Development, Inc., an actuarial firm. AnnGen Development LLC is a partnership between Annexus and Genesis Financial of Canada. Genesis helped create the first FIA in 1995 and works with Annexus today in product development, research and marketing. In addition, Ibbotson’s firm, Zebra Capital earns royalties by licensing its indices to Annexus. So it is reasonable to assume that Ibbotson was financially incented to present a favorable view of FIAs, even if his study was not underwritten.
It also helps to understand a bit about how FIAs are marketed. FIAs are normally produced by an insurance company (the manufacturer), often distributed through a marketing organization (called an FMO – field marketing organization) and sold by an agent. For example, there are 17 FMOs contracted beneath Annexus, who have the opportunity to market the Annexus-indexed annuities.
But Annexus has positioned itself as a “super FMO.” It works with a group of FMOs to distribute products. Most fees, however, are not explicitly charged but are embedded in the product’s net annual profits, an estimate of which we will see below. There is no public information about the marketing fees paid by the annuitant to Annexus, the FMOs and the broker.
However, industry sources have told us that typically Annexus gets 2.5%, the FMO gets 2.5% and the agent gets 7.0%. So the client is paying 12.0% in total marketing fees, and this was one of our motivations to understand whether an investor could still be well served while paying fees at those levels. It is our understanding that the typical FIA against which the FIAs we studied competes pays marketing fees of 8.5% to 9.0%.
Two real-world FIAs
We have studied two variants of an FIA that are offered by the Athene Annuity and Life Company, in cooperation with Annexus. In both cases the index that is used is the S&P 500 price index (without dividends). The term of the annuity is 12 years, divided into six two-year sub-periods.
It should be emphasized that the Athene FIA we analyzed is only one of many FIA products available in the marketplace. It is, however, one that is actually offered, as opposed to the hypothetical FIA of the Ibbotson study. But there are many FIAs available that vary widely. Athene’s is not necessarily representative of all of them.
At the end of each sub-period, the paper value of Athene’s annuity is guaranteed not to fall below the original investment. In each sub-period, if the S&P 500’s price has increased, the paper value increases by a percentage of the rise of the index (the participation rate).
In the case of what we will call variant 1), the participation rate is 35%, so that if the index rises by 20% over the two-year period, the paper value of the investor’s asset will increase by 35% of that, or 7%.
In variant 2), the participation rate is 65%, but the insurer levies a 1.5% annual fee, which comes out of the value of the investor’s account, even if it causes the paper value of that account to fall temporarily below its original value.
The paper value of the annuity cannot be realized before the end of the 12th year without paying a surrender charge (with possible exceptions, as mentioned above). The surrender charge is 14.5% during the first year and declining gradually in the years after that until it is zero at the end of the 12th year.
How can the value increase by more than the participation rate times the rise of the index?
We implied earlier that this can happen. We will now explain how. Suppose the participation rate is 50%.
Consider two consecutive two-year periods and suppose in the first case that the index rises by 20% in each of the two periods. Therefore, it rises by 44% over the four years. The investor realizes 50% of 20% in each period, or 10%, therefore experiencing a return of 21% over the four years – not quite half of 44%, but close.
Now suppose instead that in the first two-year period the index declines 20% and in the second two-year period it increases by 80%. The four-year compounded return on the S&P is again 44%. In the first two-year period, however, the investor’s paper value experiences no decline, while in the second two-year period it experiences an increase of 40% – half of the index’s rise. Therefore, in this case the investor’s four-year return is 40%, instead of 21% in the first case.
Thus, the investor’s return depends on the volatility of the index. Greater volatility is in the investor’s favor – at least for the Athene FIA being considered here; it may not hold true for other FIAs with different details. For a given 12-year return on the S&P, the investor will experience the minimum return if the index experienced a steady rise with no volatility. Higher returns will accrue if the index fluctuates wildly from one two-year period to the next.
Study of the Athene annuities
We studied the two variants of the Athene annuity, 1) the one with the 35% participation rate with no fee, and 2) the one with the 65% participation rate with a 1.5% annual fee. We assumed that all parameters remain the same over the subsequent 12 years – participation rate, annual fee, and other parameters such as dividend yield on the S&P 500.
Because the volatility of the index – i.e., the sequence of two-year returns – affects the investor’s gain, Monte Carlo simulation is necessary to estimate the average return over all possible sequences of two-year returns. For each of the two Athene FIAs, we ran 10,001 simulations[i] to find the average and spread of 12-year investment returns with five alternatives: a) the FIA; b) a 100% stock portfolio; c) a portfolio consisting of a 12-year bond held to maturity; d) a 60/40 stock-bond portfolio; and e) a final alternative that we will explain later. We then compared the results.
The Athene alternative with the 65% participation rate proved to have better average returns than the 35% alternative, so we will report only the results obtained with the 65% participation rate.
Unsurprisingly, the average investment return for the annuity falls below the average return for 100% stocks. It also falls below the average return for the 60/40 stock-bond portfolio.
Whether it falls below the 100% bond portfolio depends on the assumed expected return on stocks used in the simulations. The average return on the FIA exceeds the bond return only if the expected return on stocks is 10% or greater. If the expected return on stocks is 9% or less, then the average return on the FIA falls below the return on the bond portfolio. This is because the FIA’s returns are higher when stocks’ returns are higher.
The results of the Ibbotson study are, we note, not inconsistent with this result. Over the 90 years of history used in that study, the average annual return on stocks was 10%, and the result was that the FIA’s average return exceeded the average return on bonds by a small margin of half a percent. (An inspection of the graph in the Ibbotson study of the dynamic participation rate over time suggests that the average participation rate was about 65%.)
In the present day, however, a future expected return on stocks is often assumed that is lower than the average historical return. This is because the anticipated future inflation rate and return on risk-free assets are lower than the experiences of the past. It is common for the assumed expected rate of return on stocks to be 8%.
But this assumption is complicated by the fact that the 10% historical average return on stocks reported in the Ibbotson study is a geometric average of historical returns while the “expected return” used in simulations is an arithmetic average of all the possible returns in the distribution of returns. Since the expected return – the arithmetic average – is higher than the corresponding long-run geometric return, this argument for using a lower expected return than the 10% geometric average return of history may not be correct.
Hence, it is reasonable to conclude that the average anticipated return on the FIA may be at least on a par with the anticipated return on a high-grade 12-year corporate bond. The FIA, in the meantime, avoids all downside risk, if it is held until the end of the 12-year period.
This risk-avoidance is avoidance of only a minimal risk. The Ibbotson study shows that, historically, bonds lost value in only 13% of three-year periods, and that loss was never more than 5% a year. Nevertheless, the assurance that no loss at the end of the period is possible could be of great comfort to an investor with a very strong aversion to any loss; at least, assuming the soundness of the insurer and its government and insurance-industry safety net.
A more direct comparison with the Ibbotson study
The Ibbotson study used three-year sub-periods instead of the two-year sub-periods offered by the Athene products. In order to attempt a more direct comparison with the Ibbotson study, we ran the simulations using four three-year sub-periods, summing to the 12-year term of the annuity.
The results were substantially the same. The FIA performed very slightly worse than the bond even when the assumed expected return on stocks was 10%, but its performance was so close to the bond that it could be considered a wash.
Downsides of the FIA
The Athene FIA has serious downsides. The first is that the full paper value of the account cannot be realized before the 12th year without paying a very substantial – though declining – surrender charge (noting the possible exceptions above).
A second downside is that the insurer reserves the right to change either the participation rate or the annual fee or both, as it so desires, within bounds stated in the regulatory filing. Thus, the initial participation rate and fee rate are not guaranteed to continue past the first two-year period. If the investor finds a change in the participation rate and/or fee rate unsatisfactory, the only way to opt out of the annuity is to pay the surrender charge.
We requested information from Genesis Capital, Athene and Annexus as to the historical data for participation rates and fees for annuities that are already in force but did not receive any responses. However, information we have received from independent sources suggests that Annexus has never reduced its rates.
FIAs are not securities and are not regulated by the SEC, but by state insurance commissioners. Without doing the proper research, the buyer of a FIAs does not know, for example, the commissions being earned by the broker or agent selling the product.
A better alternative
The same pattern of investment returns offered by the FIA can be obtained by purchasing, every two years, a high-quality two-year corporate bond and a two-year SPY at-the-money call option – a call on the SPDR ETF, which tracks the S&P 500. We label this the bond-plus-option strategy.
For example, the most recent yield on two-year corporate bonds reported by the Federal Reserve Bank of St. Louis is, at the time of this writing, 3.28%. If coupons are reinvested at the 6-month Treasury bill rate, which at the time of this writing is 2.56%, then an investment of $0.937 will accumulate after two years to $1.
The remaining $0.063 can be used toward purchase of an at-the-money call option on the SPY. At the time of this writing, the SPY’s price is $249.92 and the ask price for a two-year call option on the SPY with a strike price of 250 is $28.72. Thus, one can buy 0.115 (=28.72/249.92) of an at-the-money call option per unit of SPY.
The $0.063 available to purchase the call option buys 0.063/0.115 or 54.8% of it. We can think of that 54.8% as the rate of participation in the upside. It is likely that an insurance company offering a fixed-indexed annuity uses this or a similar strategy to back up its offer.
This strategy guarantees that the investor will not lose money over any two-year sub-period in the event of a loss in the S&P 500, but will gain 54.8% of any gains that should occur.
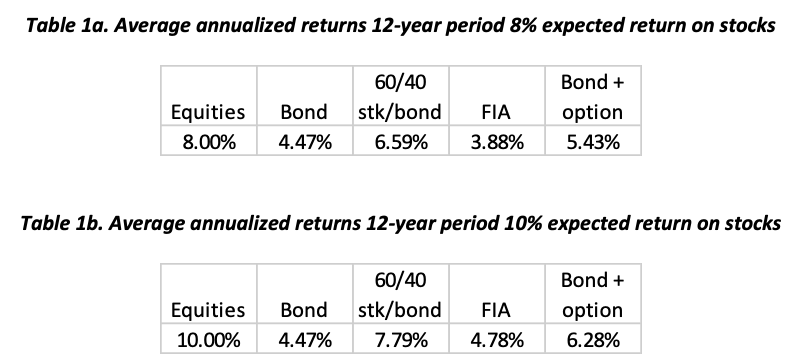
Tables 1a and 1b compare the average returns over a 12-year period for the different strategies. Table 1a is the result of using an 8% expected return on the S&P 500 while Table 1b uses a 10% expected return.

The average return on the bond-plus-option alternative exceeds that of the FIA by about one and a half percent annually.
The bond-plus-option alternative has further benefits as compared with the FIA. It is highly liquid and its full value can be withdrawn at the end of any two-year sub-period – or in between – without the requirement to pay a surrender charge. It is not subject to arbitrary changes in participation rate or fee imposed by the insurance company. However, we have assumed that in the bond-plus-option alternative, both the bond return and the ratio of the price of an at-the-money option on the SPY ETF to the price of the ETF remain constant over the 12-year period, while they may vary over time.
Furthermore, the floor-upside trade-off can be altered with the bond-plus-option strategy simply by adjusting the ratio of bond to option and whether the option is in, out of, or at the money.
The bond-plus-option alternative requires more effort on the part of the investor, or the investor’s advisor, than simply purchasing a FIA. If the investor feels that it is worth the one and a half percent loss of expected return to have the insurance company do it for them, then that alternative may be the more attractive.
We have not considered taxes in these analyses. All returns are before taxes. We assume that the investments are held in a tax-deferred vehicle such as an IRA or 401(k), but differential tax treatment could affect the comparison.
FIAs offer the ability to annuitize and create a lifetime income stream. Correspondingly, the bond-plus-option stream would require an investor to purchase a single-premium immediate annuity (SPIA) or other type of annuity to create a similar lifetime income stream.
Conclusion
For an investor whose utility function involves a very strong aversion to any loss of principal – temporary or permanent – accompanied by a desire to participate in any upside, some FIAs could be a good alternative. If such an investor is advised by an advisor charging as much as one percent, that advisor could truly justify their fee by enabling the investor to engage in the bond-plus-option alternative instead of the FIA.
Economist and mathematician Michael Edesess is adjunct associate professor and visiting faculty at the Hong Kong University of Science and Technology, chief investment strategist of Compendium Finance, adviser to mobile financial planning software company Plynty, and a research associate of the Edhec-Risk Institute. In 2007, he authored a book about the investment services industry titled The Big Investment Lie, published by Berrett-Koehler. His new book, The Three Simple Rules of Investing, co-authored with Kwok L. Tsui, Carol Fabbri and George Peacock, was published by Berrett-Koehler in June 2014.
[i] It is conventional to use an odd number of simulations so that the median result is equal to the result of one of the simulations.
Read more articles by Michael Edesess, Robert Huebscher