Advisor Perspectives welcomes guest contributions. The views presented here do not necessarily represent those of Advisor Perspectives.
This article originally appeared on ETF.COM here.
Despite representing about one-eighth of global equity market capitalization, and despite the attractive valuations and growth prospects, the vast majority of U.S. investors have portfolios that dramatically underweight emerging market stocks. Here’s why that is a costly mistake.
You have a choice to invest in asset class A, which has a one-year forward-looking price-to-earnings (P/E) ratio of 10.6; or asset class B, with a P/E of 15.7. The P/E of B is 48% higher than it is for A. You then look at another valuation metric, the price-to-book (P/B) ratio. You find that A has a P/B of 1.1, while B has a P/B of 2.5. The P/B of B is 2.3 times that of A. And for investors focusing on dividend yields, the yield on A is 2.9% versus 1.9% for B.
A is cheaper by all three metrics. However, perhaps B has better growth prospects? The weighted average historic three-year earnings growth of A was 16.1%, 45% higher than the 11.1% growth for B. The weighted average estimated three- to five-year growth of earnings for A is 15.7%, 21% higher than the 13.0% estimated growth for B.
Comparing the P/E relative to expected earnings growth (the PEG ratio), we find that the forward-looking PEG for A is 0.68 (10.6/15.7) versus 1.21 for B (15.7/13.0). Relative to forecasted growth in earnings, B is trading 1.78 times higher.
Here are some other interesting facts:
- As a group, year-over-year growth in real gross domestic product (GDP) for the countries in A was 5% versus 3% for B.
- The countries in asset class A make up about 28% of the global GDP, higher than the 25% share for B. However, A makes up not much more than 10% of the global market capitalization, while B makes up more than half.
Emerging markets versus the U.S.
By now you likely have figured out that A is emerging market stocks, as represented by the S&P Emerging BMI, and B is the S&P 500 Index. All data is from S&P Dow Jones Indices’ Indexology blog. We can add one more valuation metric, the cyclically adjusted price-to-earnings (CAPE 10) ratio, which is as good a predictor of long-term real returns as we have. CAPE 10 ratios as of the end of October 2018 for emerging markets and for the S&P 500 Index translate into forward-looking real-return forecasts of 6.8% and just 3.4%, respectively.
In addition to fears of a global trade war and increased competition from rising U.S. interest rates (which help explain the current low valuations, meaning those risks are already priced into the market), the underweighting of emerging markets often is a result of two mistakes.
The first, and most prominent, is the well-known home country bias, which causes investors all around the globe to confuse familiar investments with safe investments. Surprisingly, investors tend to believe that not only is their home country a safer place to invest, but it will produce higher returns – defying the basic financial concept that risk and expected return are related.
The second mistake is that investors are subject to recency – allowing more recent returns to dominate their decision-making. From 2008 through October 2018, the S&P 500 Index returned 8.1% per year, providing a total return of 133%. During the same period, the MSCI Emerging Markets Index returned just 0.3% a year, providing a total return of just 3%. It managed to underperform the S&P 500 Index by 7.8 percentage points per year and posted a total return underperformance gap of 130 percentage points.
Compounding the problem was that not only were investors earning much lower returns from emerging market stocks, but they were experiencing much greater volatility. While the annual standard deviation of the S&P 500 Index was about 15% per year, that of the MSCI Emerging Markets Index was about 22% per year. Not exactly a great combination – lower returns with 50% greater volatility. What’s to like?
Destructive investing
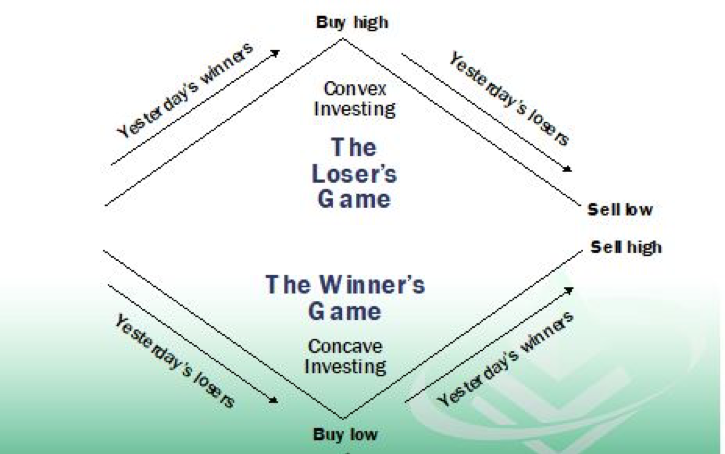
Unfortunately, it’s well-documented that individuals have a strong tendency to invest in a manner destructive to their returns. The illustration below depicts the difference between “convex” and “concave” investing behavior.

While investors know that buying high and selling low isn’t a good strategy, individual investors tend to be performance chasers, buying after periods of strong performance (when valuations are higher and expected returns are thus lower) and selling after periods of poor performance (when valuations are lower and expected returns are thus higher).
Further compounding the problem is that investors tend to have short memories. For example, it wasn’t long ago that investors were piling into emerging market equities due to their strong performance. For the five-year period 2003 through 2007, while the S&P 500 Index provided a total return of 83%, the MSCI Emerging Markets Index returned 391%.
Over the same period, Dimensional data shows that its Emerging Market Value Fund (DFEVX) returned 546%. (Full disclosure: My firm, Buckingham Strategic Wealth, recommends Dimensional funds in constructing client portfolios.) How quickly investors forget!
It’s also worth noting that, while the emerging markets have underperformed by a wide margin in 2018, with data from Portfolio Visualizer showing Vanguard’s FTSE Emerging Markets ETF (VWO) down 11.8% through Nov. 30 while Vanguard’s S&P 500 ETF (VOO) was flat, the story was very different in 2017. In 2017, VWO returned 31.5%, outperforming VOO by 9.7%. VWO also outperformed in 2009 (76.3% versus 26.5%), in 2010 (19.5% versus 15.0%, and in 2012 (19.2% versus 16.0%). The latter data is again from Portfolio Visualizer.
Importance of book-to-market ratio
Michael Keppler and Peter Encinosa, authors of “How Attractive Are Emerging Markets Equities? The Importance of Price/Book-Value Ratios for Future Returns,” published in the Spring 2017 issue of the Journal of Investing, provided us with some further insights as to returns we might expect from emerging markets.
For the period January 1989 through October 2016, they found that the P/B ratio of the MSCI Emerging Markets Index ranged from a low of 0.90 in January 1989 to a high of 3.02 in October 2007 and averaged 1.75. Then they divided the P/B range into three intervals and found:
- For 10 observations, the P/B ratio was below 1.22. The average annual return in U.S. dollars in the four years that followed was 12.9%, and never fell below zero.
- For 273 observations in the second interval, the P/B fell between 1.22 and 2.76. The average annual return in the four years that followed was 9.4%.
- In four observations, the P/B ratio exceeded 2.76. The average annual return in the four subsequent years was -5.1% and was always negative.
As noted in the opening paragraph, the current P/B ratio of emerging markets is just 1.1. When it was below 1.22, the MSCI Emerging Markets Index returned 12.9% over the succeeding four years.
Keppler and Encinosa concluded that there has been a negative relationship between the P/B ratio and future returns in the emerging markets. They also warn investors that focusing on average returns hides a wide dispersion of outcomes.
For example, while their regression analysis led them to forecast a return of 12% per year for emerging markets over the ensuing four years, the data from the prior 28 years indicate the extreme outcomes lay between an annual loss of 8.8% and an annual gain of 36.9%. In other words, risks can show up even when valuations are low – low valuations don’t guarantee higher returns. They just put the odds of earning higher returns in your favor.
The bottom line is that expected returns among emerging market equities are now much higher than they are for U.S. stocks (as well as those in other developed markets, though to a lesser degree).
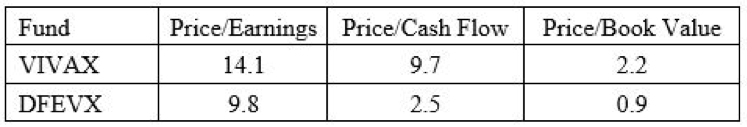
Value perspective
For value investors, the case for emerging market investing is even more compelling. The table below shows the same metrics for Vanguard’s Value Index Fund (VIVAX) and Dimensional’s Emerging Markets Value Fund (DFEVX). (Once again, in the interest of full disclosure, my firm, Buckingham Strategic Wealth, recommends Dimensional funds in constructing client portfolios.) Data is from Morningstar as of Oct. 31, 2018.
Of course, by no means are the higher expected returns a free lunch – they come with greater risks. That said, given emerging markets now make up about one-eighth of global equity capitalization, the starting point to consider is an emerging market allocation of one-eighth of your equity allocation. If you’re an investor who’s willing and able to accept more risk, you might consider a somewhat higher allocation and vice versa.
At any rate, your allocation should not look much different than the global market capitalization – otherwise, you’re betting against the collective wisdom of the market, a very tough competitor. That said, let’s examine the case for global diversification.
Global diversification
Diversification rightly has been called the only free lunch in investing. A portfolio of global equity markets should be expected to produce a superior risk-adjusted return to any one country or region, held in isolation. However, the benefits of global diversification came under attack as a result of the financial crisis of 2008-2009, when all risky assets suffered sharp price drops as their correlations rose toward 1.
When that happened, many investors surmised that global diversification doesn’t work because it fails when its benefits are needed most. That is wrong on two fronts.
First, the most critical lesson investors should have learned is that, because correlations of risky assets tend to rise toward 1 during systemic global crises, their portfolios should be sufficiently allocated to the safest bond investments (investments such as U.S. treasury bonds, FDIC-insured certificates of deposit and rated municipal bonds rates AAA/AA). The overall portfolio should reflect one’s ability, willingness and need to take risk.
During systemic financial crises, the correlations of the safest bonds to stocks – which average about zero over the long term – tend to turn sharply negative. They benefit not only from flights to safety but also from flights to liquidity.
The second lesson many investors failed to understand is that, while international diversification doesn’t necessarily work in the short term, it does work eventually. This point was the focus of a paper by Clifford Asness, Roni Israelov and John Liew, “International Diversification Works (Eventually),” which appeared in the May/June 2011 edition of the CFA Institute’s Financial Analysts Journal.
The authors explained that those who focus on the fact that globally diversified portfolios don’t protect investors from short systematic crashes miss the greater point that investors whose planning horizon is long term (and it should be, or they shouldn’t be invested in stocks to begin with) should care more about long, drawn-out bear markets, which can be significantly more damaging to their wealth.
Diversification for the long term
In their study of 22 developed-market countries during the period 1950 through 2008, the authors examined the benefit of diversification over long-term holding periods. They found that, over the long run, economies and markets don’t exhibit the same tendency to suffer or crash together. As a result, investors should not allow short-term failures to blind them to long-term benefits.
Demonstrating the point that long-term returns are more about a country’s economic performance and that long-term economic performance is quite variable across countries, the authors found that “country specific economic performance dominates long-term performance, going from explaining about 1% of quarterly returns to 39% of 15-year returns and rising quite linearly in time.”
They also found that in terms of worst-case performances, at a one-month holding period, there was very little difference in performance between home-country portfolios and global portfolios. However, as the horizon lengthened, the gap widened. The worst cases for the global portfolios are significantly better (the losses are much smaller) than the worst cases for the local portfolios. And the longer the horizon, the wider the gap favoring the global portfolios.
Summary
Investing in emerging markets entails accepting greater political risk, market risk and currency risk. However, bearing such hazards is the “price” you pay for earning an expected long-term return premium. Current valuations suggest that U.S. equity investors are likely to be disadvantaged if they underallocate to emerging market stocks.
Because we live in a world where there are no accurate crystal balls, the prudent strategy is to build a globally diversified portfolio. But that’s simply the necessary condition for success. The sufficient condition for success is to possess the discipline to stay the course, ignoring not only the clarion cries from those who think their crystal balls are reliable but also the cries from your own stomach to “GET ME OUT!” As Warren Buffett explained, “The most important quality for an investor is temperament, not intellect.”
To help you stay disciplined and avoid the consequences of the dreaded investment disease of recency, the following suggestion is offered. Whenever you are tempted to abandon your well-thought-out investment plan because of poor recent performance, ask yourself this question: “Having originally purchased and owned this asset when valuations were higher and expected returns were lower, does it make sense to now sell the same asset when valuations are currently much lower and expected returns are much higher?”
The answer should be obvious. And if that’s not sufficient, remember Warren Buffett’s advice to never engage in market timing, but if you cannot resist the temptation, you should buy when others panic and sell.
Larry Swedroe is the director of research for The BAM Alliance, a community of more than 140 independent registered investment advisors throughout the country.
Read more articles by Larry Swedroe