What to do When an Investment Strategy Performs Poorly
Membership required
Membership is now required to use this feature. To learn more:
View Membership Benefits“Diversification for investors, like celibacy for teenagers, is a concept both easy to understand and hard to practice.” – James Gipson
Over the almost 25 years that I have been an investment advisor, I’ve learned that one of the greatest problems preventing investors from achieving their financial goals is that, when it comes to judging the performance of an investment strategy, they believe that three years is a long time, five years is a very long time and 10 years is an eternity. Even supposedly more sophisticated institutional investors, those who employ highly paid consultants, typically hire and fire managers based on the last three years’ performance. As Michael Mauboussin, director of research at BlueMountain Capital Management, noted, this tendency “causes investors to often make the critical mistake of assuming that good outcomes are the result of good process and bad outcomes imply a bad process.”
On the other hand, financial economists know that when it comes to investment returns, 10 years is nothing more than “noise,” a random outcome.
To demonstrate that point, the following table shows the persistence of performance of various equity factors (long-short portfolios) as well as the performance of naïve (equal-weighted) portfolios of factors. P1 is an equal weighting of the first four factors. P2 is an equal weighting of the first five. And P3 substitutes quality for profitability. The table has been updated to cover the period from 1927 through 2017 and shows the odds of a negative premium. The odds are based on gross returns before implementation costs. Live funds, even low cost, passively managed ones, have some costs. In addition, if future factor premiums are lower than historical, the odds of underperformance will increase. Of course, this is also true of market beta. As valuations are now higher than the historical average, expected returns are now lower. Note that R. David McLean and Jeffrey Pontiff, authors of the 2016 study Does Academic Research Destroy Stock Return Predictability?, re-examined 97 factors and found that, following publication, the average factor’s return decays by about 32%.
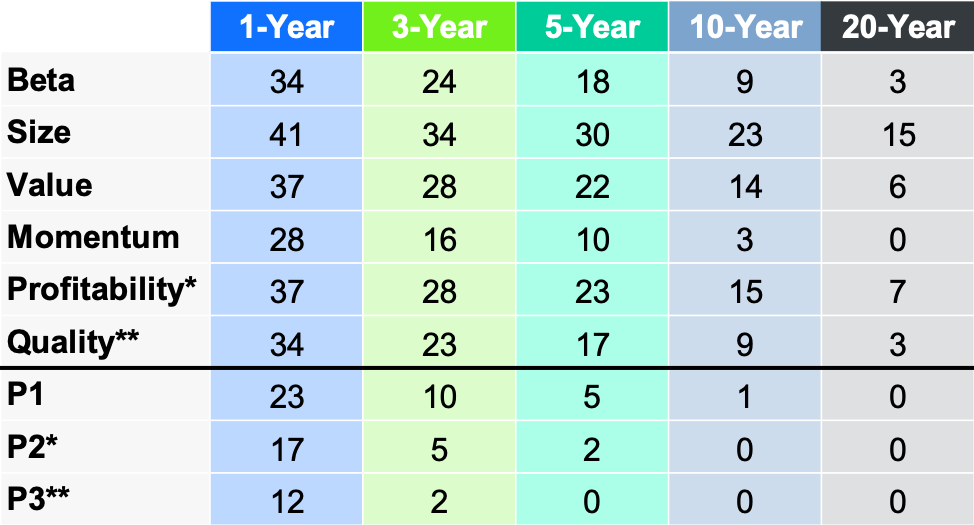
Data for market (beta), size, value, momentum and profitability is based on annual premiums from the Ken French Data Library. Quality is based on monthly data from AQR and compounded to approximate an annual premium. Indices are not available for direct investment. Their performance does not reflect the expenses associated with the management of an actual portfolio, nor do indices represent results of actual trading. Information from sources deemed reliable, but its accuracy cannot be guaranteed. Performance is historical and does not guarantee future results. Using the historical mean and standard deviation, we calculate the likelihood the factor will be negative if the distribution is normal (e.g., percentage of times the premium will be 0 or less). *1964–2017 and **1958–2017 time frames are used for P2 and P3 respectively due to availability of data.
Observe three important things. In each case, the longer the horizon, the lower the odds of underperformance. No matter how long the horizon, each of the individual factors experienced some periods of underperformance, even at horizons of 20 years. The sole exception is momentum at 20 years. However, this certainly doesn’t guarantee future success for momentum at 20-year horizons. Even at 10-year horizons, riskless one-month Treasury bills outperformed highly risky stocks 9% of the time. And even at 20-year horizons, they did so 3% of the time.
The fact that the market-beta premium is expected to be negative 9% of 10-year periods coincides nicely with the following. Historically, the Sharpe ratio (a measure of risk-adjusted return) of the U.S. stock market has been about 0.4. As Cliff Asness pointed out in his thought piece, Liquid at Ragnarök?, given a 0.4 Sharpe ratio the probability of outperforming cash is 51% in a day, 55% in a month, 66% in a year and 90% in 10 years. That means there’s a 10% chance a 0.4 Sharpe ratio strategy makes no money over cash in a decade. Yet, who wouldn’t add some long-term stock exposure if you had none? And importantly, who wouldn’t want another investment with as good a Sharpe ratio as the U.S. stock market but uncorrelated with it?
I’ll return to that shortly. But first we have to cover the third important observation provided by the table, which shows the benefits of diversification – no matter the horizon, the odds of underperformance are lower for each of the three portfolios than for any of the individual factors. That result makes the argument for diversification across multiple sources of risk, as any one factor, asset class or investment strategy can perform very poorly for a very long time. Ron Ross put it this way: “The safest port in a sea of uncertainty is diversification.”
The following table, covering the same periods as the prior table, shows the historical return, standard deviation and Sharpe ratios for the six equity factors Andrew Berkin and I recommend investors consider in Your Complete Guide to Factor-Based Investing because they meet all five of our criteria of persistence, pervasiveness, robustness, implementability and intuitive explanations for why we should expect the premiums to persist in the future.

Data for market (beta), size, value, momentum and profitability is based on annual premiums from the Ken French Data Library. Quality is based on monthly data from AQR and compounded to approximate an annual premium. Indices are not available for direct investment. Their performance does not reflect the expenses associated with the management of an actual portfolio, nor do indices represent results of actual trading. Information from sources deemed reliable, but its accuracy cannot be guaranteed. Performance is historical and does not guarantee future results. Using the historical mean and standard deviation, we calculate the likelihood the factor will be negative if the distribution is normal (e.g., percentage of times the premium will be 0 or less). *1964–2017 and **1958–2017 time frames are used for P2 and P3 respectively due to availability of data.
The table shows that there are other factors that have had similar Sharpe ratios to market beta. And more importantly, it shows the benefits of diversification across factors with low correlation, as the Sharpe ratios of the portfolio were much higher than for any individual factor, including market beta. Thus, why would you not at least consider including them in a portfolio?
The following table, which is also from my book, covers the period from 1964 through 2017 and shows the historical correlations of the six equity factors.

It’s the low to negative correlations that explain the benefits seen in the higher Sharpe ratios of the diversified portfolios. In looking at the historical correlations, it’s important to understand that even uncorrelated doesn’t mean hedged. A hedge would have a correlation of near -1. I’ve highlighted the negative correlations of the momentum premium to the beta, size and value premiums because many investors’ portfolios have significant exposures to those three factors. Thus, adding exposure to momentum (or reducing the negative exposure to momentum that value strategies typically have) has helped diversify portfolio risk.
Despite the obvious benefits, I’ve also learned that diversification away from a market-like portfolio, sometimes called “unconventionality,” creates its own risk. And although it is a risk that is behavioral in nature, it’s a real risk nonetheless. That’s because economists know that periods of random underperformance can lead to tracking-error regret, which in turn leads to the abandonment of even the most well-thought-out plan.
Tracking-error regret
Think of tracking-error regret as the risk that a diversified portfolio underperforms a popular benchmark, such as the S&P 500. Regret over tracking error can lead investors to make the mistake that I call “confusing ex-ante strategy with ex-post outcome.”
Confusing strategy with outcome
Fooled by Randomness author Nassim Nicholas Taleb had the following to say on confusing strategy with outcome: “One cannot judge a performance in any given field by the results, but by the costs of the alternative (that is, if history played out in a different way). Such substitute courses of events are called alternative histories. Clearly the quality of a decision cannot be solely judged based on its outcome, but such a point seems to be voiced only by people who fail (those who succeed attribute their success to the quality of their decision).”
Unfortunately, in investing predicting results is notoriously difficult. Thus, a strategy should be judged in terms of its quality and prudence before, not after, its outcome is known.
January 2008 through September 2018 provides a test
Investors have been faced with a major test of their ability to ignore tracking-error regret. From 2008 through September 2018, major U.S. equity asset classes provided fairly similar returns. While the S&P 500 Index returned 8.9% per year, the MSCI U.S. Prime (Large) Value Index returned 7.2%, the MSCI U.S. Small Cap 1750 Index returned 10.0% and the MSCI U.S. Small Cap Value Index returned 9.1%. The total returns of the four indices were 150%, 111%, 177% and 154%, respectively. Data is from the MSCI Index. As you can see, while small stocks outperformed large stocks, as we should have expected (the table shows that this has occurred about 75% of the time over periods of this length), value stocks, both large and small, underperformed (though this should not be unexpected in the sense that it had been the case about 20% of the time over such horizons).
While U.S. value stocks did underperform, international stocks underperformed by much wider margins. Over the same period, while the S&P 500 Index returned 8.9% per year, the MSCI EAFE Index returned 2.2% per year (total return of 26%) and the MSCI Emerging Markets Index returned 1.1% per year (total return of 13%).
Clearly, investors who diversified globally were hugely disappointed.
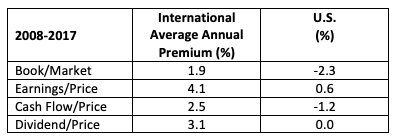
The value story is a bit more complex. While value underperformed in the U.S., if value is “dead,” we should find confirming evidence in other markets. The following table, using data from Ken French’s website, shows the premium for the 10 years from 2008 through 2017 in international developed markets and in the U.S. It shows that in the U.S., depending on how you measured it, the value premium was either negative or negligible, while the value premium was alive and well internationally, no matter how we measured it. This demonstrates that not only is the rumor of the “death of value” premature but also shows the importance of diversifying factor risks globally.
Unfortunately, the poor returns from U.S. value stocks and international stocks led many investors to at least consider abandoning their strategies of global and factor diversification. But should we judge the strategy to have been a poor one based on the outcome? Not when we look at the question through the lens provided by Taleb.
To see the wisdom of taking the correct (Taleb’s) viewpoint, let’s consider an investor at the beginning of this period (one who doesn’t have perfect foresight). How did the world look to that investor? To answer that question, we’ll look at the returns for the prior five-year period.
The good side of tracking error
An investor contemplating their investment strategy looking backward at the start of 2008 would have been reviewing the following returns. For the five-year period from 2003 through 2007, the S&P 500 Index provided a total return of 83%. That was less than half the 171% total return provided by the MSCI EAFE Index and about one-fifth of the 391% return of the MSCI Emerging Markets Index. Yes, the S&P 500 Index underperformed the MSCI Emerging Markets Index by 308 percentage points over just a five-year period.
If you think that’s bad (or impressive, depending on where one was invested), the DFA Emerging Markets Small Cap Fund (DEMSX) provided a total return of 430%, outperforming the S&P 500 Index by 347 percentage points, and the DFA Emerging Markets Value Fund (DFEVX) provided a total return of 546%, outperforming the S&P 500 Index by 463 percentage points. (Full disclosure: My firm, Buckingham Strategic Wealth, recommends Dimensional funds in constructing client portfolios.)
Looking at the domestic asset classes, the S&P 500 Index also underperformed the MSCI U.S. Small Cap 1750 Index by a total of 40 percentage points, the MSCI U.S. Small Cap Value Index by a total of 28 percentage points and the MSCI Prime (Large) Value Index by a total of 14 percentage points.
As you can see, tracking error works both ways. You have to take the positive tracking error with the negative. Importantly, I doubt that any investors looking back at the returns in the period from 2003 through 2007 would have questioned the benefits of building a globally diversified portfolio.
Regrettably, the twin problems of “relativism” (how the performance of your portfolio compares to that of your friends and to popular benchmarks) and “recency” conspire to lead investors to abandon even well-thought-out plans.
Relativism
Unfortunately, too many investors have entered what Vanguard founder John Bogle calls the “Age of Investment Relativism.” Investor satisfaction or unhappiness (and by extension, the discipline required to stick with a strategy) is determined to a great degree by the performance of their portfolio relative to some index (an index that shouldn’t be relevant to an investor who accepts the wisdom of diversification).
Relativism, sadly, can best be described as the triumph of emotion over wisdom and experience. The history of financial markets has demonstrated that today’s trends are merely “noise” in the context of the long term. Bogle once quoted an anonymous portfolio manager, who warned: “Relativity worked well for Einstein, but it has no place in investing.”
Recency
The recency effect – in which the most recent observations have the largest impact on an individual’s memory and, consequently, on their perception – is a well-documented cognitive bias. This bias impacts investment behavior if investors focus on the most recent returns and project them into the future. This is a very common mistake, leading investors to buy what has done well recently (at high prices, when expected returns are now lower) and sell what has done poorly recently (at low prices, when expected returns are now higher). Buying high and selling low is not a prescription for investment success. Yet, that is exactly what many investors do, presumably because of recency bias. And that behavior leads investors to earn lower returns than the very funds in which they invest. A superior strategy is to follow a disciplined rebalancing strategy that systematically sells what has recently performed relatively well and buy what has performed relatively poorly.
We can observe how pernicious the “buy high and sell low” strategy could be by examining current valuations. What we should expect to see is that the dramatic outperformance of the S&P 500 has made U.S. stocks more expensive (have higher valuations) relative to international equities. Valuations are the best predictor we have of future returns. As of the third quarter of 2018, the Shiller cyclically adjusted earnings-to-price (E/P) ratio was just 3.0%. That’s the best estimate of future real returns. By comparison, the CAPE 10 earnings yield (E/P) for the MSCI EAFE Index was at 5.1%, and it was 6.7% for the MSCI Emerging Markets Index.
We can also measure the relative valuations of domestic versus international markets by examining the current valuations of three of Vanguard’s index funds. The data below is from Morningstar as of the end of September 2018:
- U.S. Total Stock Market Index Fund (VTSMX): P/E of 18.0
- Developed Markets Index Fund (VTMGX): P/E of 13.6
- Emerging Markets Index Fund (VEIEX): P/E of 12.4
Investors who abandon the strategy of broad global diversification due to recency would now be selling international and emerging market equities when their valuations are much lower and expected returns are much higher. Since the end of September, they would already have suffered the pains of the lower returns and could at this point be selling low to buy high.
We have one last problem to discuss.
Impatience
Warren Buffett famously noted that when it comes to investing, temperament, which provides the discipline to ignore what economists know are random periods of underperformance and adhere to a well-thought-out plan, is far more important than intelligence. No more proof is required than the negative 0.9% per year return to the S&P 500 Index over the first decade of this century, underperforming riskless one-month Treasury bills by 3.7 percentage points a year. The difference in total returns was 40%! Investors in stocks shouldn’t have lost faith in their belief that stocks should outperform safe Treasury bills due to the experience of that decade.
Here’s a more striking example. Over the 40-year period ending in 2008, U.S. large-cap and small-cap growth stocks both underperformed long-term U.S. Treasury bonds. I would hope that investors didn’t abandon the idea that these risky assets should be expected to outperform in the future just because they had experienced a long period of underperformance. Yet, when it comes to international investing, perhaps because of home-country bias, investors are far too willing to abandon well-thought-out strategies involving global diversification of international equities. And they are also willing to abandon value strategies, and any other strategy that has performed poorly in the recent past.
As I have discussed previously, investors in risky assets (such as stocks, and more specifically, small and value stocks) should expect to experience some very long periods in which those risky assets underperform. If that wasn’t the case, there would not be any risk.
Before closing, we have one more point to address. If 10 years isn’t sufficient time to determine if a strategy no longer works, how do we know what makes a good strategy? To have confidence that a factor premium should persist and wasn’t just the result of data mining (a lucky/random outcome), you need evidence that it has been not only persistent over very long periods of time and across economic regimes but also pervasive across sectors, countries, geographic regions and even asset classes; is robust to various definitions (value, for example, which works using many different metrics); survives transactions costs; and that there are intuitive risk- or behavioral- based explanations for the premium.
But we are not yet done. There is one other thing to consider: valuations. Even good investments can become bad if valuations become excessive (as was the case for growth stocks in March 2000). In other words, we need to ask, has a strategy become too expensive? That’s always possible, as bubbles have occurred in several different asset classes.
Let’s consider the two recently poorly performing strategies that were mentioned earlier – international investing and value. You’ve already seen that valuations for both non-U.S. developed-market stocks and emerging-market stocks are now much cheaper than they are for U.S. stocks. Since valuations are the best predictor we have of expected returns, we should expect that international stocks will provide higher, not lower, returns going forward. Now, that doesn’t mean they are “better” investments. It means that the market perceives them to be riskier and thus demands a risk premium for investment. Now let’s turn to the relative valuation of value stocks to see if there has been what economists would call a regime change – has publication of the strategy and its subsequent popularity led to cash flows that drove valuations up, eliminating the premium?
I kept a table from a seminar Dimensional gave in 2000. It shows that at the end of 1994, the P/B ratio of large-growth stocks was 2.1 times the P/B ratio of large-value stocks. Using Morningstar data, as of October 11, 2018, the iShares S&P 500 Growth ETF (IVW) had a P/B ratio of 5.4, and the iShares S&P 500 Value ETF (IVE) had a P/B ratio of just 2.1 – the spread has actually widened from 2.1 to 2.6. Thus, value stocks are cheaper today, relative to growth stocks, than they were shortly after Fama and French published their famous research.
We can also look at the P/E metric. In 1994, according to the Dimensional table, the ratio of the P/E in large-growth stocks relative to the P/E in large-value stocks was 1.5. As of October 11, 2018, and again using Morningstar data, IVW had a P/E ratio of 21.6 and IVE had a P/E ratio 14.8. Thus, the ratio, at 1.5, was unchanged.
There’s no evidence here that cash flows have eliminated the premium.
We see similar results when we look at small stocks. The Dimensional data shows that at the end of 1994 the P/B of the CRSP 9-10 (microcaps) was 1.5 times as large as the P/B of small-value stocks. Using Morningstar data, the ratio of the respective P/B metrics of Dimensional’s microcap fund (US Micro Cap Fund [DFSCX]) and its small-value fund (US Small Cap Value Fund [DFSVX]) was the same 1.5 (2.0 ÷ 1.35) as of August 31, 2018. When we look at P/E, again the results are similar. At the end of 1994, the ratio of those funds’ respective P/E metrics was 1.2; it is now the same 1.2 (17.7 ÷ 14.4). Again, there is no evidence that cash flows have eliminated the premium. Yet, I hear this argument all the time – cash flows have “killed” the premium.
Using data from Ken French’s website, we also see similar results when we look at the period starting in 2008. In 2008, the ratio of the P/B of U.S. growth stocks (4.8) to U.S. value stocks (1.1) was 4.4. At the end of 2017, the ratio had increased to 5.3 (6.3 ÷ 1.2), the opposite of what you would expect if cash flows had eliminated the premium. Claims of the death of the value premium are wrong.
Summary
Investment strategy should be based on the following few core principles. The market is highly, though not perfectly, efficient. It therefore follows that all risky assets have similar risk-adjusted returns (including accounting for the risk of illiquidity). Third, it then follows that you should diversify your portfolio across as many unique sources of risk that meet the criteria (persistence, pervasiveness, robustness, implementability and intuitiveness) you have established for investment.
But while diversification has been called the “only free lunch in investing,” it doesn’t eliminate the risk of losses. And diversification does require accepting the fact that parts of your portfolio may behave entirely differently than the portfolio itself and underperform a broad market index for a very long time. In fact, a wise person once said that if some part of your portfolio isn’t performing poorly, you are not properly diversified. The result is that diversification is hard. As Cliff Asness noted in his piece, “losing unconventionally is hard.” He also observed that living through hard times is harder than observing them in backtests. That difficulty helps explain why it’s so hard to be a successful investor. One reason is the aforementioned problem of relativism, which has no place in investing.
While achieving diversification is simple, living with it is hard, just as Warren Buffett noted that “investing is simple, but not easy.” Knowing your level of tolerance for tracking-error risk, and investing accordingly, will help keep you disciplined. Conversely, taking more tracking-error risk than you can stomach (or handle) is a prescription for failure. The less tracking error you are willing to accept, the more the equity portion of your portfolio should look like the S&P 500 Index. On the other hand, if you choose a market-like portfolio, it will not be very diversified by source of risk and will have no international diversification. At least between these two choices (avoiding or accepting tracking error), there is no free lunch. As Michael Maubossin noted: “A quality investment philosophy is like a good diet: it only works if it is sensible over the long haul and you stick with it.” Agreeing with Warren Buffett, he also observed: “Investment philosophy is really about temperament, not raw intelligence.”
It is almost as important to get the balance between diversification and tracking-error regret right as it is to determine the appropriate equity/fixed-income allocation. If you have the discipline to stick with a globally diversified, passive asset class strategy, you are likely to be rewarded for your discipline. The same holds true for investments in other risky assets, such as alternatives, including the ones my firm recommends, such as AQR’s Style Premia Alternative R6 (QSPRX) and Alternative Risk Premia R6 (QRPRX) (both long-short, factor-based strategies), as well as Stone Ridge’s Alternative Lending Risk Premium Fund (LENDX) (small business, consumer and student loans), Reinsurance Risk Premium Interval Fund (SRRIX) and All Asset Variance Risk Premium Fund (AVRPX). (Full disclosure: My firm, Buckingham Strategic Wealth, recommends AQR and Stone Ridge funds in constructing client portfolios.)
A fitting conclusion is this observation by Robert Rubin: “Individual decisions can be badly thought through, and yet be successful, or exceedingly well thought through, but be unsuccessful, because the recognized possibility of failure in fact occurs. But over time, more thoughtful decision-making will lead to better results, and more thoughtful decision-making can be encouraged by evaluating decisions on how well they were made rather than on outcome.”
Larry Swedroe is the director of research for The BAM Alliance, a community of more than 140 independent registered investment advisors throughout the country.
Membership required
Membership is now required to use this feature. To learn more:
View Membership BenefitsSponsored Content
Upcoming Virtual Events View All


