Advisor Perspectives welcomes guest contributions. The views presented here do not necessarily represent those of Advisor Perspectives
With the U.S. stock market hitting all-time highs, a question you may be asking yourself is, how should I be feeling about that? Phrased another way, how common are market highs? Are they extremely rare and should I be panicking or are they pretty much par for the course?
To try and answer these questions we must put market highs into historical context.
The Eye Test
The chart below illustrates the growth of $1 invested in U.S. large cap stocks on January 1, 1926. At the end of September 2018, after factoring in the reinvestment of dividends, $1 was worth $8,129!

Data Source: Morningstar. Based on month-end values with dividend reinvestment.
Looking at this chart, you would think that the markets are hitting new highsi pretty much all the time! Unfortunately, this chart obscures a less rosy reality.
The stats
Over the almost 93-year history set out in the chart, U.S. large cap stocks experienced 119 periods where a drawdown occurred (i.e. where the value fell below its prior peak as measured at month-end). And although the average drawdown was -6.8%, there were eight time periods where the decline was greater than -20%. As you would expect, the largest of all the declines was the 83% plummet in the Great Depression followed by the 51% drop during the 2008-09 Financial Crisis.
The average time from peak to trough was just three months, although this ranged from as little as a month to the 34-month decline during the Great Depression. Recoveries took longer, five months on average. Generally, the deeper the decline, the longer the recovery. Where the decline was in excess of -20%, it took an average of three and half years to recover.
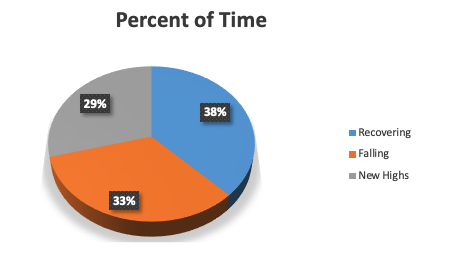
As a result, the average U.S. stock market investor spends the vast majority of their investing life with the value of their portfolio below prior highs. 71% of the time in fact. As illustrated in the following chart, since 1926 investors in U.S. large cap stocks spent 33% of the time watching the value of their stock portfolio fall, 38% of the time watching it recover and 29% of the time watching it hit new highs.
Source: Tacita Capital Analysis with Morningstar data. Based on month-end values with dividend reinvestment.
That was probably not what you were expecting after looking at the chart on the first page. But what this does tell us is that market highs do occur with some relative frequency and are not complete unicorns. Nor are they the natural steady state. New highs are one of three normal and surprisingly balanced parts of the market cycle.
What about a more balanced portfolio, you might ask? Most people do not invest 100% of their portfolio in stocks anyway. Certainly a more balanced mix will lead to better results. Unfortunately, this is true only to a degree.
A balanced mix
A balanced investor with a portfolio comprised of 35% intermediate-term U.S. government bonds and 65% large-cap U.S. stocks, that rebalanced quarterly, endured 135 periods of drawdown. That is nearly 13% more than the “stock only” investor! Surely a more balanced portfolio must have experienced shorter drawdowns? Well, the average decline period was the same as the stock market, three months.
Where a balanced investor has historically won is their average decline was less than the stock market: –4.3% vs. -6.8% for the “stock-only” investor. Of course, a balanced investor wins big during more severe stock market corrections. Some other good news is that the average recovery period was shorter by a month.
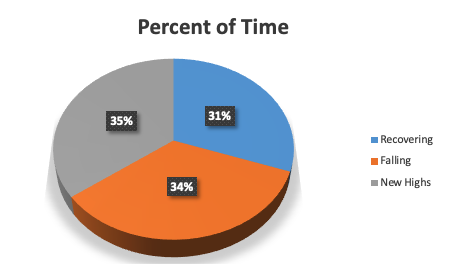
Based on month end data there was some improvement in the amount of time a balanced portfolio was “under water”, but not as much as you might hope. As illustrated on the following page, balanced investors spent 34% of the time watching their portfolios fall in value, 31% watching them recover and 35% enjoying new highs. So, balanced investors spent 65% of their time below prior highs vs. 71% for “stock-only” investors.
Source: Tacita Capital. Based on month-end values with dividend and interest reinvestment.
An improvement to be sure, but probably not as big as you were hoping for.
So, what did we learn?
New market highs are not uncommon and are in fact part of a normal market cycle of drawdowns, recoveries and new highs. Any portfolio decisions or performance reviews need to recognize this to avoid knee jerk decision making.
However, investors need to be aware that when measured against the previous high, their portfolio will be spending most of the time below it and fighting to get back to it. Understanding this inevitability (and looking at your portfolio versus prior lows as well as prior highs) hopefully makes it a little easier to bear and helps you make it through to enjoy the next market high, before the cycle begins all over again.
Tacita Capital Inc. is based in Toronto, Canada and is a private, independent family office and investment counseling firm that specializes in providing integrated wealth advisory and portfolio management services to families of affluence. We understand the challenges of affluence and apply the leading research and best practices of top financial academics and industry practitioners in assisting our clients to reach their goals.
i For purposes of this article, we define highs to include reinvestment of dividends and interest.
Read more articles by Harmish Naik