Advisor Perspectives welcomes guest contributions. The views presented here do not necessarily represent those of Advisor Perspectives.
Advisors routinely assume the benefits from diversifying across equity asset sub-classes and between equities and bonds. But they ignore the even greater benefit from diversifying among categories of bonds.
Always clever, Brian Portnoy, recently wrote Diversification Means Always Having To Say You're Sorry.
Ben Hunt doubled down with:
- It is a fact that value has waaay underperformed the S&P 500.
- It is a fact that trend has waaay underperformed the S&P 500.
- It is a fact that quality has waaay underperformed the S&P 500.
- It is a fact that emerging markets have waaay underperformed the S&P 500.
- It is a fact that real assets have waaay underperformed the S&P 500.
- It is a fact that hedge funds have waaay underperformed the S&P 500.
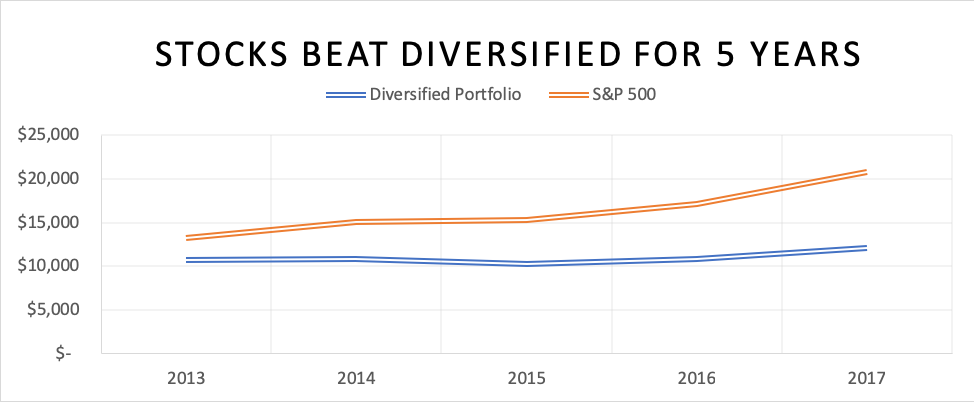
Everything has underperformed the S&P 500. Hence diversification has been a multi-year fail. Expressed in one graph, the S&P 500 versus an equal-weighting of all the major asset classes: U.S. and non-U.S. stocks, U.S. and non-U.S. bonds, real-estate, commodities, and cash.1

After five years of this advisors are tired of talking about it and investors are tired of listening. One could build a strong case for a diversification rally. But for now, diversification hasn’t worked.
Except for bonds.
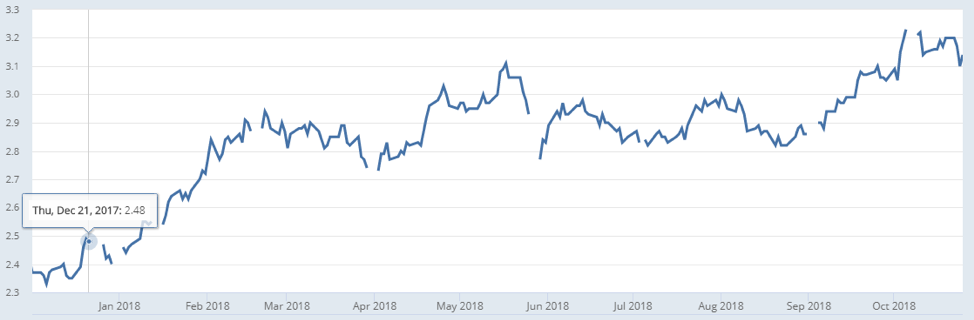
Since President Trump signed the $1.5 trillion tax-cut package December 21, 2017, 10-year Treasury yields have climbed roughly 70 basis points.
10-Year Treasury Constant Maturity Rate (DGS10) Federal Reserve Bank of St. Louis
This has pushed bond prices and returns down. Year-to-date, every conventional bond category is down in total-return, except for high-yields. I exclude non-conventional categories (agencies, senior loans, preferreds, convertibles, emerging markets, TIPS, and high-yields), which advisors generally shun. Instead, they own the usual categories of U.S. and non-U.S. governments and corporates – the staples of the Barclays Aggregate and Global Aggregate indices.
As evidence, in the last two years2, 92 fixed-income ETFs have been issued, yet only 11 are diversified into multiple categories and none of these own all the 12 taxable fixed-income categories3 in material weights.
This is a shame, since if they were widely-diversified, outcomes could improve. Advisors need to add more non-conventional bonds. However, as most income investors are risk averse and protective of not just their buying power, but their principal, advisors should resist the urge to boost returns with riskier high-dividend stocks, MLPs and REITs.
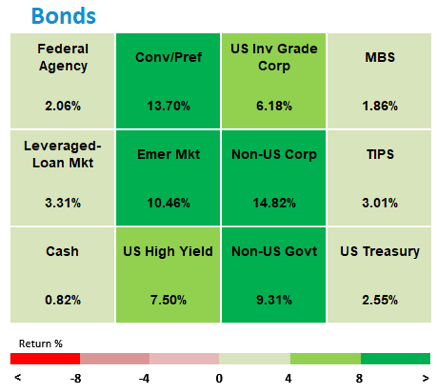
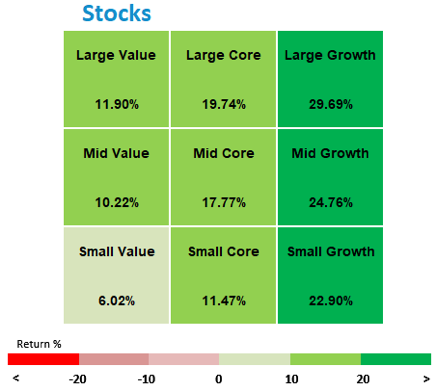
In other words, diversification works for bonds, just as it does for stocks. The simplest way to illustrate this is to compare the variation of returns among stock categories to the variation of returns among bond categories. Simple returns barometers are below.
The spread between the lowest returns (small value) and highest (large growth) was five-fold for stocks4, whereas for bonds the spread between the lowest (cash), and the highest (non-U.S. corporate bonds) was eighteen-fold5. Last year (2017) was not an anomaly – I have calculated this data for years. The average correlation among the 12 bond categories has consistently been below .40, which signals a well-diversified mix.
Many advisors and investors are surprised to see that the variability of returns among bond categories is so wide. The only way to benefit from this is to invest in non-conventional bond categories in meaningful amounts.
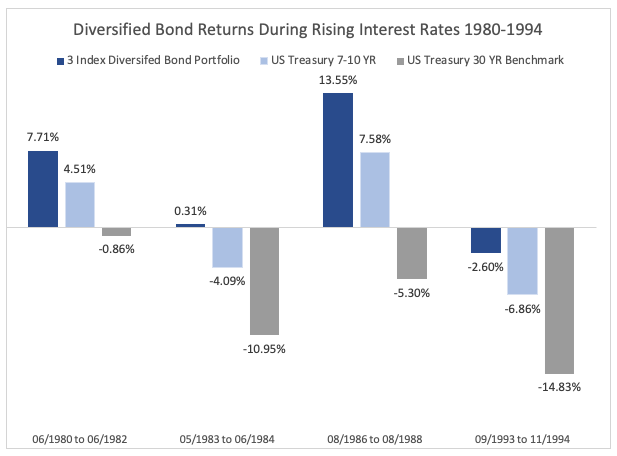
Wide diversification has consistently been effective during what many consider to be the biggest threat to bond returns – rising rates. The 10-Year U.S. Treasury bond yield rose at least 2% four times from 1980 through 1994. In each of those four periods, diversification triumphed. A simple portfolio of one-third each U.S. Government, Corporate, and Mortgages outperformed intermediate and long-term U.S. Treasury bonds in each period.6
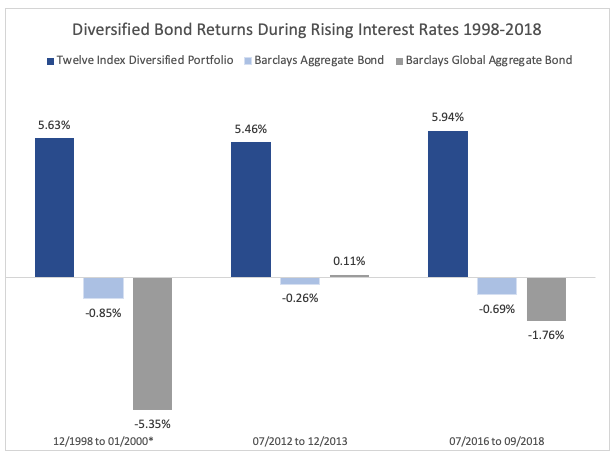
The same results occurred in the three periods from 1998 through 2018 when the 10-year Treasury rose by at least 1.5%. For these comparisons, I used an even wider diversified portfolio7, since more investable asset classes were developed by 1998.
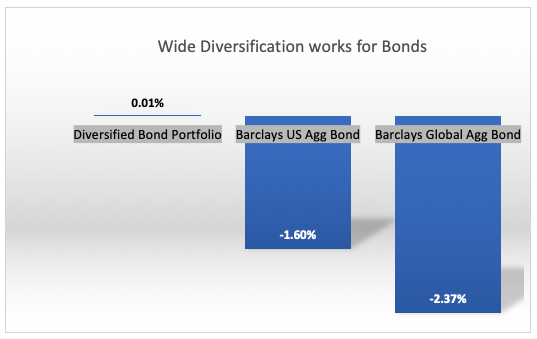
Finally, year-to-date through 9/30/18, when as mentioned before 10-year Treasury yields climbed some 70 basis-points, diversification has again been a reliable remedy.8
If advisors widen their asset class choices when building fixed income portfolios, investor outcomes will improve.
Andy Martin is co-founder and president of 7Twelve™ Advisors, LLC., and creator of 3Twelve™ Total Bond. He has developed mutual fund, VA sub-account, UIT, and structured note products. His book Dollarlogic: A Six-Day Plan to Achieving Higher Returns by Conquering Risk, foreword by Arthur B Laffer, Ph.D., was 2016 Winner: American Book Fest, Personal Finance/Investing.
None of the information in this article should be construed as investment advice.
1 Diversified Portfolio--Equal weighted, Large U.S. Equity: S&P 500 Composite Return, Non-U.S. Equity: MSCI EAFE GD, U.S. Bonds: Bloomberg Barclays U.S. Aggregate Index, Non-U.S. Bonds: Citi World Government Index, Real Estate: FTSE Nareit All REITs, Commodities: S&P GSCI TR, Cash: 3-Month Treasury Bill: Secondary Market Rate, Percent, Annual, Federal Reserve Economic Data. (12/13/12-12/31/17) Indexes are not investable.
2 From 12/31/16-10/11/18, according to ETF.com
3 Agencies, Bank Loans, Non-U.S. Governments, Investment Grade Corporates, Convertibles/Preferreds, Emerging Markets, Money Markets, U.S. Treasurys, High Yields, Non-U.S. Corporates, TIPS, Mortgage Backed.
4 Stocks, Morningstar “Style Box,” Past performance is no guarantee of future returns. Diversification does not guarantee a profit or protect against loss, 12/31/16 through 12/31/17, Source: Morningstar, Inc.
5 Bonds, Federal Agency: BBgBarc U.S. Agency TR; Conv/Pref: BofAML Convertible Bonds All Qualities; U.S. Inv Grade Corp: BBgBarc U.S. Credit TR U.S.D; MBS: BBgBarc GNMA TR; Leveraged Loan: S&P/LSTA U.S. Leveraged Loan 100 TR; Emer Mkt: JPM EMBI Global Core TR; Non-U.S. Corp: S&P International Corp Bd TR; TIPS: BBgBarc U.S. Treasury U.S. TIPS TR; Cash: BBgBarc U.S. Treasury Bill 1-3 Mon TR; U.S. High-Yield: BBgBarc U.S. Corporate High Yield TR; Non-U.S. Gov: BBgBarc Global Treasury Ex U.S. TR; U.S. Tsy: BBgBarc U.S. Treasury 7-10 Yr TR, Source data: Morningstar, Inc., 12/31/16 through 12/31/17
6 3 Index Diversified Bond Portfolio: Equal weight of BBgBarc U.S. MBS TR U.S.D, FTSE U.S.BIG Treasury 3-7 Yr U.S.D, FTSE U.S.BIG U.S.D equally-weighted. U.S. Treasury 7-10 YR, FTSE U.S.BIG 7-10 YR U.S.D, U.S. Treasury 30 YR Benchmark, FTSE Treasury Benchmark 30 Yr OTR U.S.D., Source data: Morningstar, Inc.
7 Twelve Index Diversified Portfolio: Equal weight of BBGBarc U.S. Agency TR U.S.D, S&P/LSTA U.S. Leveraged Loan 100 TR U.S.D, BBgBarc Global Treasury Ex U.S. TR U.S.D, BBgBarc U.S. Credit TR U.S.D, ICE BofAML All U.S. Convertible TR U.S.D, JPM EMBI Global Core TR U.S.D, BBgBarc Short Treasury 1-3 Mon TR U.S.D, BBGBarc U.S. Treasury 7-10 Yr TR U.S.D, BBgBarc U.S. Corporate High Yield TR U.S.D, S&P International Corporate Bond TR U.S.D, BBgBarc U.S. Treasury U.S. TIPS TR U.S.D, BBgBarc GNMA TR U.S.D.
8 ibid. Year-to-date through 9/30/18.
Read more articles by Andy Martin